

Abstract
The neuromodulator adenosine plays an important role in many physiological and pathological processes within the mammalian CNS. However, the precise mechanisms of how the concentration of extracellular adenosine increases following neural activity remain contentious. Here we have used microelectrode biosensors to directly measure adenosine release induced by focal stimulation in stratum radiatum of area CA1 in mouse hippocampal slices. Adenosine release was both action potential and Ca2+ dependent and could be evoked with low stimulation frequencies and small numbers of stimuli. Adenosine release required the activation of ionotropic glutamate receptors and could be evoked by local application of glutamate receptor agonists. Approximately 40% of stimulated-adenosine release occurred by translocation of adenosine via equilibrative nucleoside transporters (ENTs). This component of release persisted in the presence of the gliotoxin fluoroacetate and thus results from the direct release of adenosine from neurons. A reduction of adenosine release in the presence of NTPDase blockers, in slices from CD73−/− and dn-SNARE mice, provides evidence that a component of adenosine release arises from the extracellular metabolism of ATP released from astrocytes. This component of release appeared to have slower kinetics than the direct ENT-mediated release of adenosine. These data suggest that activity-dependent adenosine release is surprisingly complex and, in the hippocampus, arises from at least two distinct mechanisms with different cellular sources.
Key points
Using microelectrode biosensors we have directly measured the adenosine release induced by focal stimulation in stratum radiatum of area CA1 in mouse hippocampal slices.
Approximately 40% of stimulated-adenosine release occurred by translocation of adenosine from neurons via equilibrative nucleoside transporters (ENTs).
The remaining adenosine release arises from the extracellular metabolism of ATP released from astrocytes by exocytosis.
Isolation of the individual components of adenosine release revealed their different kinetics with adenosine release via ENTs markedly faster than the adenosine release that arises from ATP exocytosis.
These data illustrate the complexity of activity-dependent adenosine release: in the hippocampus, adenosine release occurs by at least two distinct mechanisms with different cellular sources and kinetics.
Introduction
The neuromodulator adenosine is involved in a great number of physiological CNS functions and can either be neuroprotective or promote neurodegeneration during pathological states such as hypoxia, epilepsy and ischaemia depending on the brain region affected and the subtype of receptor activated (Boison, 2009, 2012; Dale & Frenguelli, 2009; Pugliese et al. 2009; Lopes et al. 2011). In the hippocampus, adenosine is released by tetanic or theta burst stimulation, can be directly detected with biosensors (Zur Nedden et al. 2011; Diógenes et al. 2012) and plays an important role in gating synaptic plasticity (Arai et al. 1990; de Mendonça & Ribeiro, 1994; Costenla et al. 1999; Rex et al. 2005; Zur Nedden et al. 2011). However, the mechanism of how the adenosine is released into the extracellular space is still, in many areas of the brain, unclear. This uncertainty stems from the potential complexity of adenosine release, with a variety of release mechanisms, which may differ depending on the brain region and on the properties of the releasing stimulus (reviewed in Latini & Pedata, 2001; Wall & Dale, 2008). Adenosine can be directly released by transport out of the cell by specific transporter proteins (for example, via equilibrative nucleoside transporters: Jonzon & Fredholm, 1985; White & MacDonald, 1990; Gu et al. 1995; Cunha et al. 1996; Lovatt et al. 2012) and also be directly released from neurons by exocytosis (Klyuch et al. 2012a). Adenosine release can also be indirect: following rapid (Dunwiddie et al. 1997) extracellular ATP metabolism, with ATP released by exocytosis from neurons (White & MacDonald, 1990; Jo & Schlichter, 1999; Pankratov et al. 2007) or glial cells (Zhang et al. 2003; Pascual et al. 2005; Serrano et al. 2006), or via gap junction hemi channels (Pearson et al. 2005; Huckstepp et al. 2010). Adenosine release may be further complicated if these release mechanisms occur together (for example see Cunha et al. 1996).
Trains of action potentials release adenosine in the calyx of Held (Kimura et al. 2003; Wong et al. 2006), cerebellum (Wall & Dale, 2007) and caudate putamen (Cechova & Venton, 2008). In the hippocampus high frequency stimulation (HFS) depresses synaptic transmission via the release of adenosine to activate A1 receptors (Mitchell et al. 1993; Manzoni et al. 1994). This phenomenon has been studied by several groups and there are currently two major hypotheses of how the adenosine is released. First, astrocytes release ATP by exocytosis and this ATP is metabolised to adenosine in the extracellular space (Zhang et al. 2003; Pascual et al. 2005; Serrano et al. 2006). This form of adenosine release is abolished in dn-SNARE mice, which selectively express a dominant negative form of the SNARE protein in glia. In contrast, Lovatt et al. (2012) showed that the firing of individual hippocampal pyramidal cells directly releases adenosine, via equilibrative nucleoside transporters (ENTs). The increased metabolic load, imposed by activity, increases the intracellular metabolism of ATP through to adenosine, increasing the outward adenosine concentration gradient leading to efflux. This form of adenosine release persists in mice which cannot metabolise extracellular ATP to adenosine but is blocked by ENT inhibitors. In both cases the release of adenosine was monitored indirectly via inhibition of (field) excitatory postsynaptic potentials ((f)EPSPs).
To further characterise adenosine release in the hippocampus, we have directly monitored extracellular adenosine concentration following focal stimulation. We have used microelectrode biosensors together with pharmacological manipulation and transgenic mice to elucidate and quantify the mechanisms of adenosine release. Our data support previous studies that adenosine can be released in the hippocampus both directly from neurons by ENTs and indirectly as ATP by exocytosis from glial cells. It extends the field by demonstrating the relative proportions of these two pathways of release and their dynamic properties.
Methods
Preparation of hippocampal slices
Parasagittal hippocampal slices (400 μm) were prepared from 6- to 12-week-old C57 BL/6 mice. Mice were killed by cervical dislocation and then decapitated in accordance with the UK Animals (Scientific Procedures) Act 1986. The brain was rapidly removed, cut along the midline and the two halves of the brain stuck down on their medial surface. Slices were cut on a Microm HM 650V microslicer in cold (2–4°C) high Mg2+, low Ca2+ artificial cerebrospinal fluid (aCSF), composed of (mm): 127 NaCl, 1.9 KCl, 8 MgCl2, 0.5 CaCl2, 1.2 KH2PO4, 26 NaHCO3, 10 d-glucose (pH 7.4 when bubbled with 95% O2 and 5% CO2). Slices were stored in aCSF (1 mm MgCl2, 2 mm CaCl2) at 34°C for 1 h and then at room temperature for a further 1–6 h.
Recording from slices
An individual slice was transferred to a recording chamber, submerged in aCSF and perfused at 6 ml min−1 (32°C). For stimulation, to evoke adenosine release, square voltage pulses (2–5 V, 200 μs duration) were delivered by an isolated pulse stimulator ISO-STIM 01M (NPI, Tamm, Germany) via a concentric bipolar metal stimulating electrode (FHC, Greenville, PA, USA) placed on the surface of area CA1. Adenosine release was evoked by trains of stimuli (100 stimuli per train, at a frequency of 1–20 Hz), with a 5–10 min interval between trains. For extracellular recording, an aCSF-filled microelectrode was placed in stratum radiatum of CA1. Extracellular recordings were made using an EXT-10C extracellular amplifier (NPI), filtered at 1 kHz and digitised on line (10 kHz) with a Micro 1401 interface controlled by Spike2 software (v. 6.14) (Cambridge Electronic Design, Cambridge, UK). A perfusion pipette (PDES-02DX, NPI) was used to pressure eject N-methyl-d-aspartate (NMDA) or glutamate onto the surface of CA1 with pressures of 0.1–0.5 bar applied for 0.2–1 s.
Biosensor characteristics
Biosensors were obtained from Sarissa Biomedical Ltd (Coventry, UK). Four types of sensor were used in this study. First, a screened null sensor, possessing the matrix but no enzymes, was used to control for the release of any non-specific electro-active interferents. Secondly, screened ADO biosensors (Llaudet et al. 2003) containing adenosine deaminase, nucleoside phosphorylase and xanthine oxidase (responsive to adenosine and its metabolites inosine and hypoxanthine) were used. ADO biosensors show a linear response up to 20 μm adenosine (Llaudet et al. 2003) and a 10–90% rise-time of ∼10 s, although this was measured from bath application of adenosine and is considerably faster for rapid adenosine application. Thirdly, we used screened ATP biosensors which consisted of the entrapped enzymes glycerol kinase and glycerol-3-phosphate oxidase (Llaudet et al. 2005). Glycerol (2 mm) was included in the aCSF as it is a co-substrate required for ATP detection. Finally, screened glutamate biosensors, consisting of entrapped glutamate oxidase, were used to measure stimulated glutamate release (Tian et al. 2009). Biosensors were calibrated with 10 μm adenosine, ATP or glutamate before the slice was present in the perfusion chamber and after the slice had been removed, allowing measurement of any reduction in sensitivity during the experiment. The screening of biosensors, to reduce interference from electro-active substances, was routinely checked by applying 10 μm 5-hydroxytryptophan (5-HT), which typically produced little or no response. Adenosine, ATP or glutamate biosensors together with null sensors were inserted into stratum radiatum of the CA1 area (see Fig. 1A for positioning). Sensors were fully inserted so that some of the sensing area protruded out of the bottom of the slice. This ensured no unstirred layer of slice under the sensor. In some control experiments, sensors were positioned just above the surface of the slice, bent so their longitudinal surface was parallel to the stratum radiatum in CA1. After insertion of sensors, slices were left to recover for 15–30 min before starting experiments. This allowed any released ATP/adenosine/glutamate to wash away following damage to cells. Signals were acquired at 1 kHz with a Micro 1401 interface using Spike2 (v. 6.14) software (Cambridge Electronics Design).
Figure 1. Electrical stimulation in CA1 of the hippocampus releases adenosine.
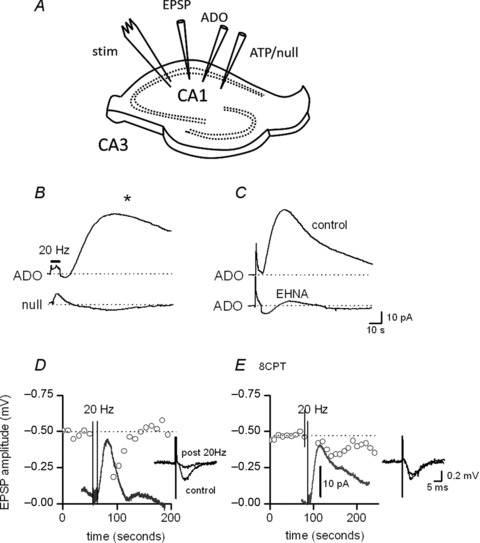
A, diagram illustrating the positioning of biosensors and electrodes in a hippocampal slice. B, ADO biosensor (top) and null sensor (bottom) traces. Stimulation (100 stimuli, 20 Hz) evoked a rapid short-lived response on both the null and ADO biosensor but only evoked a large slower response (*) on the ADO biosensor. C, ADO biosensor traces in control (top) and following addition of EHNA (20 μm, bottom). EHNA caused a marked inhibition (∼95%) of the slow component of the ADO biosensor current, confirming that it results from either the detection of adenosine or metabolites derived from the extracellular metabolism of adenosine. D, graph plotting the amplitude of individual fEPSPs against time. Following 20 Hz stimulation, there is marked inhibition of EPSP amplitude (∼63%) and increase in adenosine concentration, as illustrated by the adenosine biosensor trace. The amplitude of fEPSPs are not plotted during the train. Inset, superimposed individual fEPSPs before and immediately after the train. E, graph plotting the amplitude of individual fEPSPs against time in the presence of 1 μm 8-CPT, to block A1 receptors. A 20 Hz stimulation has little effect on fEPSP amplitude, although the extracellular adenosine concentration still increases, as shown by the adenosine biosensor trace. The amplitude of fEPSPs are not plotted during the train. Inset, superimposed individual fEPSPs before and immediately after the train. Data from D and E are from the same slice. The biosensor traces are aligned with the fEPSP plots and are at the same time base.
CD73(-/-) transgenic mice
The cd73 gene was disrupted in C57BL/6 mice by homologous recombination and activation of the Cre-loxP system (Koszalka et al. 2004). Knockout and wild-type mice were generated by the interbreeding of heterozygous CD73 mice. Mice were genotyped using two pairs of primers. The first primer pair (reverse 5′ CGATGCCCTTCAGAGGATAA 3′, forward 5′ ACGGTGTGGAAGGACTGATT 3′) detected a band in CD73+/+ DNA of 300 bp. For detection of the knockout, a second primer pair (reverse 5′ TGTAACCCCGATAAGCTTGG 3′, forward 5′ CGGGCTGCTCAAAATAAGAG 3′) was used and gave a band of 700 bp. In the heterozygote both bands (300 and 700 bp) were present. Comparison of adenosine release in CD73+/+ and CD73−/− mice was performed with an interleaved design using slices from CD73+/+ and CD73−/− mice (littermates).
dn-SNARE transgenic mice
In dn-SNARE mice, the cytosolic portion of the SNARE domain of synaptobrevin 2 (amino acids 1–96, SNARE) is selectively expressed in astrocytes, a manipulation that blocks glio-transmission (Pascual et al. 2005). Two mice lines were crossed to generate the dn-SNARE mice, hGFAP.tTA and tetO.SNARE. When these lines are crossed doxycycline suppresses SNARE, EGFP and lacZ expression. Removal of doxycycline (for at least 3 weeks) leads to selective expression of SNARE, EGFP and lacZ in astrocytes (Pascual et al. 2005). This was confirmed by observing EGFP fluorescence in hippocampal slices with confocal microscopy.
The breeding and use of transgenic mice was approved by the University of Warwick ethics committee in accordance with the UK Animals (Scientific procedures) Act 1986.
Drugs
All drugs were made up as stock solutions, stored frozen and then thawed and diluted with aCSF on the day of use. Fluoroacetate (FAC), erythro-9-(2-hydroxy-3-nonyl) adenine (EHNA), EGTA, dipyridamole, adenosine, glutamate, S-(4-nitrobenzyl)-6-thioinosine (NBTI) and 8-cyclopentyltheophylline (8-CPT) were purchased from Sigma (Dorset, UK). 6-Cyano-7-nitroquinoxaline-2,3-dione (CNQX), d-(–)-2-amino-5-phosphonopentanoic acid (d-AP5) and tetrodotoxin (TTX) were purchased from Ascent Scientific (Bristol, UK). ATP was purchased from Roche (Indianapolis, IN, USA). All substances were dissolved in distilled water except NBTI, which was dissolved in DMSO (final concentration of DMSO in aCSF was 0.05%, which had no effect on biosensors or tissue responses), and d-AP5, which was dissolved in equimolar sodium hydroxide.
Data analysis and statistics
Data are presented as mean ± SEM. Statistical analysis was performed with paired and unpaired Student t-tests. The significant level was set at P < 0.05. The decay time course of biosensor currents was determined from exponential fits (Origin v8, GE Healthcare, Little Chalfont, UK) made to individual currents after baseline removal.
Results
Adenosine is released by local stimulation in area CA1 of hippocampal slices
Local electrical stimulation with a train (100 stimuli, 20 Hz) in stratum radiatum of area CA1 in the hippocampus reliably produced a signal on an adenosine biosensor placed in this layer (see Fig. 1A for positioning of electrodes). The signal consisted of a fast rising and decaying early component, which persisted during stimulation, also present on null sensors placed in CA1, and resulted from the detection of EPSPs and action potentials by the biosensor (Dale et al. 2000) followed by a slower signal (Fig. 1B). As this slow current was absent on null sensors (Fig. 1B) it resulted from an increase in the extracellular purine concentration. Inhibition of adenosine deaminase with 20 μm EHNA, which prevents biosensor detection of adenosine with no effect on the detection of adenosine metabolites inosine or hypoxanthine (Wall & Dale, 2007; Kluych et al. 2012a), reduced the amplitude of the slow biosensor signal by 86 ± 4% (n= 8) demonstrating that the major purine detected was adenosine (Fig. 1C). In 36 slices, the mean amplitude of the ADO biosensor current following stimulation (20 Hz, 100 stimuli) was 35 ± 4 pA, which is equivalent to the detection of ∼ 0.25 μm adenosine. Similar concentrations of adenosine were detected in the molecular layer of cerebellar slices with the same stimulation paradigm (Wall & Dale, 2007). Adenosine release could also be detected if the adenosine biosensor was laid parallel to the surface of area CA1 (n= 8, as in Wall & Dale, 2007). This confirms that the adenosine release measured does not arise as a consequence of damage to the slice following biosensor insertion.
The release of adenosine inhibits synaptic transmission
Glutamatergic transmission, from Schaffer collaterals, onto CA1 pyramidal neurons is strongly inhibited by adenosine activating A1 receptors (Dunwiddie & Hoffer, 1980). Thus, if sufficient adenosine is released during stimulation this should inhibit glutamate release, an effect which should be prevented by A1 receptor antagonists (see Mitchell et al. 1993). To test this, fEPSPs were recorded simultaneously with the biosensor detection of adenosine release. In four slices, following 20 Hz stimulation (100 stimuli) synaptic transmission was depressed (68 ± 5%) with approximately the same time course as the adenosine signal detected on the biosensor (Fig. 1D). Following the addition of 1 μm 8-CPT, to block A1 receptors, the release of adenosine could still be detected by the biosensor but there was little or no depression of fEPSPs (7 ± 5%, n= 4, Fig. 1E). Thus, sufficient adenosine is released by stimulation to inhibit glutamatergic synaptic transmission onto CA1 pyramidal cells.
Adenosine release is dependent on the activation of ionotropic glutamate receptors
Adenosine release was abolished by the sodium channel blocker TTX (1 μm, n= 7), demonstrating that the release of adenosine is action potential dependent (Fig. 2A). In four slices adenosine release was also abolished by substitution of normal aCSF with Ca2+-free aCSF (Mg2+ increased to 3 mm and with 1 mm EGTA, Fig. 2B). It is possible that adenosine is directly released by stimulation, following the opening of voltage gated Ca2+ channels as a result of action potential firing, as observed in the cerebellum (Wall & Dale, 2007) or instead stimulation may indirectly release adenosine. For example, stimulation could result in neurotransmitter release, which, as a downstream action, activates receptors leading to extracellular adenosine release (see Wall & Dale, 2008 for review). Since stimulation will release glutamate from Schaffer collaterals, we investigated whether ionotropic glutamate receptor antagonists could block adenosine release. Application of CNQX (10 μm) and d-AP5 (50 μm), to block NMDA and non-NMDA receptors, reversibly abolished adenosine release (7 out of 7 slices, Fig. 2C). Application of the AMPA receptor antagonist CNQX (20 μm) alone reduced adenosine release by 77.5 ± 4.3% (range of inhibition 10–95%, n= 12, Fig. 2D). Adenosine release was also reduced by blocking NMDA receptors (with 50 μm d-AP5, mean inhibition 73.5 ± 12%, n= 7, range of inhibition 25–100%, Fig. 2E). Thus, adenosine release requires the activation of ionotropic glutamate receptors, either NMDA or AMPA/kainate receptors, which are activated by the glutamate released by stimulation.
Figure 2. Properties of adenosine release: adenosine release is glutamate receptor dependent.
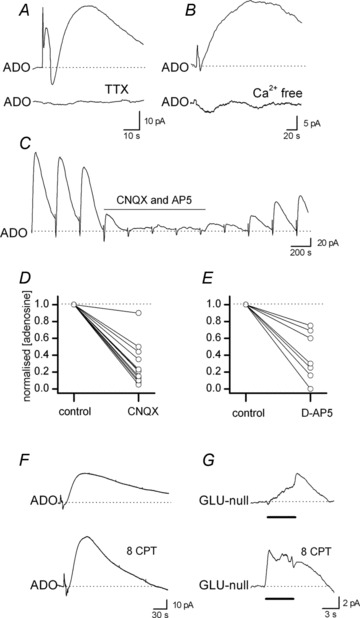
A, ADO biosensor traces in control (top) and following addition of TTX (1 μm, bottom). TTX abolished the stimulated increase in adenosine concentration. B, ADO biosensor traces in control (top) and following addition of Ca2+-free aCSF (bottom). The removal of extracellular Ca2+ prevented an increase in adenosine concentration following stimulation. C, example of a biosensor recording (20 Hz stimulation applied every 5 min). Addition of the glutamate receptor antagonists, 10 μm CNQX and 50 μm d-AP5, abolished stimulated increases in adenosine concentration. Upon wash there is only partial recovery, which may reflect a downward trend in adenosine release throughout the recording. D, graph summarising the effects of the AMPA receptor antagonist CNQX (20 μm) on the normalised concentration of adenosine detected following stimulation (n= 12 slices). E, graph summarising the effects of the NMDA receptor antagonist d-AP5 (50 μm) on the normalised concentration of adenosine detected following stimulation (n= 7 slices). F, example of an adenosine biosensor recording in control (top) and in the presence of the A1 receptor antagonist 8-CPT (2 μm, bottom). In 8-CPT the amount of adenosine detected, following stimulation, increased by 72%. G, example of a glutamate biosensor recording of the increase in glutamate concentration following 20 Hz stimulation in control (top) and in 8-CPT (bottom). The area and amplitude of the glutamate biosensor signal was increased in 8-CPT. The line denotes the period of stimulation (20 Hz). The biosensor records have had the response from the null sensor subtracted.
Block of A1 receptors (2 μm 8-CPT) increased the amount of adenosine detected (mean increase 65 ± 6%, n= 12, Fig. 2F), suggesting either feedback inhibition of adenosine release by the adenosine released or an inhibitory effect of a basal extracellular adenosine tone (see Klyuch et al. 2012b). This effect could result from an increase in the amount of glutamate released by the stimulation, as the amount of glutamate detected by glutamate biosensors was increased in 8-CPT (Fig. 2G, n= 3). Blocking A2a receptors (with 100 nm ZM 241385) following block of A1 receptors (8-CPT) had no significant effect on the amount of adenosine detected (n= 4), suggesting A2a receptors do not modulate the release of adenosine.
Adenosine is directly released by local application of either glutamate or NMDA to CA1
Since adenosine release depends on the activation of ionotropic glutamate receptors, application of glutamate receptor agonists onto CA1 should directly evoke adenosine release. Short (0.2–1 s), focal applications of either glutamate (10–25 mm) or NMDA (100–200 μm) onto the surface of CA1 produced a signal on the adenosine biosensor (Fig. 3A, n= 15). This signal consisted of two components: a fast transient component which was also present when aCSF was applied, probably a pressure artefact, and a much larger slower component which was absent when aCSF was applied, reflecting adenosine release. Both signals were absent from null sensors and the adenosine release was greatly reduced (85 ± 5%) in the presence of either CNQX or d-AP5 (n= 3) and thus results from the activation of ionotropic glutamate receptors (Fig. 3B). Glutamate-evoked adenosine release persisted in TTX (1 μm, n= 10) but was greatly reduced by the removal of extracellular Ca2+ (Mg2+ increased to 3 mm with 1 mm EGTA, n= 6, reduction 75 ± 3%, Fig. 3C).
Figure 3. Adenosine release is evoked by glutamate receptor agonists.
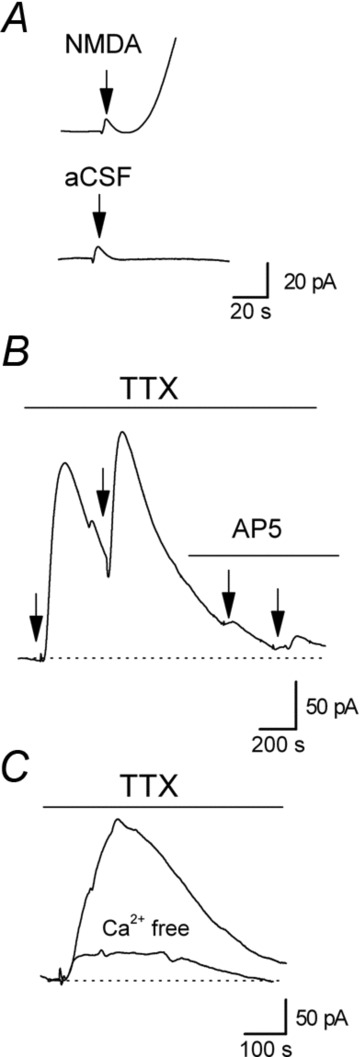
A, focal application of NMDA (0.5 s puff) onto the surface of CA1 induced a small pressure artefact (at arrow) followed by a much larger, delayed slower component which is absent if only aCSF is applied (using the same perfusion pipette at the same pressure). B, focal application of NMDA (0.5 s puff) induced an increase in the extracellular concentration of adenosine in the presence of 1 μm TTX to block action potentials. NMDA was applied twice in control (1 μm TTX, application at arrows) and then was applied in the presence of the NMDA receptor antagonist d-AP5 (50 μm), which prevented an increase in adenosine concentration. This confirms that increases in adenosine concentration evoked by puffing on NMDA result from NMDA receptor activation rather than from a pressure change. C, superimposed biosensor adenosine traces following application of glutamate (1 s puff) in control aCSF (with 1 μm TTX) and in Ca2+-free aCSF (3 mm Mg2+, 1 mm EGTA). Glutamate was applied in Ca2+-free aCSF first, to prevent any run down of release due to depletion of adenosine stores, and then an increase in adenosine concentration was evoked after normal aCSF was washed in.
Properties of adenosine release
To investigate how the amount of adenosine detected by the biosensor depends on stimulation parameters, the frequency of stimulation, amplitude and number of stimuli were altered. Initially the number of stimuli was kept constant (100) while the frequency of stimulation was reduced from 20 to 1 Hz (n= 6). Reducing stimulation frequency either had little effect (two slices) or actually increased the amount of adenosine detected (four slices, Fig. 4A–C). This contrasts with the effects seen in the cerebellum, where the amount of adenosine detected scaled with the stimulation frequency, reaching a maximum at around 20 Hz (Wall & Dale, 2007). These effects of stimulation frequency may reflect changes in the amount of glutamate released, the amount of glutamate receptor activation and therefore downstream adenosine release. This was investigated using glutamate biosensors (Tian et al. 2009) to measure the change in extracellular glutamate concentration produced by stimulation at different frequencies (5 and 20 Hz). The glutamate biosensor waveform had a similar amplitude at 5 and 20 Hz but a significantly larger area at 5 Hz (n= 4, Fig. 4D), which presumably leads to prolonged receptor activation and greater adenosine release.
Figure 4. Frequency dependence of adenosine release.
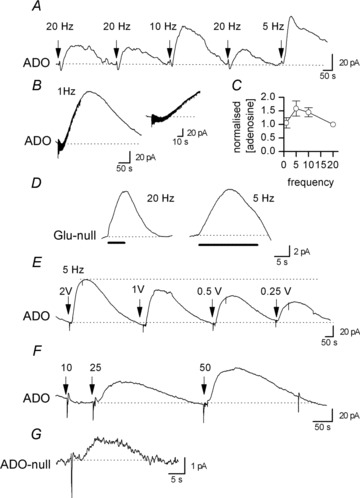
A, biosensor recording of increases in extracellular adenosine concentration evoked with different stimulation frequencies, with the number of stimuli kept constant (100). Changing the stimulation frequency from 20 to 10 Hz and then from 20 to 5 Hz increased the concentration of adenosine detected. B, biosensor recording of the increase in adenosine concentration produced by 1 Hz stimulation (100 stimuli). Inset, an expanded portion of the trace from B showing that the rise in extracellular adenosine concentration occurs after ∼30 stimuli. C, graph summarising the effect that changing the stimulation frequency has on the concentration of adenosine detected following stimulation. The adenosine concentration is normalised to the concentration detected at 20 Hz and summarises data from six slices. D, glutamate biosensor recordings illustrating the increase in extracellular glutamate concentration produced by 20 and 5 Hz trains of stimuli. The filled line indicates the stimulation period. The records have had the null sensor responses subtracted to leave the glutamate concentration transient. E, example of an adenosine biosensor trace, illustrating how the concentration of adenosine detected scales with the stimulation voltage (5 Hz, 100 stimuli). F, example of a biosensor trace showing how the concentration of adenosine detected scales with the number of action potentials (stimuli). No increase in extracellular adenosine concentration, above baseline, could be detected with only 10 stimuli, but with 25 and 50 stimuli, increasing concentrations of adenosine could be detected. The stimulation frequency was 5 Hz. G, example of a biosensor trace (ADO-null) illustrating an increase in adenosine concentration produced by a single stimulus.
The concentration of adenosine detected was proportional to the stimulation strength, presumably as greater areas of fibres are activated by a larger stimulus (Fig. 4E, n= 3) and the number of stimuli (Fig. 4F, n= 4). The minimum number of stimuli required to produce detectable adenosine release varied from slice to slice, presumably depending on the distance between the release sites and the biosensor and also on the biosensor sensitivity (range 1–3 nA for 10 μm). For example in Fig 4F 10 stimuli (at 5 Hz) was insufficient to produce detectable adenosine release whereas 25 stimuli produced marked release. In many slices as few as five stimuli could produce detectable adenosine release and in a small number of slices (3 out of 15), a single stimulus produced detectable release, although the biosensor waveform was only a few picoamperes in amplitude and thus close to the limits of resolution (Fig. 4G). In the rest of the paper a stimulation train of 100 stimuli at 20 Hz was used, to produce reproducible adenosine release with a minimal stimulation time and to avoid contamination of the rising phase of the biosensor waveform with stimulation artefacts.
A proportion of adenosine arises from extracellular ATP metabolism
Following stimulation, adenosine could either be directly released (Lovatt et al. 2012; Klyuch et al. 2012a) or instead could arise from the extracellular breakdown of ATP released from neurons or glia (Jo & Schlicter, 1999; Pascual et al. 2005; Pankratov et al. 2007). To investigate whether adenosine arises from ATP, we first tried to directly measure ATP release with ATP biosensors. As in the cerebellum (Wall & Dale, 2007) and during seizure activity in hippocampal slices (Lopatářet al. 2011), we could not detect any increase in extracellular ATP concentration during adenosine release (n= 8, Fig. 5A). If, however, cells were electroporated using a high stimulation voltage (20–25 V) we could clearly measure a large increase (1.5 ± 0.3 μm) in extracellular ATP concentration (Fig. 5A inset, n= 3, also see Wall & Dale, 2007). Because the metabolism of ATP is extremely rapid (Dunwiddie et al. 1997), any ATP that is released could be metabolised before it reaches the biosensor. Thus, NTPDase-mediated ATP metabolism was inhibited using sodium polyoxotungstate (POM-1; 100 μm, Wall et al. 2008). POM-1 reduced the amount of adenosine detected in 6 out of 9 slices (mean biosensor signal remaining 43.2 ± 11.2% of control, n= 6, Fig. 5B and C) with no effect in 3 slices (Fig. 5C). This inhibition was not fully reversible (recovery to 69.6 ± 9.5% of control, Fig. 5B and C) and did not reveal a signal on the ATP biosensor (n= 4). As the effects of POM-1 on ATP metabolism are fully reversible (Wall et al. 2008), a proportion of the inhibition probably results from off-target effects on glutamate release, which are slow to reverse (Wall et al. 2008). The effects of POM-1 on glutamate release have a slow onset, which may account for the variation in reversal across slices. It was also observed that the decay of the adenosine waveform was consistently (5 out of 6 slices) faster in POM-1 (Fig. 5B, inset), suggesting that the adenosine arising from the extracellular metabolism of ATP (blocked by POM-1) could represent a slow component of the waveform.
Figure 5. Inhibition of NTPDases reduces adenosine release.
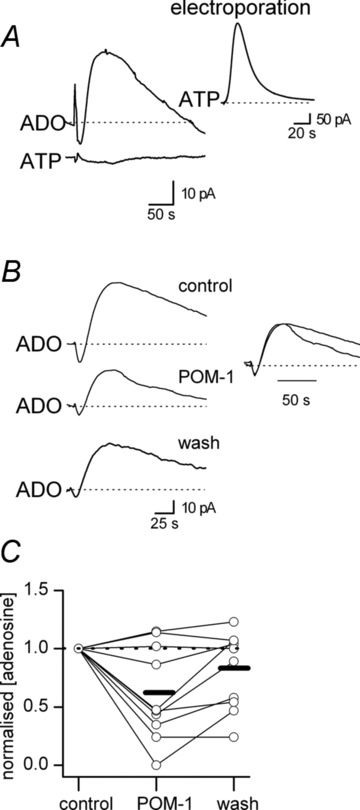
A, example ADO and ATP biosensor traces during stimulation (both biosensors were inserted into CA1). Although an increase in adenosine was detected, the concentration of ATP did not increase above baseline. Inset, increasing the stimulation strength (to 25 V) electroporates the cells under the stimulating electrode leading to a large increase in extracellular ATP concentration (1.8 μm). B, an example experiment showing biosensor traces in control, in the presence of the NTPDase inhibitor POM-1 (100 μm) and in wash. Application of POM-1 reduced the concentration of adenosine detected by 44% with partial recovery to 78% of the control concentration. The inset shows superimposed normalised adenosine waveforms from control and in POM-1 illustrating a speeding up of decay kinetics in the presence of POM-1. C, graph summarising the effects of the NTPDase inhibitor POM-1 (100 μm) on the normalised increase in adenosine concentration produced by stimulation (n= 9 slices). The concentration of adenosine detected in POM-1 and in wash were normalised to control.
To determine unequivocally whether adenosine arises from extracellular ATP metabolism we made use of CD73−/− mice, which lack the enzyme ecto-5′-nucleotidase (Koszalka et al. 2004) and thus can only weakly break down extracellular AMP to adenosine (Klyuch et al. 2012a; Lovatt et al. 2012). As with previous experiments, using cerebellum slices, we first confirmed that hippocampal slices from mice lacking CD73 (5′-nucleotidase) have reduced metabolism of ATP and AMP to adenosine. ATP and AMP (30 μm) were applied to hippocampal slices and the adenosine produced by native enzymes in the slice was measured with an adenosine biosensor placed on the surface of CA1. In CD73+/+ mice, 30 μm ATP produced 3.1 ± 0.4 μm adenosine (n= 11) whereas in slices from CD73−/− mice only 0.4 ± 0.2 μm adenosine (n= 11) was detected, a reduction in adenosine production of ∼90% (Fig. 6A and B). Similar results were found with the extracellular metabolism of AMP (CD73+/+ 5.4 ± 0.5 μm, n= 5, vs. 0.5 ± 0.3 μm CD73−/−, n= 7, a reduction of ∼90%, Fig. 6A and B). We next investigated the effects of ATP on synaptic transmission (see Klyuch et al. 2012a). fEPSPs of similar amplitude were recorded in slices from CD73+/+ and CD73−/− mice and were reduced in amplitude to a similar extent by 50 μm adenosine (85 ± 1.5 vs. 89 ± 2.2% inhibition, n= 5, Fig 6C and D). Application of ATP (50 μm) produced almost the same reduction in fEPSP amplitude as adenosine (50 μm) in slices from CD73+/+ mice (mean reduction 81 ± 1.9 vs. 85 ± 2.2%, n= 5, Fig. 6C), with the same time course (time from start to peak of inhibition 62 ± 9.7 vs. 58 ± 7.3 s, Fig. 6C). In contrast, the inhibitory effect of ATP on fEPSP amplitude was significantly (P= 0.0014) reduced compared to adenosine in slices from CD73−/− mice (mean reduction 55 ± 1.7 vs. 85 ± 2.2%, Fig. 6D) and the time course of inhibition was greatly slowed (time from start to peak of inhibition 148 ± 17 s vs. 52 ± 5 s, Fig. 6D). This provides independent evidence that the deletion of the 5′-nucleotidase in CD73−/− mice greatly reduces the conversion of ATP to adenosine. Furthermore the lack of ecto-5′-nucelotidase is not bypassed by overexpression of additional enzyme pathways, allowing the metabolism of ATP to adenosine. The small amount of adenosine produced from ATP and AMP may result from the action of alkaline phosphatase or the E-NPP family of enzymes (Zimmermann, 2000). This confirms previous studies that showed unchanged alkaline phosphatase and E-NPP expression and activity following deletion of CD73 (Langer et al. 2008). The difference from Zhang et al. (2012) may reflect the different line of Cd73−/− mice used in that study.
Figure 6. Adenosine release is present but reduced in CD73−/− mice.
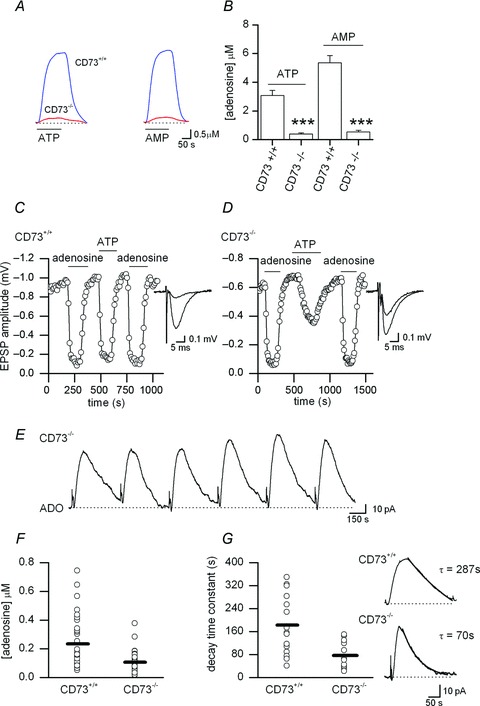
A, ADO biosensor traces recorded from hippocampal slices from CD73+/+ and CD73−/− mice following application of 30 μm ATP (left) and 30 μm AMP (right). B, summary of ATP and AMP extracellular metabolism from CD73+/+ and CD73−/− mice (n= 11 ATP metabolism in CD73−/− and CD73+/+ mice, n= 5 AMP metabolism CD73+/+ mice, n= 7 AMP metabolism CD73−/− mice). C, graph plotting EPSP amplitude against time recorded in a slice from a CD73+/+ mouse. Application of either adenosine (50 μm) or ATP (50 μm) produced the same reduction of EPSP amplitude (∼90%) with the same time course. Inset, superimposed average EPSPs in control and in 50 μm ATP, from experiment in C. D, graph plotting EPSP amplitude against time recorded in a slice from a CD73−/− mouse. Application of ATP (50 μm) produced a smaller reduction (∼ 45%) in EPSP amplitude than adenosine (50 μm, ∼ 90%) with a much slower time course. Inset, superimposed average EPSPs in control and in 50 μm ATP, from experiment in D. E, example of biosensor recording of stimulated adenosine release from a CD73−/− slice. F, graph summarising the concentration of adenosine detected following stimulation (20 Hz, 100 stimuli) in slices from CD73+/+ and CD73−/− mice (n= 31–36). G, graph summarising the decay time constant (τ) of the adenosine waveform recorded in slices from CD73+/+ and CD73−/− mice (n= 13–15). Inset, example biosensor traces recorded in slices from CD73+/+ and CD73−/− mice with the decay fitted with a single exponential, time constant given.
Although the breakdown of ATP to adenosine is almost abolished in hippocampal slices from CD73−/−mice, adenosine release in response to stimulation could still be detected (n= 18 mice, 31 slices, Fig. 6E) and had the same properties of release in CD73+/+ mice: blocked by glutamate receptor antagonists (n= 6), abolished by TTX (n= 3), etc. As in wild-type mice, puffing of glutamate or NMDA onto CA1 in slices from CD73−/− mice elicited adenosine release, which persisted in TTX but was greatly reduced in zero Ca2+ (n= 4). Thus, a major proportion of the released adenosine arises independently from the extracellular metabolism of ATP.
Examining the data in more detail revealed that there was significantly (P= 0.00041) less adenosine detected following stimulation in slices from CD73−/− mice compared to slices from CD73+/+ littermates (105 ± 1.5 nm, n= 31 vs. 245 ± 5 nm, n= 36, Fig. 6F). There was also a change in the time course of the biosensor current (Fig. 6G) with a noticeably faster decay in CD73−/− mice. The decay was best described with a single exponential, with the time constant of decay (τ) significantly (P= 0.0018) smaller in slices from CD73−/− mice than in slices from CD73+/+ mice (78 ± 12, n= 13 vs. 182.5 ± 25 s, n= 15). All the data together, including the effects of blocking NTPDases, strongly suggests that a slower component of adenosine release results from the release of ATP.
ENT inhibitors reduce adenosine release and slow kinetics
Data from the CD73−/− mice and NTPDase inhibitors suggest that a substantial proportion of the adenosine is released directly and not via extracellular ATP metabolism. This could occur via ENTs as a result of an increased metabolic load produced by the glutamatergic activation of neurons and/or glial cells (Lovatt et al. 2012). To test this, adenosine release was stimulated in wild-type mice in the presence of NBTI (5 μm) and dipyridamole (10 μm) to block ENT 1 and ENT 2 (Dunwiddie & Diao, 1994; Frenguelli et al. 2007; Wall & Dale, 2007). This significantly (P= 0.004) reduced the concentration of adenosine detected by adenosine biosensors (mean reduction 39.5 ± 5%, range 24–60%, n= 8 slices, Fig. 7A and B) following a 20–30 min application. Experiments were done in 8-CPT (1–2 μm) to prevent any build-up of endogenous adenosine activating A1 receptors and reducing adenosine release. As well as reducing the amount of adenosine released, blocking ENT 1 and 2 also significantly slowed the kinetics of the adenosine waveform (Fig. 7B, inset). The latency, defined as the time interval from the beginning of stimulation to the point where the adenosine waveform goes above baseline (Fig. 7C and inset), was significantly increased (P= 0.0001) from 12.6 ± 2.4 to 26.3 ± 3 s (Fig. 7C). The rise, measured as the time from the beginning of the rise in adenosine concentration to the peak, and decay, described by a single exponential, were significantly slowed: rise-time increased from 32.3 ± 2.8 to 51.9 ± 3.6 s (Fig. 7D and inset) and decay time constant increased from 171 ± 27 to 241 ± 51 s (Fig. 7E and inset).
Figure 7. A component of adenosine release is via equilibrative nucleoside transporters (ENTs).
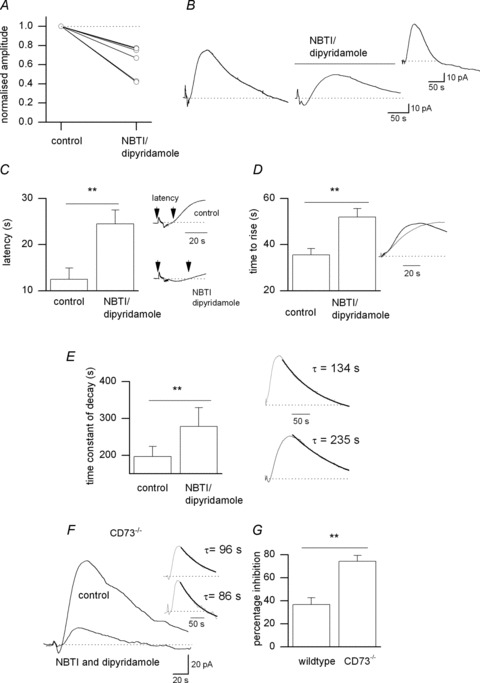
A, graph summarising the effects of NBTI (5 μm) and dipyridamole (10 μm) on the amplitude of the adenosine waveform (n= 7 slices). B, adenosine biosensor traces in control and in the presence of 5 μm NBTI and 10 μm dipyridamole. Inset, the NBTI/dipyridamole-sensitive current obtained by subtracting the trace in NBTI/dipyridamole from the control trace. C, graph summarising the effects of NBTI and dipyridamole on the latency of the adenosine waveform. The latency was measured as the time between the start of the stimulation and when the adenosine waveform started to rise above baseline. Inset, traces from B expanded to show the change in latency following application of NBTI and dipyridamole. D, graph summarising the effects of NBTI and dipyridamole on the rise time of the adenosine waveform. The rise time was measured as the time taken for the waveform to rise from the baseline to the peak. Inset, traces from B expanded and normalised to show slowing of rise following application of NBTI and dipyridamole (grey line). E, graph summarising the effects of NBTI and dipyridamole on the time constant of decay of the adenosine waveform. The decay was fitted with a single exponential. Inset, traces from B with the decay fitted with a single exponential. F, superimposed adenosine biosensor traces in control and in the presence of 5 μm NBTI and 10 μm dipyridamole in a recording from a CD73−/− mouse hippocampal slice. Inset, the traces from F normalised to illustrate that NBTI and dipyridamole had little effect on the kinetics of the waveform. G, graph summarising the effects of NBTI and dipyridamole on the stimulated increases in adenosine concentration detected in slices from wild-type and in CD73−/− mice. Graphs A, C, D and E all summarise data from seven slices. For G, n= 4 slices for wild-type mice and n= 6 slices for CD73−/− mice.
Our data suggest that there are two components of adenosine release: (1) direct release of adenosine via ENTs, which is blocked by NBTI and dipyridamole, and (2) via the extracellular metabolism of ATP, which is insensitive to NBTI and dipyridamole but reduced by NTPDase inhibitors and absent in CD73−/− mice. In slices from CD73−/− mice, because the second component of adenosine release is absent, we hypothesise that all of the adenosine release remaining will be via ENTs. Thus, NBTI and dipyridamole should block more of the adenosine release in CD73−/− mice than in wild-type mice. This was indeed the case with significantly (P= 0.002) more inhibition (74 ± 5%, n= 6, Fig. 7F and G) in CD73−/− mice than in wild-type mice (37 ± 6%, n= 4), with little effect on the release kinetics compared with wild-type slices (Fig. 7F inset). This data further support the presence of two distinct forms of adenosine release: direct, via ENTs, and indirect, via extracellular ATP metabolism.
The role of glial cells
A component of adenosine release could arise from the activation of ionotropic glutamate receptors expressed by glial cells to release ATP or adenosine (for example see Queiroz et al. 1997). To investigate this we applied the gliotoxin FAC to inactivate glial cells (Clarke et al. 1970; Waniewski & Martin, 1998; Martin et al. 2007). In agreement with previous studies (Canals et al. 2008) we found that FAC (5 mm) directly increased the extracellular concentration of adenosine, resulting in an upward shift in the ADO biosensor baseline, with no effect on a null sensor (n= 7, Fig. 8A). This effect was rapid, occurring within a few minutes of FAC application, with a peak extracellular concentration of 1.1 ± 0.5 μm adenosine (n= 7). Because of this increase in the basal extracellular concentration of adenosine, all experiments were carried out in 1–2 μm 8-CPT, to prevent the extracellular adenosine activating A1 receptors and inhibiting stimulated adenosine release. In these conditions, FAC did not reduce stimulated-adenosine release but actually increased it (mean increase 43 ± 20%, n= 7, Fig. 8A–C), even with applications which were over 1 h in duration (Fig. 8B). In some slices (3 out of 7) there was a transient reduction in stimulated adenosine release during the initial FAC-mediated increase in extracellular adenosine concentration, with recovery and subsequent increase in stimulated adenosine release. This may reflect a transient reduction, or even a reversal, of the adenosine concentration gradient, from outwards to inwards, preventing efflux of adenosine via ENTs. As in control conditions, adenosine release was abolished by CNQX and d-AP5 in the presence of FAC (n= 3).
Figure 8. Effects of the gliotoxin flouroacetate (FAC) on adenosine release.
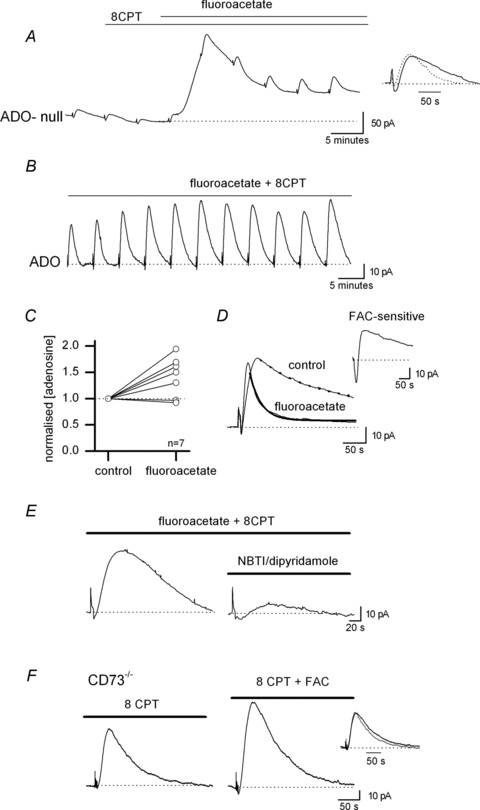
A, example biosensor trace showing the effects of FAC (5 mm). Application of FAC caused an increase in the extracellular concentration of adenosine and enhanced the stimulated increase in adenosine concentration. Inset, normalised and superimposed adenosine waveforms (from A) in control and in FAC (dotted line) to illustrate the speeding of rise and decay kinetics in FAC. B, example biosensor trace illustrating how prolonged application of FAC (5 mm) had little effect on the stimulated increases in adenosine concentration detected by the biosensor. In this example, FAC had been applied for ∼70 min. C, graph illustrating the effects of FAC on the concentration of adenosine detected following stimulation (n= 7 slices). The adenosine concentration is normalised to control values. D, superimposed biosensor traces in control and in FAC to illustrate an example recording where there was very marked changes in waveform kinetics. The decay of the waveforms has been fitted with a single exponential (control τ = 128 s, FAC τ = 28 s). Inset, the waveform in FAC subtracted from the waveform in control to illustrate the FAC-sensitive component of adenosine release. E, example biosensor traces in FAC (5 mm). Addition of 5 μm NBTI and 10 μm dipyridamole (to block ENTs) markedly (∼80%) reduced the concentration of adenosine detected. F, example biosensor traces of adenosine release in control and in FAC (5 mm) taken from a CD73−/− slice. Although FAC increased the concentration of adenosine detected there was little change in the time course of the adenosine biosensor waveform (as illustrated in the inset, grey line is control).
The FAC-mediated increase in adenosine detected by biosensors following stimulation probably arises from the loss of adenosine uptake by metabolically compromised glial cells. This increase could occlude any reduction in adenosine release produced by the loss of other mechanisms of release, including the loss of ATP exocytosis from glia. Thus, we investigated if there was any change in the kinetics of the waveform of the adenosine biosensor current in FAC. In 5 out of 7 slices (no effect in 2 slices) there was a clear speeding of kinetics in FAC (both rise and decay, Fig. 7D). A speeding of rise could be accounted for by loss of glial adenosine removal but this would be expected to slow decay rather than speed it up. Subtraction of the normalised currents in FAC from control revealed an FAC-sensitive component that had slow rise and decay kinetics. The simplest explanation is that this component results from the release of adenosine from glial cells. Application of NBTI and dipyridamole to block ENTs markedly reduced the release of adenosine in FAC (78 ± 7%, n= 3). The effects of FAC, direct release of adenosine and increase in stimulated adenosine release, were still observed in CD73−/− mice (n= 5) confirming that they do not arise from the release of ATP and its subsequent extracellular metabolism. However, there was no speeding of the adenosine waveform decay as observed in wild-type mice as presumably FAC does not remove a slow component of adenosine release in slices from CD73−/− mice, as adenosine cannot arise from ATP exocytosis.
To further investigate the role of glial cells, we made use of dn-SNARE mice, in which glial cells are unable to release transmitters by exocytosis (Pascual et al. 2005). As expected, from our previous results, stimulated adenosine release could still be measured in hippocampal slices from these mice (n= 21 slices, eight mice, Fig. 9A), confirming that a substantial component of adenosine release is independent of ATP exocytosis from glial cells. As with wild-type mice and with CD73−/− mice, adenosine release was blocked with glutamate receptor antagonists (n= 3) and could be evoked by puffing glutamate onto the slice surface (release persisted in TTX but was greatly reduced by removal of extracellular Ca2+, n= 4). However, the amount of adenosine released by electrical stimulation was significantly (P= 0.002) smaller in slices from dn-SNARE mice than in slices from wild-type mice (111 ± 20 vs. 314 ± 45 nm, n= 21, Fig 9B) and the decay of the adenosine waveform was significantly (0.001) faster in dn-SNARE mice (τ= 57 ± 11 s vs. 185 ± 10 s, n= 10), suggesting that a slower component of release is absent (Fig. 9A and C). In slices from dn-SNARE mice, adenosine release was greatly reduced (78 ± 5%) by blocking ENTs with NBTI and dipyridamole (n= 8, Fig. 9D), confirming that the majority of the adenosine release in these slices is via ENTs. Data from dn-SNARE mice confirm the presence of a component of adenosine release that arises from exocytosis of ATP from glial cells.
Figure 9. Adenosine release is present but reduced in dn-SNARE mice.
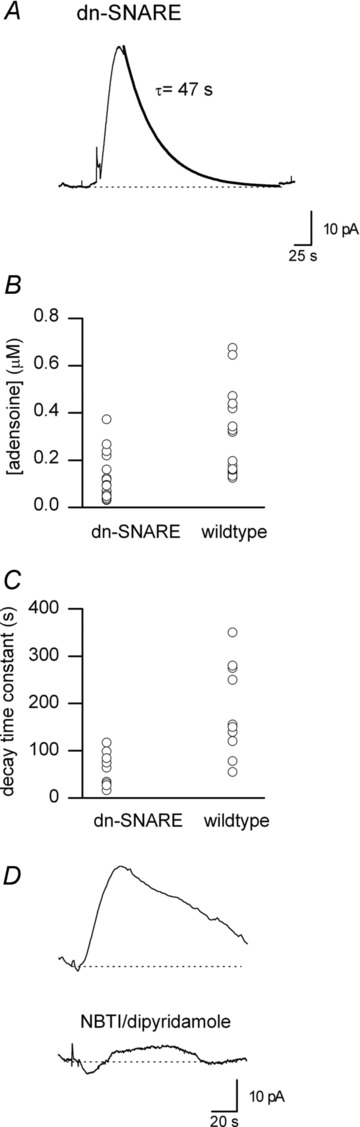
A, example biosensor trace showing a stimulated increase in adenosine concentration recorded in a slice from a dn-SNARE mouse. The decay of the waveform has been fitted with a single exponential (τ= 47 s). B, graph summarising the increase in adenosine concentration produced by stimulation in slices from dn-SNARE mice versus wild-type (n= 21 slices). C, graph summarising the decay of adenosine waveforms in slices from dn-SNARE mice versus wild-type (n= 10 slices). D, example biosensor traces of stimulated increases in adenosine concentration in control and in the presence of the ENT inhibitors NBTI and dipyridamole recorded in a slice from a dn-SNARE mouse.
Discussion
We have used adenosine microelectrode biosensors to determine and quantify the mechanisms of adenosine release in area CA1 of hippocampal slices, in response to focal, short duration electrical stimulation. Adenosine release could reliably be detected with stimulation frequencies as low as 1 Hz and in some slices adenosine release could even be detected following a single stimulus. This is in agreement with Mitchell et al. (1993) who reported that a single conditioning pulse could release enough adenosine to weakly (∼5%) inhibit synaptic transmission. Although it is possible to detect adenosine release in response to a single stimulus, the slow rise-time of the adenosine biosensor waveform (∼30 s compared to 10 s for calibration) suggests that either the release process itself is slow or more likely that the biosensor is not immediately adjacent to the release sites and that the speed of rise is limited by diffusion. Differences in the distance between release sites and the inserted biosensor could explain the variation in the minimal stimulus required to produce detectable adenosine release. As in the cerebellum (Wall & Dale, 2007), the adenosine release detected by biosensors in the hippocampus is both action potential and Ca2+ dependent. However, unlike in the cerebellum, the adenosine detected in the hippocampus is entirely dependent on the activation of ionotropic glutamate receptors. Thus, stimulation releases glutamate, presumably from Schafer collaterals, to activate glutamate receptors on neurons and/or glial cells to produce the downstream release of adenosine. Previous studies have shown that adenosine release, evoked by HFS and detected by fEPSP inhibition, can be blocked with NMDA receptor antagonists (Manzoni et al. 1994; Serrano et al. 2006) and adenosine can be released by application of NMDA (Brambilla et al. 2005) or AMPA receptor agonists (Hoehn & White, 1990; Craig & White, 1993). We found that activating either NMDA or non-NMDA receptors leads to adenosine release with considerable variation (across slices) in the relative contribution of the receptor type to the amount of adenosine released
Mechanisms of adenosine release
Using transgenic mice and pharmacological manipulation we provide strong evidence for two distinct mechanisms of adenosine release: fast, direct release via neuronal ENTs and slower, indirect release via the metabolism of extracellular ATP released from glial cells by exocytosis (Fig. 10).
Figure 10. Scheme of adenosine release in the hippocampus.
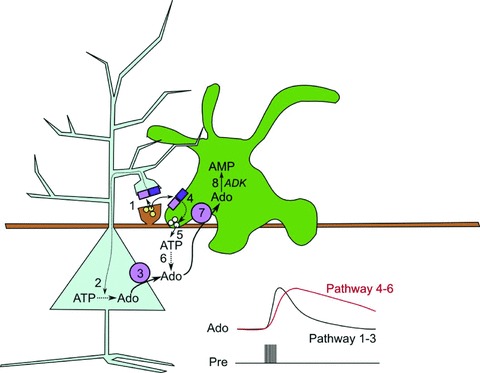
Glutamate release from the Schaffer collaterals releases glutamate, which can activate NMDA and AMPA receptors on the postsynaptic spine (1) of a pyramidal neuron and also NMDA and AMPA receptors on nearby astrocytic processes (4). By some means, yet to be elucidated, this activation of glutamate receptors increases the metabolic load on the neuron and leads to an increase in intracellular adenosine (2), which is then rapidly transported out of the cell by the ENTs (3). In parallel with this, the activation of glutamate receptors on the astrocyte (4) leads to an increase in intracellular Ca2+ and increased exocytosis of ATP-containing vesicles (5). Once in the extracellular space, ATP is broken down to adenosine (6). Extracellular adenosine can be taken up into astrocytes via ENTs (7) as the astrocytes maintain very low intracellular adenosine levels as a consequence of the activity of adenosine kinase (ADK), which converts adenosine to AMP (8). The two parallel pathways have differing kinetics: the neuronal pathway of direct release (1–3) has rapid kinetics, while those of the indirect astrocytic pathway (4–6) are slower.
Inhibition of ENTs led to a ∼40% reduction in the amount of adenosine detected following stimulation together with a marked slowing in adenosine waveform kinetics (both rise and decay). This agrees with a number of previous studies which showed adenosine release can be reduced by inhibiting ENTs (Jonzon & Fredholm, 1985; White & MacDonald, 1990; Gu et al. 1995; Cunha et al. 1996; Lovatt et al. 2012). However, these previous studies used methodology that was unable to measure changes in adenosine kinetics. Our finding contrasts with other studies that showed blocking ENTs increases glutamate and ischaemia evoked adenosine release (Craig & White, 1993; Frenguelli et al. 2007). Presumably, in these cases, the removal of adenosine from the extracellular space is reduced but the release mechanism is unaffected. This direct ENT-mediated form of adenosine release persisted in slices in which glial cells were inactivated with the gliotoxin FAC. Thus, the most likely source of the adenosine is neuronal. This is consistent with in situ hybridisation studies identifying strong expression of ENT1 and ENT2 mRNA in hippocampal pyramidal cells (Anderson et al. 1999a,b) and is consistent with previous studies (Brundege & Dunwiddie, 1996; Lovatt et al. 2012) where adenosine is directly released from CA1 pyramidal cells via ENTs. At the age used in our study, neurons do not express adenosine kinase (Studer et al. 2006) and thus potentially any increases in neuronal intracellular adenosine concentration could, in theory, directly increase adenosine efflux. In contrast, glial cells strongly express adenosine kinase (Studer et al. 2006), which will maintain an inward concentration gradient, preventing adenosine efflux. A previous study, in which adenosine release was measured in response to epileptic activity, found that inhibiting adenosine kinase had no effect on the amount of adenosine released, suggesting a neuronal source of the adenosine (Etherington et al. 2009). Our data suggest that there is no requirement for postsynaptic action potential firing to release adenosine via ENTs, as local application of glutamate evoked adenosine release in the presence of TTX. Thus, the metabolic load produced by the activation of glutamate receptors is sufficient to increase the intracellular concentration of adenosine in neurons leading to efflux. Of course the firing of action potentials will also increase the metabolic load and thus will presumably enhance the adenosine release. Our data also suggest that this ENT-mediated release is partially Ca2+ dependent, which has also been observed for the release of purines via ENTs in other studies (Zamzow et al. 2009; Wall et al. 2010). The exact mechanism for the Ca2+ dependence of release is currently unclear but could be the gating of ENTs or the Ca2+ dependence of specific intracellular purine-metabolising enzymes.
The incomplete block of adenosine release by ENT inhibition suggests that adenosine could also be released by other mechanisms, which are independent of ENTs. The slowing of adenosine waveform kinetics, when ENTs are blocked, could result from a reduction in adenosine removal but also suggests that there could be a mechanism of release remaining that is slower than ENT-mediated release. We have several lines of evidence to support the latter and that this remaining adenosine release arises from ATP exocytosis from glial cells. Firstly, the NTPDase inhibitor POM-1 (Wall et al. 2008) reduced adenosine release, with partial reversal, and also increased the speed of adenosine waveform kinetics, consistent with the loss of a slow component of adenosine release. Secondly, the amount of adenosine released in slices from both CD73−/− (which cannot metabolise ATP to adenosine) and dn-SNARE mice (loss of exocytosis of ATP from glial cells) was significantly smaller (∼50%) than that detected in slices from wild-type mice and the time course was faster in these mice, suggesting loss of a slow component of release. Thirdly, a significantly greater proportion of adenosine release was blocked by inhibiting ENTs in both CD73−/− and dn-SNARE mice, consistent with the loss of a component of release that is insensitive to ENT inhibition. Finally, inactivating glial cells, with FAC, speeded the kinetics of the adenosine waveform and resulted in a greater sensitivity of adenosine release to ENT inhibition. It has previously been shown that glial cells can release ATP in response to activation of either NMDA or non-NMDA receptors (Queiroz et al. 1997; Loiola & Ventura, 2011). This is also consistent with Pascual et al. (2005) and Serrano et al. (2006) who showed that ATP release from glial cells is a major source for the adenosine released by HFS to inhibit synaptic transmission. Interestingly, Lalo et al. (2006) showed that the NMDA receptors expressed by cortical glial cells are devoid of Mg2+ block, unlike neuronal NMDA receptors which are potently blocked by Mg2+ at the resting potential. Hoehn & White (1990) showed that the amount of adenosine released by applying NMDA to cortical slices was not enhanced by removing Mg2+, consistent with a lack of Mg2+ block, suggesting that glial NMDA receptors are activated. Thus, perhaps the major mechanism of ATP release from glial cells involves the activation of NMDA receptors.
Our data provides strong evidence for a component of adenosine release arising from the extracellular metabolism of ATP, released by exocytosis from glial cells. This component of adenosine release appears to have slower kinetics than the direct release of adenosine from neurons. It is unlikely that the speed of adenosine release is limited by the speed of extracellular metabolism, as no ATP could be measured by an ATP biosensor, suggesting rapid ATP metabolism (and see Dunwiddie et al. 1997). Similar results have also been observed in the cerebellum (Wall & Dale, 2007; Klyuch et al. 2012a). It is possible that the slower kinetics of ATP release stem from the speed of intracellular signalling within the glial cells or that glutamate activation of neurons releases a transmitter leading to downstream activation of glial cells and subsequent ATP release.
What about neuronal release of ATP? Although we have been unable to provide evidence for the release of ATP from neurons, we cannot exclude it. There is evidence for the tight coupling of ATP metabolism to the activation of A1 receptors by somehow channelling the produced adenosine to the receptors (Cunha et al. 1998). This would, in theory, allow the release of minute amounts of ATP, from nerve terminals, to be locally metabolised to adenosine and then activate closely apposed adenosine receptors (Cunha et al. 1998). Such adenosine would not appreciably raise the extracellular concentration of adenosine and thus may not be detected by biosensors.
Actions of fluoroacetate
FAC is a gliotoxin which selectively impairs oxidative metabolism in glial cells. Previous studies have shown that even at high concentrations (up to 20 mm), FAC only starts to have effects on pyramidal cells after ∼1 h of incubation (Canals et al. 2008). This specificity for glial cells arises from selective expression of an acetate transporter by glial cells and not by neurons (Clarke et al. 1970). In agreement with previous studies (Canals et al. 2008) we found that application of FAC caused a marked increase in extracellular adenosine concentration, exceeding 1 μm, which is sufficient to almost completely inhibit synaptic transmission by activating A1 receptors (Canals et al. 2008). It has been reported that such increases in adenosine occur in the absence of neurons, in glial cultures, and thus results directly from the block of the tricarboxylic acid (TCA) cycle within glial cells (Canals et al. 2008). This increase in extracellular adenosine probably results from the inability of adenosine kinase to maintain a low intracellular concentration of adenosine in metabolically compromised glial cells, resulting in adenosine efflux via ENTs. Previous experiments have shown that loss of adenosine kinase activity, following block with iodotubercidin, leads to rapid and large increases in adenosine concentration (Wall et al. 2007; Etherington et al. 2009). Although FAC increased the basal concentration of adenosine, it did not block the electrically stimulated release of adenosine, even with incubations over 1 h in duration. In many slices, FAC markedly increased the amount of adenosine detected following stimulation. The mechanism for such an increase is unclear, but could result from a loss of adenosine removal by glial cells, leading to a greater concentration of adenosine diffusing to the biosensor. Such an increase could also account for the speeding of the rise in adenosine biosensor waveform but would not explain the speeding of adenosine waveform decay, which would be expected to be slowed as removal is reduced. The loss of a slow component of adenosine release is the simplest explanation for the speeding of decay and fits with our other observations.
Summary
The field of adenosine release has been characterized by considerable multiplicity of mechanisms and lack of clarity, and even conflict, as to which mechanisms may be physiologically important. For a long time direct adenosine release was seen as occurring only under pathological conditions. There is now no doubt that it also occurs as a result of physiological signalling activity in the brain. Our results bring clarity to the field by demonstrating that both direct and indirect release of adenosine occurs in response to neural activity (summarized in Fig. 10). These two pathways make roughly equal contributions to the total amount of adenosine released. Our studies have allowed us to assign the direct release pathway to neurons, and the indirect pathway to astrocytes. Furthermore, the direct transport-mediated pathway of adenosine release has significantly faster kinetics than the indirect pathway. Future work needs to address the precise roles of these mechanisms of adenosine release in hippocampal function, but as adenosine can modulate the capacity for long-term potentiation, these functions are likely to be highly significant.
Acknowledgments
We thank Dr P. G. Haydon and Prof. J. Schrader for supplying the transgenic mice used in this study. We thank Prof. B. G. Frenguelli for comments on the manuscript.
Glossary
- 8-CPT
8-cyclopentyltheophylline
- aCSF
artificial cerebrospinal fluid
- CNQX
6-cyano-7-nitroquinoxaline-2,3-dione
- d-AP5
d-(–)-2-amino-5-phosphonopentanoic acid
- EHNA
erythro-9-(2-hydroxy-3-nonyl) adenine
- ENTs
equilibrative nucleoside transporters
- FAC
fluoroacetate
- fEPSPs
field excitatory postsynaptic potentials
- HFS
high frequency stimulation
- NBTI
S-(4-nitrobenzyl)-6-thioinosine
- NMDA
N-methyl-d-aspartate
- POM-1
sodium polyoxotungstate
- TTX
tetrodotoxin
Additional information
Competing interests
The authors declare no competing financial interests.
Author contributions
M.J.W. carried out all the experiments. M.J.W. analysed the data. M.J.W. and N.D. designed the experiments. M.J.W. and N.D. wrote the paper.
References
- Anderson CM, Xiong W, Geiger JD, Young JD, Cass CE, Baldwin SA, Parkinson FE. Distribution of equilibrative, nitrobenzylthioinosine-sensitive nucleoside transporters (ENT1) in brain. J Neurochem. 1999a;73:867–873. doi: 10.1046/j.1471-4159.1999.0730867.x. [DOI] [PubMed] [Google Scholar]
- Anderson CM, Baldwin SA, Young JD, Cass CE, Parkinson FE. Distribution of mRNA encoding a nitrobenzylthioinosine-insensitive nucleoside transporter (ENT2) in rat brain. Brain Res Mol Brain Res. 1999b;70:293–297. doi: 10.1016/s0169-328x(99)00164-3. [DOI] [PubMed] [Google Scholar]
- Arai A, Kessler M, Lynch G. The effects of adenosine on the development of long-term potentiation. Neurosci Lett. 1990;119:41–44. doi: 10.1016/0304-3940(90)90750-4. [DOI] [PubMed] [Google Scholar]
- Boison D. Adenosine dysfunction in epilepsy. Glia. 2012;60:1234–1243. doi: 10.1002/glia.22285. [DOI] [PMC free article] [PubMed] [Google Scholar]
- Boison D. Adenosine-based modulation of brain activity. Curr Neuropharmacol. 2009;7:158–159. doi: 10.2174/157015909789152173. [DOI] [PMC free article] [PubMed] [Google Scholar]
- Brambilla D, Chapman D, Greene R. Adenosine mediation of presynaptic feedback inhibition of glutamate release. Neuron. 2005;46:275–283. doi: 10.1016/j.neuron.2005.03.016. [DOI] [PubMed] [Google Scholar]
- Brundege JM, Dunwiddie TV. Modulation of excitatory synaptic transmission by adenosine released from single hippocampal pyramidal neurons. J Neurosci. 1996;16:5603–5612. doi: 10.1523/JNEUROSCI.16-18-05603.1996. [DOI] [PMC free article] [PubMed] [Google Scholar]
- Canals S, Larrosa B, Pintor J, Mena MA, Herreras O. Metabolic challenge to glia activates an adenosine-mediated safety mechanism that promotes survival by delaying the onset of spreading depression waves. J Cereb Blood Flow Metab. 2008;28:1835–1844. doi: 10.1038/jcbfm.2008.71. [DOI] [PubMed] [Google Scholar]
- Cechova S, Venton BJ. Transient adenosine efflux in the rat caudate-putamen. J Neurochem. 2008;105:1253–1263. doi: 10.1111/j.1471-4159.2008.05223.x. [DOI] [PubMed] [Google Scholar]
- Clarke DD, Nicklas WJ, Berl S. Tricarboxylic acid-cycle metabolism in brain. Effect of fluoroacetate and fluorocitrate on the labelling of glutamate, aspartate, glutamine and γ-aminobutyrate. Biochem J. 1970;120:345–351. doi: 10.1042/bj1200345. [DOI] [PMC free article] [PubMed] [Google Scholar]
- Costenla AR, de Mendonça A, Ribeiro JA. Adenosine modulates synaptic plasticity in hippocampal slices from aged rats. Brain Res. 1999;851:228–234. doi: 10.1016/s0006-8993(99)02194-0. [DOI] [PubMed] [Google Scholar]
- Craig CG, White TD. N-Methyl-D-aspartate- and non-N-methyl-D-aspartate-evoked adenosine release from rat cortical slices: distinct purinergic sources and mechanisms of release. J Neurochem. 1993;60:1073–1080. doi: 10.1111/j.1471-4159.1993.tb03256.x. [DOI] [PubMed] [Google Scholar]
- Cunha RA, Vizi ES, Ribeiro JA, Sebastião AM. Preferential release of ATP and its extracellular catabolism as a source of adenosine upon high- but not low-frequency stimulation of rat hippocampal slices. J Neurochem. 1996;67:2180–2187. doi: 10.1046/j.1471-4159.1996.67052180.x. [DOI] [PubMed] [Google Scholar]
- Cunha RA, Sebastião AM, Ribeiro JA. Inhibition by ATP of hippocampal synaptic transmission requires localized extracellular catabolism by ecto-nucleotidases into adenosine and channeling to adenosine A1 receptors. J Neurosci. 1998;18:1987–1995. doi: 10.1523/JNEUROSCI.18-06-01987.1998. [DOI] [PMC free article] [PubMed] [Google Scholar]
- Dale N, Pearson T, Frenguelli BG. Direct measurement of adenosine release during hypoxia in the CA1 region of the rat hippocampal slice. J Physiol. 2000;526:143–155. doi: 10.1111/j.1469-7793.2000.00143.x. [DOI] [PMC free article] [PubMed] [Google Scholar]
- Dale N, Frenguelli BG. Release of adenosine and ATP during ischemia and epilepsy. Curr Neuropharmacology. 2009;7:160–179. doi: 10.2174/157015909789152146. [DOI] [PMC free article] [PubMed] [Google Scholar]
- de Mendonça A, Ribeiro JA. Endogenous adenosine modulates long-term potentiation in the hippocampus. Neuroscience. 1994;62:385–390. doi: 10.1016/0306-4522(94)90373-5. [DOI] [PubMed] [Google Scholar]
- Diógenes MJ, Neves-Tomé R, Fucile S, Martinello K, Scianni M, Theofilas P, Lopatár J, Ribeiro JA, Maggi L, Frenguelli BG, Limatola C, Boison D, Sebastião AM. Homeostatic control of synaptic activity by endogenous adenosine is mediated by adenosine kinase. Cereb Cortex. 2012 doi: 10.1093/cercor/bhs284. [DOI] [PMC free article] [PubMed] [Google Scholar]
- Dunwiddie TV, Diao L. Extracellular adenosine concentrations in hippocampal brain slices and the tonic inhibitory modulation of evoked excitatory responses. J Pharmacol Exp Ther. 1994;268:537–545. [PubMed] [Google Scholar]
- Dunwiddie TV, Diao L, Proctor WR. Adenine nucleotides undergo rapid, quantitative conversion to adenosine in the extracellular space in rat hippocampus. J Neurosci. 1997;20:7673–7682. doi: 10.1523/JNEUROSCI.17-20-07673.1997. [DOI] [PMC free article] [PubMed] [Google Scholar]
- Dunwiddie TV, Hoffer BJ. Adenine nucleotides and synaptic transmission in the in vitro rat hippocampus. Br J Pharmacol. 1980;69:59–68. doi: 10.1111/j.1476-5381.1980.tb10883.x. [DOI] [PMC free article] [PubMed] [Google Scholar]
- Etherington LA, Patterson GE, Meechan L, Boison D, Irving AJ, Dale N, Frenguelli BG. Astrocytic adenosine kinase regulates basal synaptic adenosine levels and seizure activity but not activity-dependent adenosine release in the hippocampus. Neuropharmacology. 2009;56:429–437. doi: 10.1016/j.neuropharm.2008.09.016. [DOI] [PMC free article] [PubMed] [Google Scholar]
- Frenguelli BG, Wigmore G, Llaudet E, Dale N. Temporal and mechanistic dissociation of ATP and adenosine release during ischemia in the mammalian hippocampus. J Neurochem. 2007;101:1400–1413. doi: 10.1111/j.1471-4159.2006.04425.x. [DOI] [PMC free article] [PubMed] [Google Scholar]
- Gu JG, Foga IO, Parkinson FE, Geiger JD. Involvement of bidirectional adenosine transporters in the release of L-[3H]adenosine from rat brain synaptosomal preparations. J Neurochem. 1995;64:2105–2110. doi: 10.1046/j.1471-4159.1995.64052105.x. [DOI] [PubMed] [Google Scholar]
- Hoehn K, White TD. N-Methyl-D-aspartate, kainate and quisqualate release endogenous adenosine from rat cortical slices. Neuroscience. 1990;39:441–450. doi: 10.1016/0306-4522(90)90280-h. [DOI] [PubMed] [Google Scholar]
- Huckstepp RT, id Bihi R, Eason R, Spyer KM, Dicke N, Willecke K, Marina N, Gourine AV, Dale N. Connexin hemichannel-mediated CO2-dependent release of ATP in the medulla oblongata contributes to central respiratory chemosensitivity. J Physiol. 2010;588:3901–3920. doi: 10.1113/jphysiol.2010.192088. [DOI] [PMC free article] [PubMed] [Google Scholar]
- Jo YH, Sclichter R. Synaptic corelease of ATP and GABA in cultured spinal neurons. Nat Neurosci. 1999;2:241–245. doi: 10.1038/6344. [DOI] [PubMed] [Google Scholar]
- Jonzon B, Fredholm BB. Release of purines, noradrenaline, and GABA from rat hippocampal slices by field stimulation. J Neurochem. 1985;44:217–224. doi: 10.1111/j.1471-4159.1985.tb07133.x. [DOI] [PubMed] [Google Scholar]
- Kimura M, Saitoh N, Takahashi T. Adenosine A1 receptor-mediated presynaptic inhibition at the calyx of Held of immature rats. J Physiol. 2003;553:415–426. doi: 10.1113/jphysiol.2003.048371. [DOI] [PMC free article] [PubMed] [Google Scholar]
- Klyuch BP, Dale N, Wall MJ. Deletion of ecto-5′-nucleotidase (CD73) reveals direct action potential-dependent adenosine release. J Neurosci. 2012a;32:3842–3847. doi: 10.1523/JNEUROSCI.6052-11.2012. [DOI] [PMC free article] [PubMed] [Google Scholar]
- Klyuch BP, Dale N, Wall MJ. Receptor-mediated modulation of activity-dependent adenosine release in rat cerebellum. Neuropharmacology. 2012b;62:815–824. doi: 10.1016/j.neuropharm.2011.09.007. [DOI] [PubMed] [Google Scholar]
- Koszalka P, Ozüyaman B, Huo Y, Zernecke A, Flögel U, Braun A, Buchheiser A, Decking UK, Smith ML, Sévigny J, Gear A, Weber AA, Molojavyi A, Ding Z, Weber C, Ley K, Zimmermann H, Gödecke A, Schrader J. Targeted disruption of cd73/ecto-5′-nucleotidase alters thromboregulation and augments vascular inflammatory response. Circ Res. 2004;95:814–821. doi: 10.1161/01.RES.0000144796.82787.6f. [DOI] [PubMed] [Google Scholar]
- Langer D, Hammer K, Koszalka P, Schrader J, Robson S, Zimmermann H. Distribution of ectonucleotidases in the rodent brain revisited. Cell Tissue Res. 2008;334:199–217. doi: 10.1007/s00441-008-0681-x. [DOI] [PubMed] [Google Scholar]
- Lalo U, Pankratov Y, Kirchhoff F, North RA, Verkhratsky A. NMDA receptors mediate neuron-to-glia signalling in mouse cortical astrocytes. J Neurosci. 2006;26:2673–2683. doi: 10.1523/JNEUROSCI.4689-05.2006. [DOI] [PMC free article] [PubMed] [Google Scholar]
- Latini S, Pedata F. Adenosine in the central nervous system: release mechanism and extracellular concentrations. J Neurochem. 2001;79:463–484. doi: 10.1046/j.1471-4159.2001.00607.x. [DOI] [PubMed] [Google Scholar]
- Llaudet E, Botting N, Crayston J, Dale N. A three enzyme microelectrode sensor for detecting purine release from central nervous system. Biosens Bioelectron. 2003;18:43–52. doi: 10.1016/s0956-5663(02)00106-9. [DOI] [PubMed] [Google Scholar]
- Llaudet E, Hatz S, Droniou M, Dale N. Microelectrode biosensor for real-time measurement of ATP in biological tissue. Anal Chem. 2005;77:3267–3273. doi: 10.1021/ac048106q. [DOI] [PubMed] [Google Scholar]
- Loiola EC, Ventura AL. Release of ATP from avian Müller glia cells in culture. Neurochem Int. 2011;58:414–422. doi: 10.1016/j.neuint.2010.12.019. [DOI] [PubMed] [Google Scholar]
- Lopatář J, Dale N, Frenguelli BG. Minor contribution of ATP P2 receptors to electrically-evoked electrographic seizure activity in hippocampal slices: evidence from purine biosensors and P2 receptor agonists and antagonists. Neuropharmacology. 2011;61:25–34. doi: 10.1016/j.neuropharm.2011.02.011. [DOI] [PubMed] [Google Scholar]
- Lopes LV, Sebastião AM, Ribeiro JA. Adenosine and related drugs in brain diseases: present and future in clinical trials. Curr Top Med Chem. 2011;11:1087–1101. doi: 10.2174/156802611795347591. [DOI] [PubMed] [Google Scholar]
- Lovatt D, Xu Q, Liu W, Takano T, Smith NA, Schnermann J, Tieu K, Nedergaard M. Neuronal adenosine release, and not astrocytic ATP release, mediates feedback inhibition of excitatory activity. Proc Natl Acad Sci U S A. 2012;109:6265–6270. doi: 10.1073/pnas.1120997109. [DOI] [PMC free article] [PubMed] [Google Scholar]
- Manzoni OJ, Manabe T, Nicoll RA. Release of adenosine by activation of NMDA receptors in the hippocampus. Science. 1994;265:2098–2101. doi: 10.1126/science.7916485. [DOI] [PubMed] [Google Scholar]
- Martín ED, Fernández M, Perea G, Pascual O, Haydon PG, Araque A, Ceña V. Adenosine released by astrocytes contributes to hypoxia-induced modulation of synaptic transmission. Glia. 2007;55:36–45. doi: 10.1002/glia.20431. [DOI] [PubMed] [Google Scholar]
- Mitchell JB, Lupica CR, Dunwiddie TV. Activity-dependent release of endogenous adenosine modulates synaptic responses in rat hippocampus. J Neurosci. 1993;13:3439–3447. doi: 10.1523/JNEUROSCI.13-08-03439.1993. [DOI] [PMC free article] [PubMed] [Google Scholar]
- Pankratov Y, Lalo U, Verkhratsky A, North RA. Quantal release of ATP in mouse cortex. J Gen Physiol. 2007;129:257–265. doi: 10.1085/jgp.200609693. [DOI] [PMC free article] [PubMed] [Google Scholar]
- Pascual O, Casper KB, Kubera C, Zhang J, Revilla-Sanchez R, Sul JY, Takano H, Moss SJ, McCarthy K, Haydon PG. Astrocytic purinergic signalling coordinates synaptic networks. Science. 2005;310:113–116. doi: 10.1126/science.1116916. [DOI] [PubMed] [Google Scholar]
- Pearson RA, Dale N, Llaudet E, Mobbs P. ATP released via gap junction hemichannels from the pigment epithelium regulates neural retinal progenitor proliferation. Neuron. 2005;46:731–744. doi: 10.1016/j.neuron.2005.04.024. [DOI] [PubMed] [Google Scholar]
- Pugliese AM, Traini C, Cipriani S, Gianfriddo M, Mello T, Giovannini MG, Galli A, Pedata F. The adenosine A2A receptor antagonist ZM241385 enhances neuronal survival after oxygen-glucose deprivation in rat CA1 hippocampal slices. Br J Pharmacol. 2009;157:818–830. doi: 10.1111/j.1476-5381.2009.00218.x. [DOI] [PMC free article] [PubMed] [Google Scholar]
- Queiroz G, Gebicke-Haerter PJ, Schobert A, Starke K, von Kügelgen I. Release of ATP from cultured rat astrocytes elicited by glutamate receptor activation. Neuroscience. 1997;78:1203–1208. doi: 10.1016/s0306-4522(96)00637-9. [DOI] [PubMed] [Google Scholar]
- Rex CS, Kramár EA, Colgin LL, Lin B, Gall CM, Lynch G. Long-term potentiation is impaired in middle-aged rats: regional specificity and reversal by adenosine receptor antagonists. J Neurosci. 2005;25:5956–5966. doi: 10.1523/JNEUROSCI.0880-05.2005. [DOI] [PMC free article] [PubMed] [Google Scholar]
- Serrano A, Haddjeri N, Lacaille JC, Robitaille R. GABAergic network activation of glial cells underlies hippocampal heterosynaptic depression. J Neurosci. 2006;26:5370–5382. doi: 10.1523/JNEUROSCI.5255-05.2006. [DOI] [PMC free article] [PubMed] [Google Scholar]
- Studer FE, Fedele DE, Marowsky A, Schwerdel C, Wernli K, Vogt K, Fritschy JM, Boison D. Shift of adenosine kinase expression from neurons to astrocytes during postnatal development suggests dual functionality of the enzyme. Neuroscience. 2006;142:125–137. doi: 10.1016/j.neuroscience.2006.06.016. [DOI] [PubMed] [Google Scholar]
- Tian F, Gourine AV, Huckstepp RT, Dale N. A microelectrode biosensor for real time monitoring of L-glutamate release. Anal Chim Acta. 2009;645:86–91. doi: 10.1016/j.aca.2009.04.048. [DOI] [PubMed] [Google Scholar]
- Wall MJ, Dale N. Auto-inhibition of rat parallel fibre-Purkinje cell synapses by activity-dependent adenosine release. J Physiol. 2007;581:553–565. doi: 10.1113/jphysiol.2006.126417. [DOI] [PMC free article] [PubMed] [Google Scholar]
- Wall MJ, Atterbury A, Dale N. Control of basal extracellular adenosine concentration in rat cerebellum. J Physiol. 2007;582:137–152. doi: 10.1113/jphysiol.2007.132050. [DOI] [PMC free article] [PubMed] [Google Scholar]
- Wall MJ, Wigmore G, Lopatár J, Frenguelli BG, Dale N. The novel NTPDase inhibitor sodium polyoxotungstate (POM-1) inhibits ATP breakdown but also blocks central synaptic transmission, an action independent of NTPDase inhibition. Neuropharmacology. 2008;55:1251–1258. doi: 10.1016/j.neuropharm.2008.08.005. [DOI] [PubMed] [Google Scholar]
- Wall MJ, Dale N. Activity-dependent release of adenosine: a critical re-evaluation of mechanism. Curr Neuropharmacol. 2008;6:329–337. doi: 10.2174/157015908787386087. [DOI] [PMC free article] [PubMed] [Google Scholar]
- Wall M, Eason R, Dale N. Biosensor measurement of purine release from cerebellar cultures and slices. Purinergic Signalling. 2010;6:339–348. doi: 10.1007/s11302-010-9185-8. [DOI] [PMC free article] [PubMed] [Google Scholar]
- Waniewski RA, Martin DL. Preferential utilization of acetate by astrocytes is attributable to transport. J Neurosci. 1998;18:5225–5233. doi: 10.1523/JNEUROSCI.18-14-05225.1998. [DOI] [PMC free article] [PubMed] [Google Scholar]
- White TD, MacDonald WF. Neural release of ATP and adenosine. Ann N Y Acad Sci. 1990;603:287–298. doi: 10.1111/j.1749-6632.1990.tb37680.x. [DOI] [PubMed] [Google Scholar]
- Wong YC, Billups B, Johnston J, Evans RJ, Forsythe ID. Endogenous activation of adenosine A1 receptors but not P2X receptors during high-frequency synaptic transmission at the Calyx of Held. J Neurophysiol. 2006;95:3336–3342. doi: 10.1152/jn.00694.2005. [DOI] [PubMed] [Google Scholar]
- Zamzow CR, Bose R, Parkinson FE. N-Methyl-D-aspartate-evoked adenosine and inosine release from neurons requires extracellular calcium. Can J Physiol Pharmacol. 2009;87:850–858. doi: 10.1139/Y09-075. [DOI] [PubMed] [Google Scholar]
- Zhang JM, Wang HK, Ye CQ, Ge W, Chen Y, Jiang ZL, Wu CP, Poo MM, Duan S. ATP released by astrocytes mediates glutamatergic activity-dependent heterosynaptic suppression. Neuron. 2003;40:971–982. doi: 10.1016/s0896-6273(03)00717-7. [DOI] [PubMed] [Google Scholar]
- Zhang D, Xiong W, Chu S, Sun C, Albensi BC, Parkinson FE. Inhibition of hippocampal synaptic activity by ATP, hypoxia or oxygen-glucose deprivation does not require CD73. PLoS ONE. 2012;7:e39772. doi: 10.1371/journal.pone.0039772. [DOI] [PMC free article] [PubMed] [Google Scholar]
- Zimmermann H. Extracellular metabolism of ATP and other nucleotides. Naunyn-Schmiedeberg's Arch Pharmacol. 2000;362:299–309. doi: 10.1007/s002100000309. [DOI] [PubMed] [Google Scholar]
- zur Nedden S, Hawley S, Pentland N, Hardie DG, Doney AS, Frenguelli BG. Intracellular ATP influences synaptic plasticity in area CA1 of rat hippocampus via metabolism to adenosine and activity-dependent activation of adenosine A1 receptors. J Neurosci. 2011;31:6221–6234. doi: 10.1523/JNEUROSCI.4039-10.2011. [DOI] [PMC free article] [PubMed] [Google Scholar]