

Abstract
DNA methylation plays an important role in carcinogenesis through epigenetic silencing of tumor suppressor genes. Aberrant methylation usually results from changes in the activity of DNA methyltransferases (DNMTs). Some studies show that the overexpression of the DNMTs may lead to aberrant methylation of tumor suppressor genes. Also the overexpression of DNMTs may be related to methylation status of their genes. Due to limited number of studies on DNMT3B promoter methylation, this study was performed to quantitatively measure the methylation level of DNMT3B gene in archival formalin fixed paraffin embedded (FFPE) tissues from breast cancer patients. Using differential high resolution melting analysis (D-HRMA) technology, the methylation level of DNMT3B gene promoter was quantified in 98 breast cancer FFPE tissues and also 10 fresh frozen normal tissue samples. Statistical analyses used for analyzing the correlation between the methylation and clinical variables. All the normal samples were found to be methylated at the DNMT3B promoter (the average methylation level 3.34%). Patients were identified as hypo-methylated (mean methylation level 0.8%), methylated (mean methylation level 2.48%) and hyper-methylated (mean methylation level 10.5%). Statistical analysis showed a significant correlation between the methylation status and the sample type, cancer type and tumor size. Also the methylation level was significantly associated with histologic grade. It is concluded that quantification of DNMT3B promoter methylation might be used as a reliable and sensitive diagnostic and prognostic tool in breast cancer. Also D-HRMA is demonstrated as a rapid and cost effective method for quantitative evaluation of promoter methylation.
Keywords: DNA methylation, DNMT3B, Breast cancer, High resolution melting analysis, FFPE
INTRODUCTION
Methylation at 5-position of cytosine in DNA is the most common epigenetic change that plays a critical regulating role in mammalian cells, including genomic imprinting, X-chromosome inactivation, transposon silen-cing, regulation of gene expression and development (1,2). Alterations in methylation pattern of DNA such as hypo- or hyper-methylation of DNA have been found in many human diseases, especially in cancers (1,3). Cancer cells commonly represent global hypo-methylation in the whole genome and regional hyper-methylation in the promoter of tumor suppressor and DNA repair genes (1,4). These aberrant methylations are caused by changes in the activity of DNA methyl-transferases (DNMTs) catalyzing the addition of methyl groups to cytosine nucleotides at CpG sites (1).
Among the DNMT enzyme family, the DNMT3 subfamily with two important members, DNMT3A and DNMT3B, are responsible for de novo methylation. In contrast DNMT1 performs maintenance methylation following DNA replication (1,3). Several studies have demonstrated the increased expression of the DNMTs can result in hyper-methylation of specific tumor suppressor genes and poorer prognosis of cancer (5–7). Although some other reports have shown that there is no correlation between DNMT expression and regional DNA hyper-methylation (8). It seems that over-expression of DNMTs in cancer may be related to hypo-methylation of the promoter region of their genes. As it has been reported by Rajendran and coworkers, DNMT3B overexpression is accompanied by DNMT3B promoter hypo-methylation in glioma tumors. But overexpressed DNMT1 revealed an unmethylated DNA at the promoter region in tumor samples, similar to that was detected in normal brain tissues (9). However, Zhu and colleagues have claimed that in both normal and neoplastic pituitary samples, low methylation level at promoter region of DNMT3B was detectable and no significant difference was observed between these groups (10). Another study that has been performed by Drini and coworkers also showed that there was no association between the DNMTs promoter methylation and hyperplastic polyposis syndrome. In other words the DNMT genes in normal and diseased tissues were similarly unmethylated (11). Therefore in our study we decided to quantitatively determine the promoter methylation of DNMT3B gene in breast cancer and its relation with patients’ clinical prognostic factors. To our knowledge, till present no study has been performed for quantitative analysis of the promoter methylation of DNMT3B gene in breast cancer patients.
Many different methods have been developed for assaying the DNA methylation. Previously used methods were further qualitative, but new quantitative methods for evaluating DNA methylation level are introduced. Differential high resolution melting analysis (D-HRMA) is one of these quantitative techniques that have been recently used for the assessment of DNA methylation levels (12–14). This method is based on resolving the bisulfite treated DNA templates with different methyl cytosine contents, by melting analysis, according to their different melting points (12,13). Also in comparison to other quanti-tative methods, it is a relatively simple and cost effective technique for the measurement of DNA methylation (13) .
We also used archival formalin fixed paraffin embedded (FFPE) tissues as a source for extracting DNA. FFPE blocks represent a considerable and enormous source for testing and analyzing clinically important diseases. To the best of our knowledge, till present not many studies have been done on the performance of D-HRMA in FFPE tissues, because of the difficulties regarding the extraction of DNA with high quality (13). The present study was designed to quantitatively determine the promoter methylation of DNMT3B gene in archival FFPE tissues from breast cancer patients using D-HRMA method.
MATERIALS AND METHODS
Specimens and controls
Ninety eight breast cancer FFPE tissue samples related to years 2005 to 2009 were collected from the Department of Pathology of Imam Khomeini and Shafa University Hospitals, in Ahvaz, Iran. Samples were identified as ductal carcinoma in situ (DCIS) (n=8), invasive ductal carcinoma (IDC) (n=65), invasive and in situ ductal carcinoma (DCIS + IDC) (n=20), invasive lobular and ductal carcinoma (ILC+IDC) (n=2) and inflammatory carcinoma (n=3). Additionally 10 fresh frozen tissue samples from normal marginal tissues of tumor in breast cancer patients were prepared and analyzed. Ethical guidelines were met for sample collection.
Epitect Control DNA methylated and bisulfite converted (Qiagen, Germany) and epitect control dna unmethylated and bisulfite converted (Qiagen, Germany) were used as positive (fully methylated) and negative (fully unmethylated) controls, respectively. Also epitect control DNA unmethylated and unconverted (Qiagen, Germany) was used as the control for bisulfite treatment.
A series of standard dilutions of methylated DNA was prepared by diluting 100% or fully methylated and bisulfite treated control DNA in a background of unmethylated and bisulfite treated control DNA at ratios of 50%, 5% and 1%.
Genomic DNA extraction and bisulfite treatment
The stained pathological slides of each patient were reviewed by pathologist and the appropriate ones containing the maximum percent of cancer cells were selected. The corresponding paraffin blocks were sliced into 6 micron samples by the means of a microtome. Genomic DNA of patient samples was extracted from paraffin block slices using QIAamp DNA FFPE Tissue Kit following the manufacturer’s instructions (Qiagen, Germany). Genomic DNA of fresh frozen normal tissues was isolated by standard SDS-proteinase K digestion and phenol-chloroform extraction method.
After determining the DNA concentration of samples by NanoDrop 2000 instrument (Thermo Scientific), the samples were modified using Epitect Bisulfite Kit (Qiagen, Germany), according the manufacturer’s protocol. Bisulfite treated DNA was resuspended in 20 μl elution buffer and used for D-HRMA. To control the bisulfite treatment method, EpiTect control DNA unmethylated and unconverted (Qiagen, Germany) was used as the template for bisulfite modification.
Differential high resolution melting analysis
A Rotor-GeneTM 6000 (Corbett Research, Australia) was utilized for PCR amplification and HRM analysis. A pair of primers were designed by Methprimer software (Li Lab, USA), amplifying a 95 bp product with 6 CpG sites. The primer sequences for DNMT3B (HUGO Gene Nomenclature Committee, HGNC: 2979) were as follows: meDNMT3BF95: 5’-AAAGTAGGATGA TA GGTAGGGGTAT-3’ and meDNMT3BR95: 5’-TATAATCACACAACACCAAAATCTC-3’.
PCR amplification was carried out in 20 μl volume containing: 1X Epitect HRM PCR Master Mix (Qiagen, Germany), 750 nM of each primer and 100 ng bisulfite treated DNA template. The amplification condition was 5 min at 95o C, then 50 cycles including 10 sec at 95o C, 30 sec at 55o C, 10 sec at 72o C. An optional denaturation and renaturation step was performed for 30 sec at 95o C and 30 sec at 50o C, followed by an HRM step ramping from 60o C to 85o C rising 0.1o C per 2 sec.
Using the software provided by Rotor-Gene 6000, the normalization of melting curves was performed for two normalization regions before and after the major fluorescence decrease. This algorithm permits the direct comparison of samples with different starting fluorescence levels. The differential graph was evaluated for each sample by comparing the value of fluorescence at the melting point against the value of fluorescence of the negative (unmethylated) control. All samples were analyzed in duplicate.
Statistical analysis
Samples were considered as hyper-methylated when the measured methylation level exceeded the mean methylation level of normal samples by two times the standard deviation of normal samples, and conversely, as hypo-methylated when the methylation level was less than the mean methylation level of normal samples by two times the standard deviation of normal samples. Correlations between the methylation levels and samples’ demographic and clinical variables were analyzed using Pearson, Kendall’s tau-b correlation tests. Also one way ANOVA was used to compare the methylation levels. Chi-squared and nonparametric Kruskal-Wallis test were used to determine the relationship between the methylation status and different demographic and clinical factors. All analyses were performed using Statistical Package for Science Software (SPSS) version 16.0. P <0.05 was considered statistically significant.
RESULTS
The standard curve for DNMT3B D-HRMA
To determine the amount of methylated DNA in the unknown samples, the linearity of the standard curve must be guaranteed for the assay. Using a range of dilutions as described in the materials and methods section, we tried to meet this requirement. All dilutions showed amplification plots with comparable Ct values (Fig. 1A). The normalized fluorescence HRM graph showed different HRM profiles for various amplicons indicating the differences in their melting points (Fig. 1B).
Fig. 1.
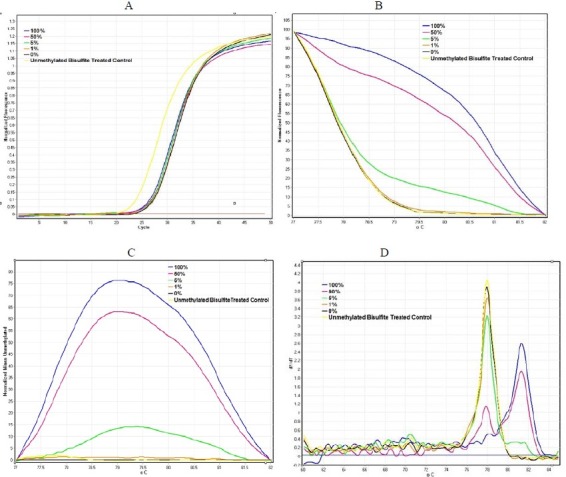
DNMT3B D-HRMA graphs using serial dilutions of methylated DNA (from 100% to 0%). (A) The amplification plots were obtained for all standard dilutions (from 100% to 0% methylated DNA) as the template, with comparable Ct values. (B) The normalized fluorescence HRM profiles of various amplicons amplified from each standard diluted methylated DNA. (C) The differential fluorescence plots were obtained by normalizing HRM profiles against the unmethylated DNA. (D) The melting curve of the standard dilutions identified the specificity of the assay.
The differential fluorescence graph was obtained by normalizing HRM profiles against the unmethylated control DNA (Fig. 1C). Also the melting curve of the standard dilutions identified the specificity of the assay (Fig. 1D). Due to differences in fluorescence of the dilutions, differential analysis generated peaks with various heights. The highest peak corresponded to 100% methylated DNA. The height of other peaks decreased proportional tocorresponded to 100% methylated DNA. The height of other peaks decreased proportional to decreasing the percentage of methylation in the diluted samples. The Rotor-Gene 6000 software made it possible to obtain the value of height for each differential fluorescence peak (Fig. 2A). These values were then plotted against the dilution factors to produce a linear calibration curve (Fig. 2B). Also unmethylated and unconverted control DNA was used as the control for bisulfite modification. The graphs related to the unmethylated and bisulfite converted control DNA and unmethylated control DNA subjected to bisulfite treatment, fitted quite well. Thus these results confirm the accuracy of bisulfite treatment protocol.
Fig. 2.
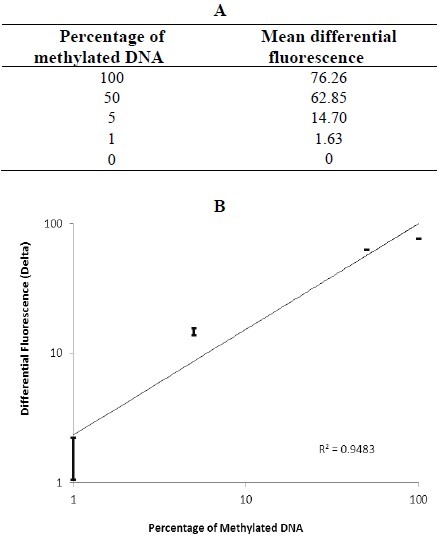
Differential fluorescence values and the standard curve of the serial dilutions of methylated DNA (from 100% to 0%). (A) Differential fluorescence values obtained at the melting point of each standard dilution. (B) The standard curve generated by plotting differential fluorescence values against the percentage of methylation. All the dilutions were tested in duplicate.
DNMT3B methylation D-HRMA in breast cancer
After the preliminary assessment of the linearity of D-HRMA in quantifying the methylation levels of DNMT3B promoter region, we determined the percentage of methylation in DNA extracted from 98 breast cancer FFPE tissues and 10 normal breast tissues. The DNA was subjected to amplification and HRM, and the resulting plots were used to calculate the methylation levels. Both the methylation status and level were analyzed against demographic and clinicopathological variables. Table 1 summarizes the samples’ information and results obtained by statistical analysis. The results showed that the mean methylation level of the normal samples was 3.34% with the standard deviation of 0.97%.
Table 1.
Clinical characteristics of the analyzed samples and analysis of DNMT3B promoter methylation according to variables.

About 48% of patients had the mean methylation level of 0.8 ± 0.36% and therefore were classified as hypo-methylated. 37.8% of patients were methylated with the average methylation level of 2.48 ± 0.92%. Also 14.3% of the patients had the mean methylation level of 10.5 ± 9.51% and were classified as hyper-methylated. Statistical analysis showed a significant correlation between the sample type and the methylation status (P =0.001), although no significant correlation was observed between the sample type and the mean methylation level (P =0.737).
Also statistical analyses represented a significant correlation between the DNMT3B promoter methylation status and the cancer type (P =0.006). One way ANOVA test showed a significant association between the methylation level and cancer type (P <0.001).
Tukey and Bonferroni post hoc tests further demonstrated that the DNMT3B promoter methylation level was significantly higher in patients with mixed invasive lobular and ductal carcinoma (ILC+IDC) compared to other types of breast cancer (P <0.001). Also there was a significant correlation between the methylation level and histologic grade (P =0.016). No significant correlation was observed between the methylation status and grade (P=0.136). However about 54.3% of high grade tumors (grade III + IV) and 42.3% of low grade tumors were hypo-methylated, compared to the normal samples (P =0.001).
The methylation status was significantly correlated with tumor size (P =0.038) and gender (P =0.032), although there was no significant association between the methylation level and tumor size (P =0.671) or gender (P=0.352). (Fig. 3) shows the association between DNMT3B methylation level and cancer type, histologic grade and tumor size. Also no significant correlation was shown between the methylation status or level and patients’ age or other cancer progression hallmarks such as nodal involvement, distant metastasis and clinical staging.
Fig. 3.
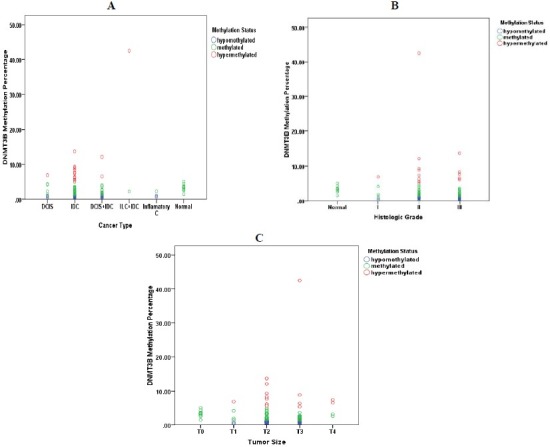
Association between DNMT3B methylation level and cancer type (A), histologic grade (B,) and tumor size (C).
Furthermore, in comparison with all normal samples which had the methylation level between 1-5%, in 45 out of the 98 breast cancer patients (45.9%), the DNMT3B methylation was detected below 1%. In the DNA from 42 of the 98 patients (42.9%), the methylation level was between 1 and 5%. Also 9 samples (9.2%) had methylation level between 5 and 10% and for the remaining 2 samples (2%) the methylation was in the range of 10-50% (Table 2).
Table 2.
Screening the samples using DNMT3B D-HRMA in breast cancer and normal tissues.

DISCUSSION
The role of aberrant methylation in carcinogenesis and cancer biology is well characterized. The aberrant methylation often results from alterations in the activity of DNMT enzymes (1–3). Also it seems that overexpression of DNMTs in cancer, may be caused by hypo-methylation of the promoter region of their genes, as it has been claimed by Rajendran and coworkers for DNMT3B (9) .
However some reports do not confirm this hypothesis (10,11). In this study we quan-titatively evaluated the promoter methylation of DNMT3B gene in breast cancer patients.
We used D-HRMA as a sensitive and reliable method for the assessment of DNA methylation in 98 breast cancer FFPE tissues and also 10 normal samples. Both the patients and normal samples showed a low average methylation level with little difference between them. The low methylation level at promoter region of DNMT3B in pituitary cell, with little difference between normal and tumor samples has previously been reported (10). Another study also showed that DNMTs genes in normal and polyp tissues were similarly unmethylated (11). Meanwhile, there was a significant difference between the methylation levels of patients. According to the mean methylation level of normal samples, the patients could be classified as hypo-methylated, methylated and hyper-methylated. it has also been shown that DNMT3B promoter in glioma tumors is found to be hypo-methylated. Also it has been claimed that the overexpression of DNMT3B in glioma tumors may have resulted from its promoter hypo-methylation, although the overexpression of DNMT1 in tumor samples has not revealed any association with its promoter methylation status (9). In general the molecular mechanisms affecting the epigenetic regulation of DNMTs are still not well characterized. Association of overexpression of both DNMT1 and DNMT3B proteins in lung cancer with hypermethylation of multiple tumor suppressor genes and thus poorer prognosis have been reported (5,6). However, the DNMT protein and mRNA levels are not simply associated with hyper-methylation in cancer (8,15). On the other hand the study performed by Lopez and coworkers revealed that the increased expression of DNMT3B protein in colorectal cancer is due to the stabilization of DNMT3B mRNA by HuR proteins upon promoter methylation (1). In our study, we have detected that DNMT3B promoter might be hypo-methylated in breast cancer. However further analysis should be performed on the relation between DNMT3B mRNA and protein levels and its methylation status.
We detected that the mean level of DNMT3B methylation was approximately lower in advanced grades of breast cancer suggesting that the DNMT3B hypo-methylation might be used as a marker for cancer progression. In other words, the lower the DNMT3B methylation level is, the more the expression of DNMT3B, thus the more hyper-methylation of tumor suppressor genes and the more progression of cancer. Of course there was an unexpected high methylation level in grade II of cancer. A differential methylation pattern of DNMT3B in gliomas, i.e., a hypo-methylation in tumor samples and a hyper-methylation in normal ones have reported by researchers. Also a few of the high grade tumors (especially grade IV) displayed aberrant methylation. Their study also showed DNMT1 promoter in normal and tumor samples was similarly unmethylated (9). Gomori and coworker also have reported DNMT1 promoter hyper-methylation is not observed in low grades of gliomas but it mainly occurs in secondary gliobastomas (16) .
We found that patients with mixed ILC and IDC had the highest percentage of promoter methylation. Meanwhile patients with DCIS, IDC, DCIS+ IDC and inflammatory carcinoma respectively had lower percentage of methylations rather than normal samples, indicating that DNMT3B methylation level might be related to the type of cancer. To our knowledge, there have been no reports of quantification of DNMT3B methylation in breast cancer patients. However further analysis may be necessary to examine this hypothesis.
Also we found that methylation status correlated with tumor size, i.e., by increasing the tumor size, the percentage of hypo-methylated samples is increased. However tumors with sizes above 2 displayed an aberrant high methylation level. This is a novel finding since there have been no reports of any significant correlation between DNMT3B methylation status and tumor size. The previous studies show no link between the DNMT3B expression status and tumor size in breast cancer (17) .
CONCLUSION
In summary, our study presents substantial information related to methylation status of DNMT3B promoter. Also it demonstrates the applicability of D-HRMA as a fast, reliable and cost effective technique in quantification of promoter methylation, especially in FFPE tissues. In addition methylation sensitive D-HRMA can be used as a promising tool for the detection of new biomarkers in cancers, helping us for early diagnosis, prognosis and treatment of the disease.
ACKNOWLEDGMENT
The authors thank Dr. Rashidi from pathology section of Shafa University Hospital, Ahvaz, Iran. This study was financially and technically supported by School of Pharmacy and Pharmaceutical Sciences, Isfahan, Iran.
REFERENCES
- 1.Lopez de Silanes I, Gorospe M, Taniguchi H, Abdelmohsen K, Srikantan S, Alaminos M, et al. The RNA-binding protein HuR regulates DNA methylation through stabilization of DNMT3b mRNA. Nucleic Acids Res. 2009;37:2658–2671. doi: 10.1093/nar/gkp123. [DOI] [PMC free article] [PubMed] [Google Scholar]
- 2.Li JY, Pu MT, Hirasawa R, Li BZ, Huang YN, Zeng R, et al. Synergistic function of DNA methyl transferases DNMT3A and DNMT3B in the methylation of Oct4 and Nanog. Mol Cell Biol. 2007;27:8748–8759. doi: 10.1128/MCB.01380-07. [DOI] [PMC free article] [PubMed] [Google Scholar]
- 3.Yaqinuddin A, Qureshi SA, Qazi R, Abbas F. Down-regulation of DNMT3B in PC3 cells effects locus-specific DNA methylation, and represses cellular growth and migration. Cancer Cell Int. 2008;8:13–25. doi: 10.1186/1475-2867-8-13. [DOI] [PMC free article] [PubMed] [Google Scholar]
- 4.Tang M, Xu W, Wang Q, Xiao W, Xu R. Potential of DNMT and its epigenetic regulation for lung cancer therapy. Curr Genomics. 2009;10:336–352. doi: 10.2174/138920209788920994. [DOI] [PMC free article] [PubMed] [Google Scholar]
- 5.Lin RK, Hsu HS, Chang JW, Chen CY, Chen JT, Wang YC. Alteration of DNA methyltransferses contributes to 5’CpG methylation and poor prognosis in lung cancer. Lung Cancer. 2007;55:205–213. doi: 10.1016/j.lungcan.2006.10.022. [DOI] [PubMed] [Google Scholar]
- 6.Lin TS, Lee H, Chen RA, Ho ML, Lin CY, Chen YH, et al. An association of DNMT3b protein expression with P16INK4a promoter hypermethylation in non-smoking female lung cancer with human papillomavirus infection. Cancer Lett. 2005;226:77–84. doi: 10.1016/j.canlet.2004.12.031. [DOI] [PubMed] [Google Scholar]
- 7.Miyake T, Endo K, Honjo S, Hirooka Y, Ikeguchi M. Expression of DNA methyltransferase (DNMT) 1, 3a and 3b proteins in human hepatocellular carcinoma. Yonago Acta medica. 2010;53:1–7. [Google Scholar]
- 8.Park HJ, Yu E, Shim YH. DNA methyltransferase expression and DNA hypermethylation in human hepatocellular carcinoma. Cancer Lett. 2006;233:271–278. doi: 10.1016/j.canlet.2005.03.017. [DOI] [PubMed] [Google Scholar]
- 9.Rajendran G, Shanmuganandam K, Bendre A, Majumdar D, Goel A, Shiras A. Epigenetic regulation of DNA methyltransferases: DNMT1 and DNMT3B in gliomas. J Neurooncol. 2011;104:483–494. doi: 10.1007/s11060-010-0520-2. [DOI] [PubMed] [Google Scholar]
- 10.Zhu X, Mao X, Hurren R, Schimmer AD, Ezzat S, Asa SL. Deoxyribonucleic acid methyltransferase 3B promotes epigenetic silencing through histone 3 chromatin modifications in pituitary cells. J Clin Endocrinol Metab. 2008;93:3610–3617. doi: 10.1210/jc.2008-0578. [DOI] [PubMed] [Google Scholar]
- 11.Drini M, Wong NC, Scott HS, Craig JM, Dobrovic A, Hewitt CA, et al. Investigating the potential role of genetic and epigenetic variation of DNA methyltransferase genes in hyperplastic polyposis syndrome. PLoS ONE. 2011;6:16831–16838. doi: 10.1371/journal.pone.0016831. [DOI] [PMC free article] [PubMed] [Google Scholar]
- 12.Liu W, Guan M, Su B, Li J, Ma W, Liu C, et al. Rapid determination of AKAP12 promoter methylation levels in peripheral blood using methylation-sensitive high resolution melting (MS-HRM) analysis: application in colorectal cancer. Clinica Chimica Acta. 2010;411:940–946. doi: 10.1016/j.cca.2010.03.003. [DOI] [PubMed] [Google Scholar]
- 13.Balic M, Pichler M, Strutz J, Heitzer E, Ausch C, Samonigg H, et al. High quality assessment of DNA methylation in archival tissues from colorectal cancer patients using quantitative high-resolution melting analysis. J Mol Diagn. 2009;11:102–108. doi: 10.2353/jmoldx.2009.080109. [DOI] [PMC free article] [PubMed] [Google Scholar]
- 14.Malentacchi F, Forni G, Vinci S, Orlando C. Quantitative evaluation of DNA methylation by optimization of a differential-high resolution melt analysis protocol. Nucleic Acids Res. 2009;37:1–10. doi: 10.1093/nar/gkp383. [DOI] [PMC free article] [PubMed] [Google Scholar]
- 15.Ehrlich M, Woods CB, Yu MC, Dubeau L, Yang F, Campan M, et al. Quantitative analysis of association between DNA hypermethylation, hypomethylation, and DNMT RNA levels in ovarian tumors. Oncogene. 2006;25:2636–2645. doi: 10.1038/sj.onc.1209145. [DOI] [PMC free article] [PubMed] [Google Scholar]
- 16.Gomori E, Pal J, Kovacs B, Doczi T. Concurrent hypermethylation of DNMT1, MGMT and EGFR genes in progression of gliomas. Diagn Pathol. 2012;7:8–15. doi: 10.1186/1746-1596-7-8. [DOI] [PMC free article] [PubMed] [Google Scholar]
- 17.Girault I, Tozlu S, Lidereau R, Bieche I. Expression analysis of DNA methyltransferases 1, 3A, and 3B in sporadic breast carcinomas. Clin Cancer Res. 2003;9:4415–4422. [PubMed] [Google Scholar]