

Background: The superior olivary complex (SOC) is an essential center for spatial hearing.
Results: Generation of a comprehensive qualitative and quantitative catalogue of the developmental changes in the SOC-related gene repertoire.
Conclusion: Postnatal maturation of the SOC is shaped by extensive molecular changes.
Significance: This work identifies strong candidate genes for normal and impaired hearing and genetic evidence for retrocochlear functions of deafness genes.
Keywords: Genetic Diseases, Neurodevelopment, Neurodifferentiation, Neuroprotection, Transcription Factors, Auditory Processing Disorder, Circuit Development, Deafness, Retrocochlear Function
Abstract
The superior olivary complex (SOC) is an essential auditory brainstem relay involved in sound localization. To identify the genetic program underlying its maturation, we profiled the rat SOC transcriptome at postnatal days 0, 4, 16, and 25 (P0, P4, P16, and P25, respectively), using genome-wide microarrays (41,012 oligonucleotides (oligos)). Differences in gene expression between two consecutive stages were highest between P4 and P16 (3.6%) and dropped to 0.06% between P16 and P25. To identify SOC-related genetic programs, we also profiled the entire brain at P4 and P25. The number of differentially expressed oligonucleotides between SOC and brain almost doubled from P4 to P25 (4.4% versus 7.6%). These data demonstrate considerable molecular specification around hearing onset, which is rapidly finalized. Prior to hearing onset, several transcription factors associated with the peripheral auditory system were up-regulated, probably coordinating the development of the auditory system. Additionally, crystallin-γ subunits and serotonin-related genes were highly expressed. The molecular repertoire of mature neurons was sculpted by SOC-related up- and down-regulation of voltage-gated channels and G-proteins. Comparison with the brain revealed a significant enrichment of hearing impairment-related oligos in the SOC (26 in the SOC, only 11 in the brain). Furthermore, 29 of 453 SOC-related oligos mapped within 19 genetic intervals associated with hearing impairment. Together, we identified sequential genetic programs in the SOC, thereby pinpointing candidates that may guide its development and ensure proper function. The enrichment of hearing impairment-related genes in the SOC may have implications for restoring hearing because central auditory structures might be more severely affected than previously appreciated.
Introduction
How neurons acquire task-specific physiological properties and connectivity is a fundamental issue in developmental neuroscience. A favorable system for gaining insight into the development and maturation of sensory circuits is the mammalian auditory brainstem. In rats and mice, hearing onset occurs at postnatal days 10–12 (P10–P12)3 (1), and maturation processes continue until P25–P30 (reviewed in Refs. 2 and 3). The postnatal occurrence of these processes provides excellent access to experimental studies of many aspects of neurosensory development.
A prominent center in the mammalian auditory brainstem is the superior olivary complex (SOC). It consists of various nuclei, such as the lateral superior olive, the medial superior olive, and the medial nucleus of the trapezoid body (MNTB), which are involved in sound localization and information feedback to the cochlea. Accumulating evidence indicates that dysfunction of the auditory brainstem, including the SOC, contributes to auditory processing disorders and developmental learning disabilities, such as dyslexia and autism spectrum disorders (4). Insight into the genetic causes of these disorders requires knowledge of the molecular repertoire underlying the developmental processes in the auditory brainstem. In the SOC, these processes include the formation of precise tonotopic projections and the adjustment of the molecular repertoire to the demands of fast and precise neurotransmission, which is required for accurate sound localization.
To identify the underpinning genetic programs, we performed an unbiased survey of gene expression at four developmental stages (P0, P4, P16, and P25) in the rat SOC using genome-wide microarrays. By P0, neurogenesis and neuronal migration are almost complete, and the basic layout of SOC circuits has become established with functional synapses and only few aberrant connections (5, 6). At P4, SOC neurons still show many signs of immaturity, such as depolarizing GABAergic and glycinergic action (7, 8), and axonal (9) and dendritic pruning (10). Furthermore, there is ongoing neurite outgrowth and functional refinement (9, 11, 12). The stage of P16, about 4–6 days after hearing onset, is often used for in vitro electrophysiological analyses of the mature-like auditory system (7, 13–15). It is also a stage of extensive axonal elimination (9). Finally, P25 closely resembles the mature system (10, 16) while precluding aging effects on the gene expression profile. To identify SOC-related genetic programs, we also assessed the gene expression profiles in the entire brain at P4 and P25 and compared them with the age-matched SOC profiles. To validate the microarray data, quantitative real-time PCR experiments and immunohistochemistry were finally performed. The resulting data provide molecular insights into cellular and physiological hallmarks of the developing SOC and identify strong functional candidates for postnatal SOC maturation.
EXPERIMENTAL PROCEDURES
Animals
Female and male Sprague-Dawley rats or C57BL6 mice were used at P0, P4, P16, and P25. We used animals of both genders because previous analysis had demonstrated negligible sex-specific expression in the SOC (17). All protocols were in accordance with the German Animal Protection law and approved by the local animal care and use committee (Landesuntersuchungsamt Rhineland Palatinate, Germany). Protocols also followed the National Institutes of Health guide for the care and use of laboratory animals.
Tissue Preparation for Microarray Experiments
Animals were anesthetized with 7% chloral hydrate (1 ml/100 g) and decapitated. Tissue preparation was carried out in chilled buffer solution (∼4 °C) containing 25 mm NaHCO3, 2.5 mm KCl, 1.25 mm NaH2PO4, 1 mm MgCl2, 2 mm CaCl2, 260 mm d-glucose, 2 mm sodium pyruvate, 3 mm myo-inositol, and 1 mm kynurenic acid. This solution was gassed for 30 min with 95% O2 and 5% CO2 to adjust the pH to 7.4. The brain was removed from the skull and either immediately stored in RNAlater (Ambion, Darmstadt, Germany) or processed to isolate the SOC. In the latter case, the brainstem was dissected, and 300-μm-thick coronal slices, containing the SOC, were cut with a vibratome (Leica VT 100 S, Leica, Nussloch, Germany). To ensure that the regions used for microarrays were comparable across the different ages used, slices were carefully inspected under a binocular microscope. SOC structures were clearly identified under this condition, even in unstained slices. Further dissection of the SOC also occurred under binocular control. At P16 and P25, the SOCs were bilaterally collected from two consecutive slices, whereas at P0 and P4, only one slice was used. Collected tissue was stored in RNAlater at −80 °C.
Total RNA Isolation
Total RNA used for hybridization experiments was isolated from the entire brain or from the SOCs of single animals at P16 and P25. Due to the small sample amount, SOCs from four animals were pooled at P0 and from two animals at P4. Total RNA extraction was performed with the RNeasy Lipid Tissue Kit (Qiagen, Hilden, Germany) according to the manufacturer's instructions. The SOC tissue was lysed in 1 ml of Qiazol using a homogenizer (Miccra D-8, Roth, Karlsruhe, Germany) at 23,500 rpm for 15 s. For whole brain tissue, the extraction was carried out with the RNeasy Midi Tissue Kit (Qiagen, Hilden, Germany). Homogenization of a single brain was performed in 15 ml (P4) or 45 ml (P25) of RLT buffer (supplied by Qiagen; 23,500 rpm for 15 s). To proceed, 2 ml of the homogenates were used. The determination of total RNA integrity and purity was assessed via a 2100 Bioanalyzer (Agilent, Böblingen, Germany).
Microarray Experiments
Hybridization of fluorescently labeled cRNA samples was performed on whole rat genome, 60-mer sequence nucleotide microarrays from Agilent (4 × 44,000). This microarray platform contains 41,012 rat genes, expressed sequence tags, or predicted genes. Because many genes are represented by more than one 60-mer on the array, we refer to the spotted sequences as “oligos.” The synthesis of the cRNA samples was performed according to the manufacturer's protocol with the Agilent Low RNA Input Linear Amplification Kit (Agilent). 1,000 ng of total RNA were used as starting material. The yield and incorporation of the dyes were assessed using a NanoDrop ND-1000 UV-visible spectrophotometer (Peqlab, Erlangen, Germany). Between six (SOC stages P0 and P4, whole brain stages P4 and P25) and nine (SOC stages P16 and P25) cRNA samples from different animals were hybridized as biological replicates and used for statistical analysis. Furthermore, 13 cRNA samples were hybridized twice, as technical replicates (10 samples) or dye swap experiments (three samples). Hierarchical cluster analysis was performed via the freely available software HCE2 (Hierarchical Clustering Explorer 2). Raw data analyses were performed using Agilent Feature Extraction software (version 8.1), and data normalization and statistics were performed by in-house software packages and algorithms of the Fraunhofer Institute for Industrial Mathematics (ITWM). They included a Lowess transformation with smoothing parameter of 0.2 to reduce intensity-dependent errors.
Statistical and Bioinformatic Analyses
Two different types of statistical analysis were applied to the data set. The H test of Kruskal and Wallis was performed for the time course study in the SOC comparing gene expression measurements of all age stages with each other (18). Pairwise comparisons of two different stages (SOC or brain between P4 and P25) or different tissues at the same stage (SOC ↔ brain) were evaluated using Wilcoxon's U test (19). A false discovery rate estimation was performed to ensure the quality of the statistics using a bootstrap method (20). The SOC ↔ brain signature list contains those genes that were present in both the P4 and the P25 signature lists because nothing indicated that the data were following a normal distribution; thus, it provides a conservative estimation of genes being up-regulated in the SOC at both stages.
To annotate the transcription factors within the 41,012 oligos, we downloaded the gene sequences associated with 1,445 transcription factors (TFs) and 133 co-factors described previously (21) from GenBankTM and built a local BLAST-formatted database using formatdb from the BLAST package. Thereafter, each oligo was aligned individually against the database using the BLASTn function of BLASTall. All hits with an E-value of less than 10−10 were considered significant. In total, 2,159 hits were found for 2,020 separate oligos. Most of the 2,020 oligos (1,965) matched to only a single TF sequence. Oligos with a large number of hits (the maximum being 16) were usually matching highly similar zinc finger protein variants. Specific enrichment of TF binding sites in subsets of oligos was determined using PAINT and the Transfac Prof database.
To evaluate the statistical relevance of the total number of transcripts associated with hearing impairment in the SOC and the brain, we assumed that a gene can display with the same probability r (with probability 1 − r, both samples show within error bars the same expression level) a higher or lower expression level in the SOC compared with the brain (null hypothesis). Let q1 be the number of cases in which the SOC shows a significantly higher expression level within m genes and q2 the number of cases in which the expression level is higher in the brain, denoted by (q1, q2, m). We obtained p from a maximum likelihood argument (22). The joint probability for (q1, q2, m) is as follows.
 |
The maximum likelihood value of r is obtained from δlog Q/δr = 0, which leads immediately to r = (q1 + q2)/2m (i.e. the average of the individual (maximum likelihood) rates q1/m and q2/m. We now calculate the probability (p value) p for an event that is as unlikely as (q1, q2, m) or, even more unlikely, for q1 < q2. This results in the following.
 |
This hypothesis test allows us to estimate the significance more accurately than calculating only the expectation values q1/m, q2/m, and corresponding S.E. bars and checking how far the expectation values differ in terms of the error bars. For the above values, q1 = 11, q2 = 26, m = 138, we obtain r ≈ 0.134, which results in a p value of p ≈ 0.0015. Hence, on a 99% significance level, the event in which the SOC shows in 26 cases a higher expression level and the brain shows higher expression only in 11 cases is significant.
The calculation of whether genes were significantly enriched in specific gene subsets was performed as follows. We first calculated the enrichment log odds ratio (LR), which is the log of how much the data set frequency q/k outperforms the microarray frequency m/t. Second, we calculated the p value as the probability that when choosing q out of t genes (where m out of these t genes are associated with the term of interest), one finds by pure chance q or more (up to m) among them that exhibit the term of interest. This was readily obtained from the hypergeometric distribution,
 |
and
 |
where q is the count of oligos associated with hearing impairment, m the count of oligos associated with hearing impairment on the microarray platform, k the total number of oligos in the gene lists, and t the total number of oligos on the microarray platform.
To map rat genes to human deafness loci, the genetic flanking markers of all human loci implicated in hearing impairment were manually collected from the hereditary hearing loss database and the literature. The genomic positions of the flanking genetic markers were extracted from the human genome assembly raw files GRCH37/hg19. Genes located in these deafness loci were retrieved using BioMart (23). To identify which genes mapped to human deafness loci, human orthologues of those genes enriched in the SOC were identified using EnsemblCompara (24) and compared with the list of genes located in deafness loci.
The most probable hypothesis is that only one gene in each deafness locus is the true causative gene. On this basis, we thought of testing whether the covering of human deafness loci by the gene sets revealed by our analysis was greater than random. To achieve this, we randomly picked n genes in the 18,489 genes covered by the Agilent microarray, retrieved their human orthologues, and counted the number of deafness loci covered by at least one orthologue (n corresponds to the number of R. norvegicus genes of the data set of interest). By repeating this operation 100,000 times, we generated an empirical distribution of the null hypothesis that we used to estimate a p value. Enrichments in gene ontology terms and KEGG pathways were analyzed using DAVID, applying the classification stringency “high” (25).
Quantitative RT-PCR
For quantitative real-time PCR (qRT-PCR) experiments, three independent RNA pools were used for each tissue. One pool consisted of the same RNA samples as used for the hybridizations. The other two pools represented biological replicas, which were derived from 6–16 animals. For each pool, 2,250 ng of total RNA were reverse transcribed using 200 ng of random hexamers, 500 ng of (dT)18 primers, and 1 μl (200 units) of Superscript II (Invitrogen) (26). For each tissue, all the three RNA pools were analyzed in triplicates. Most primer pairs were designed to amplify at least parts of the spotted 60-mer sequences. Primer sequences are available from the authors upon request. Primer efficiency (E) was determined by measuring serial dilutions of cDNA in triplicate. Efficiency was calculated according to the equation, E = 10(−1/slope) (27). 3-Phosphoglyceraldehyde (Gapdh) (28) served as reference gene in all experiments. Quantitative RT-PCR was performed on a MyiQ Thermal Cycler (Bio-Rad). Reactions contained 1 μl of cDNA template, 0.5 μl of 20 pm forward and reverse primer, 5.5 μl of RNase-free water, and 12.5 μl of Master Mix (Absolute SYBR Green Fluorescein, Thermo Scientific, Schwerte, Germany). Cycling conditions were as follows: 15-min 95 °C activation, 45 cycles at 95 °C, 30-s denaturation; 56 °C 30-s annealing; 72 °C 30-s extension. At the end, an additional extension step followed (72 °C for 5 min), and a melt curve analysis was performed (stepwise temperature rise of 0.5 °C, starting at 55 °C, ending at 95 °C, each step for 30 s). Statistical analyses and the calculation of the -fold change ratio (fc) in the triplicate experiments (μ) have been described previously (17). Semiquantitative RT-PCR was performed using standard procedures with 28 cycles.
RNA in Situ Hybridization
RNA in situ probes were generated by reverse transcription-PCR. Primer sequences are available from the authors upon request. PCR products were ligated to either a T7 or an Sp6 promoter containing linker or were cloned into a pGEM-T easy vector (Promega, Mannheim, Germany) and transcribed by T7 or Sp6 polymerases in the presence of digoxigenin-11-UTP (Roche Applied Science). Coronal sections of 30-μm thickness were cut in a microtome (Microm, HM 400, Waldorf, Germany) and collected in 2× saline sodium citrate buffer (SSC) (20× SSC: 3 m NaCl, 300 mm Na3C6H5O7). After a 10-min wash in 2× SSC mixed 1:1 with prehybridization buffer (50% formamide, 4× SSC, 2% blocker (Roche Applied Science), 0.02% SDS, 0.1% N-laurylsarcosine), sections were stored in prehybridization buffer at −20 °C until use. Free floating section hybridization was performed at 48–50 °C overnight (29), and bound probes were detected with an anti-digoxigenin antibody conjugated to alkaline phosphatase (Roche Applied Science). Sp6 (sense) probes and a T7 antisense probe against Cre recombinase, which is not encoded in the wild-type animals used for these studies, served as negative controls.
Immunohistochemistry
Animals were deeply anesthetized with 7% chloral hydrate (1 ml/100 g body weight) and perfused transcardially with phosphate-buffered saline (PBS) containing 130 mm NaCl, 7 mm Na2HPO4, 3 mm NaH2PO4, pH 7.4, followed by fixation solution containing 4% paraformaldehyde and 15% picric acid in 0.1 m phosphate buffer, pH 7.4 (30). Thereafter, the brain was removed from the skull and incubated overnight with agitation in 30% sucrose plus PBS. Coronal brainstem sections of 35-μm thickness were prepared using a microtome (Microm, HM 400), collected in 15% sucrose plus PBS, and thoroughly rinsed three times in PBS (each for 10 min). Sections were incubated for 1 h at 7 °C in blocking solution (containing 2% bovine serum albumin, 11% goat serum, and 0.3% Triton X-100 in PBS-buffered saline, pH 7.4). Rabbit anti-crystallin-γ antibody was kindly provided by Dr. Samuel Zigler (Wilmer Eye Institute, The Johns Hopkins University School of Medicine, Baltimore, MD) (31). This antibody was diluted 1:200 with carrier solution containing 1% bovine serum albumin, 1% goat serum, and 0.3% Triton X-100 in PBS-buffered saline, pH 7.4. Sections were incubated overnight with agitation at 7 °C. They were then rinsed three times in PBS (each for 10 min), again transferred into carrier solution, and treated with the secondary antibody, goat anti-rabbit conjugated to Alexa Fluor 488 (diluted 1:1000; Invitrogen). After a 2-h incubation with agitation at room temperature, the slices were rinsed three times in PBS and mounted on glass slides, air-dried, and placed on a coverslip with mounting medium containing 0.25% (w/v) DABCO (anti-fading reagent). Confocal images of SOC nuclei were taken at identical exposure times with a laser-scanning microscope (LSM510, Zeiss, Oberkochen, Germany). Data were obtained and processed using Adobe Photoshop 7.0 software (Adobe Systems).
RESULTS
The SOC develops through a series of cellular and morphological events (2). To characterize the molecular underpinnings, microarrays were employed to profile developmental changes in gene expression during the first 25 postnatal days. We used two prehearing stages (P0 and P4) and two posthearing stages (P16 and P25), which relate to the time before and after hearing onset, respectively. This time window encompasses the major postnatal developmental changes of SOC neurons (Fig. 1A). In addition, gene expression in the entire brain was profiled at P4 and P25. Data are accessible at the Gene Expression Omnibus public repository under accession number GSE16764.
FIGURE 1.
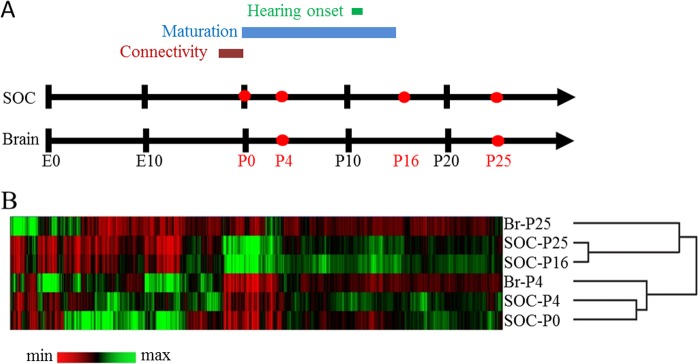
Hierarchical cluster analysis of the genome-wide expression patterns in the SOC and the entire brain. A, ontogeny of the rat SOC. Establishment of connectivity is completed by birth (P0), but pups are unable to hear until about P12. Functional and structural maturation of auditory circuits (e.g. synaptic refinement) takes place mainly during the first and second postnatal weeks. B, each row represents a distinct stage/tissue; each column represents a single oligo. Oligos are clustered according to the similarity of their normalized expression profiles. Color maps indicate a gene's expression level relative to the overall mean intensity of all investigated stages/tissues. Black, equal expression; green, higher expression; red, lower expression. The strongest similarity was observed between SOC-P16 and SOC-P25, and between SOC-P0 and SOC-P4. Most differences in expression levels occurred between pre- and posthearing stages. Br-P4 clustered together with prehearing SOC stages, whereas the mature age-matched stages showed a low degree of similarity, consistent with increasing specification during development.
Statistical Analysis of Gene Expression Profiles in the SOC
Scatter plot analysis revealed considerable differences in gene expression between P0 and P4 and when comparing the two stages before hearing onset (P0 and P4) with the two stages after hearing onset (P16 and P25) (Table 1) (data not shown). In order to be considered differentially expressed, two criteria had to be fulfilled: a more than 2-fold change ratio and a p value below 0.05. The number of differentially expressed sequences between consecutive stages was highest between P4 and P16 (1,465 sequences, ∼3.6%). Considerable changes were also observed between P0 and P4 (510 sequences, ∼1.2%) (Table 1). The number collapsed between P16 and P25 because only 24 differentially expressed oligos (∼0.06%) were identified (Table 1). A similar drop in differentially expressed genes during postnatal development could also be observed in microarray data obtained for the cochlear nucleus complex, another auditory brainstem structure. In this tissue, 6.2% of 22,690 oligos were differentially expressed between P7 and P14, and 0.13% were differentially expressed between P14 and P21, using criteria similar to ours (p ≤ 0.05 and fc of ≥1.8) (32). Comparing all stages in the SOC, the largest number of differentially expressed oligos was observed between P0 and P25 (5,373 oligos, ∼13.1%) (Table 1).
TABLE 1.
Number of differentially expressed transcripts between two data sets (fc > 2; p < 0.05, Kruskal-Wallis test) (SOC development)
| 1 ↔ 2 | Number of transcripts | 1 < 2 | 2 < 1 |
|---|---|---|---|
| SOC-P0 ↔ SOC-P4 | 510 | 341 | 169 |
| SOC-P0 ↔ SOC-P16 | 4,437 | 2,242 | 2,195 |
| SOC-P0 ↔ SOC-P25 | 5,373 | 1,910 | 3,463 |
| SOC-P4 ↔ SOC-P16 | 1,465 | 968 | 497 |
| SOC-P4 ↔ SOC-P25 | 2,609 | 956 | 1,653 |
| SOC-P16 ↔ SOC-P25 | 24 | 3 | 21 |
A closer mutual relationship between the prehearing stages on one side and the posthearing stages on the other side was also suggested by a hierarchical cluster analysis, in which P0 was grouped with P4, and P16 was grouped with P25 (Fig. 1B). Taken together, we observed extensive differences in gene expression before and around hearing onset but only minor changes thereafter.
Statistical Comparison between the Gene Expression Profiles of the SOC and the Entire Brain
To gain insight into SOC-related genetic programs, we next determined the gene expression profiles of the brain at P4 (Br-P4) and P25 (Br-P25) and compared them with the age-matched SOC tissue using the Wilcoxon U test (Table 2). 1,790 oligos (4.4%) were differentially expressed at P4 between the SOC and the brain. By P25, this number had almost doubled to 3,107 oligos (7.6%). The increased molecular specialization of the SOC during postnatal development was also revealed by hierarchical cluster analysis, in which the Br-P4 was more closely related to the prehearing SOC samples than was the Br-P25 to the posthearing SOC samples (Fig. 1B).
TABLE 2.
Number of differentially expressed transcripts between two data sets (fc > 2; p < 0.05, Wilcoxon test)
| 1 ↔ 2 | Number of transcripts | 1 < 2 | 2 < 1 |
|---|---|---|---|
| SOC development | |||
| SOC-P4 ↔ SOC-P25 | 3,096 | 1,319 | 1,777 |
| Brain development | |||
| WB-P4a ↔ WB-P25 | 2,698 | 1,072 | 1,626 |
| Age-matched comparison | |||
| SOC-P4 ↔ WB-P4 | 1,790 | 878 | 912 |
| SOC-P25 ↔ WB-P25 | 3,107 | 1,498 | 1,609 |
a WB, whole brain.
453 oligos were more highly expressed in the SOC at both stages than in the total brain and may hence represent a transcriptional signature of the postnatal SOC. Among the 10 top-ranked genes were Slc6a5, encoding the glycine transporter 2; Kcna1, encoding Kv1.1; and Kcnk15, encoding Task5 (Table 3). All three proteins have previously been linked to the SOC (33–35). Therefore, the other genes may also play an important role in the SOC. To see if the transcriptional signature of SOC was reflecting functional specificities, the larger functional significance of this SOC signature, we performed a Gene Ontology (GO) enrichment analysis (25). The most enriched biological processes among the 453 transcripts were “regulation of action potential” (p < 10−8), “ion homeostasis” (p < 10−6), and “insoluble fraction” (p < 10−4). These results are in agreement with the known electrophysiological specializations of the auditory brainstem, such as a high firing rate (36). In the following, the term “SOC-related gene expression” will denote higher expression in the SOC than in the entire brain. This, however, does not preclude high expression in other brain areas.
TABLE 3.
Top 10 oligos that are specifically more highly expressed in the SOC as compared with the brain at P4 and P25
| Gene symbol | Gene name | Accession number | P4 (SOC/Br) | P4 p value | P25 (SOC/Br) | P25 p value |
|---|---|---|---|---|---|---|
| Slc6a5 | Solute carrier family 6 (neurotransmitter transporter, glycine), member 5 | NM_203334 | 14.98 | 0.0022 | 19.43 | 0.0004 |
| Spp1 | Secreted phosphoprotein 1 | NM_012881 | 3.21 | 0 | 11.57 | 0 |
| Gcgr | Glucagon receptor | NM_172091 | 2.88 | 0.0022 | 11.34 | 0.0004 |
| Apod | Apolipoprotein D | NM_012777 | 2.77 | 0.0022 | 11.01 | 0.0004 |
| Ugt8a | UDP galactosyltransferase 8A | NM_019276 | 2.69 | 0.0022 | 10.2 | 0.0004 |
| Trf | Transferrin | NM_001013110 | 2.49 | 0.0022 | 9.9 | 0.0004 |
| Neat1 | Nuclear paraspeckle assembly transcript 1 | AW143472 | 6.92 | 0.0022 | 9.17 | 0.0004 |
| Kcna1 | Potassium voltage-gated channel, shaker-related subfamily, member 1 | NM_173095 | 6.18 | 0.0022 | 8.66 | 0.0004 |
| Kcnk15 | Potassium channel, subfamily K, member 15 | NM_130813 | 2.05 | 0.0022 | 8.38 | 0.0004 |
| S100g | S100 calcium-binding protein G | NM_012521 | 4.35 | 0.0022 | 7.99 | 0.0004 |
Differential gene expression is brought about by distinct sets of TFs. BLAST-based analysis matched 2,020 oligos found in our microarray study to a comprehensive murine gene set of 1,578 TFs (21). Among them, 11 TFs were identified within the 453 SOC-related oligos: the zinc finger TFs Peg3 and Gata3; the homeobox TFs Phox2a, Dbx2, Nkx6–2, Hoxa2, and Pbx3; the leucine zipper TF Mitf; the helix-loop-helix TFs Olig1 and estrogen-related receptor Esrrb; and the SRY-related HMG-box family member Sox10. Notably, five of them, Esrrb (37), Gata3 (38), Hoxa2 (39), Mitf (40), and Sox10 (41), have been associated with deafness. None of their transcriptional targets was enriched in the gene set, as revealed by bioinformatic approaches. This may be due to (i) the imprecision of the existing transcriptional networks, (ii) the complexity of TF-DNA binding (42), and (iii) the fact that many TFs act as heteromers (43).
Validation of Microarray Data by qRT-PCR and RNA in Situ Hybridization
To assess the quality of our microarray data, qRT-PCR was performed for 15 genes (Crym, Dock6, Gpc2, Gsta3, Gjb1, Hap1, Hcn2, Kcnk15, Pnlip, Ppp1r14c, Pvalb, Scrg1, Slc1a6, Slc5a11, and Spint2) (Fig. 2A) (data not shown). These genes were chosen to cover various significance patterns. Regardless of the expression profiles, the microarray and the qRT-PCR data correlated strongly. All comparisons with a >2-fold expression change in the microarray data showed also a significant, >2-fold change in the qRT-PCR experiments. A few highly regulated genes showed an even greater magnitude of expression changes in the qRT-PCR data, in accordance with previous reports of signal saturation in microarray. In cases with opposite changes of direction between microarray and qRT-PCR, changes were <2-fold in both types of experiments and thus considered as not significant. The independent confirmation of the microarray results by qRT-PCR indicated that the microarray data accurately reflected biological differences.
FIGURE 2.

Validation of microarray data by qRT-PCR and RNA in situ hybridization. A, relative expression level changes of selected genes were examined by qRT-PCR to verify the microarray results. Consecutive developmental stages of the SOC were investigated. Black dashed lines, microarray data; gray dashed lines, qRT-PCR data of three biological replicates. Data sets were normalized to P0 = 1. *, p < 0.05; **, p < 0.01; ***, p < 0.001. Collectively, data sets from microarray experiments correlated strongly with those from qRT-PCR experiments. B, RNA in situ hybridization of coronal sections through the rat brainstem at P25–P30. Sections were hybridized with digoxigenin-labeled cRNA probe. Calb1 served as a positive control, and a sense probe served as negative control. All probes except for Calb1 hybridized throughout the SOC. The MNTB is always at the left-hand side, whereas the lateral superior olive is on the right-hand side. For orientation, a schema of the adult rat SOC is provided in the bottom right-hand corner. Shown are representative results from at least three independent hybridization experiments. LSO, lateral superior olive; LNTB, lateral nucleus of the trapezoid body; MSO, medial superior olive; SPN, superior paraolivary nucleus; VNTB, ventral nucleus of the trapezoid body. Scale bars (B), 200 μm.
The SOC is a composite structure. Our data, therefore, describe changes in gene expression across a heterogeneous neuronal population. To gain a cellular view of the transcriptional program of the developing SOC, RNA in situ hybridizations were carried out. In a first series of experiments, 16 probes were selected to cover (i) different functional protein classes, such as plasma membrane proteins (Adora1, Il4r, Kcnh2, Lphn3, Slc22a7, and Tmem9b), TF (Deaf1, Foxn3, and Zfyve27), enzymes (Cdc37, Cdk16, and Stk40), and others (Calb1, Carhsp1, Egln3, Lin7b); (ii) different expression level ranges; and (iii) several regulation patterns.
Because our microarray study revealed increased molecular specialization during development, we focused on P25–P30. 15 probes tested revealed a rather widespread expression in the rat SOC at P25–P30 (Fig. 2B) (data not shown). Only Calb1, which was previously reported to be specifically expressed in the mature MNTB (44), gave exclusive labeling in this nucleus (Fig. 2B). We next analyzed five genes (Atp1a, Arhgef7, Cacna1c, Hap1, and Wnk4) both at P3–P4 and P25–P30. Again, all transcripts were expressed in the SOC, but no nucleus-specific expression was observed (data not shown).
Finally, we chose 11 probes covering SOC-related genes that arose during our various statistical analyses (see below). This set included the TFs Hoxd1, Meis2, and Phox2a; the plasma membrane proteins Gpr37, Kcnab3, Kcns3, and Scn1a; the deafness genes Esrrb, Myh14, and Tjp2; and Tph2, involved in serotonin signaling. These probes were hybridized on mouse tissue because this genetically amenable animal model is increasingly used to probe gene functions in the auditory brainstem (45–47). All probes were expressed in the SOC, but again, no striking differences were observed between the different nuclei (Fig. 3). Instead, it appeared that they labeled subsets of neurons in some instances in a given nucleus, such as Hoxd1 and Kcnab3, in the superior paraolivary nucleus. These data validated our microarray results and indicated that the nuclei of the mammalian SOC have similar expression patterns for many genes.
FIGURE 3.
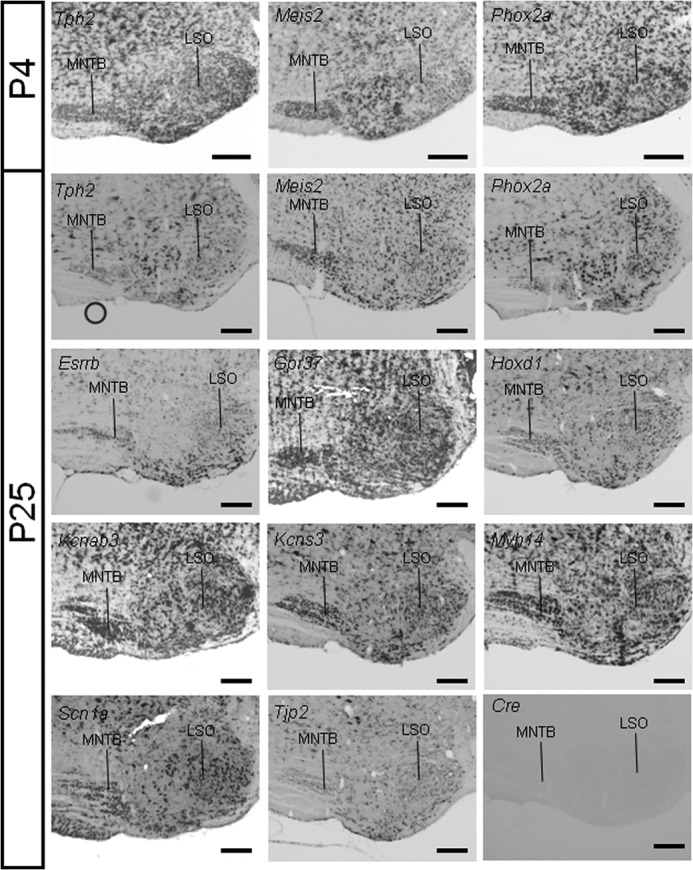
RNA in situ hybridization of SOC-related genes. RNA in situ hybridization of coronal sections through the mouse brainstem of P4 or P25 animals. Sections were hybridized with digoxigenin-labeled cRNA probes. All probes hybridized throughout the SOC. As a negative control, hybridization of a Cre-recombinase antisense probe is shown. Representative results from at least three independent hybridization experiments are shown. LSO, lateral superior olive. Scale bars, 200 μm.
SOC-related Genetic Program before Hearing Onset
To obtain information about the genetic program that most likely forms the basis of the developmental processes that take place during the prehearing period (e.g. circuit organization), we further analyzed the 1,777 oligos that were up-regulated in SOC-P4 compared with SOC-P25 (Table 2). All 10 top-ranked up-regulated oligos encode proteins involved in neuronal differentiation and circuit formation (Table 4). We next searched for genes that, in addition to being up-regulated at P4 (SOC-P4 ↔ SOC-P25), were also up-regulated compared with Br-P4. This led to the identification of 109 oligos of the 1,777 (6.1%). Among these 109 oligos, the GO terms “neurotransmitter transporter activity” and “cell projection morphogenesis” were most significantly enriched (p = 4.4 × 10⁻³ and 1.6 × 10⁻², respectively).
TABLE 4.
Top 10 up-regulated oligos at SOC-P4 as compared with SOC-P25
| Gene symbol | Gene name | Accession number | SOC-P4/SOC-P25 | p value |
|---|---|---|---|---|
| Crygn | Crystallin, gamma N (predicted) | NM_001106573 | 13.49 | 0.0002 |
| C1orf187 | Draxin | TC602650 | 11.35 | 0.0002 |
| Dpysl3 | Dihydropyrimidinase-like 3 | NM_012934 | 11.15 | 0.0002 |
| Pcdh21 | Protocadherin 21 | NM_053572 | 11.1 | 0.0002 |
| Dpysl3 | Dihydropyrimidinase-like 3 | BF549419 | 10.95 | 0.0002 |
| Dcx | Doublecortin | NM_053379 | 10.35 | 0.0002 |
| SOX11 | SRY-box-containing gene 11 | BF554576 | 10.26 | 0.0002 |
| Dpysl3 | Dihydropyrimidinase-like 3 | BG665445 | 10.16 | 0.0002 |
| Mpz | Myelin protein zero | NM_017027 | 10.09 | 0.006 |
| Cntn5 | Contactin 5 | TC611331 | 9.89 | 0.0002 |
Further analyses of proteins participating in neuronal differentiation and circuit formation in the 109 SOC-related oligos revealed three prominent groups. The most salient functional category encompassed TFs. Ten genes were significantly more highly expressed in the SOC-P4 than in Br-P4. They comprised the homeobox genes Nkx6–1, Onecut1, Meis2, Irx2, Hoxa2, and the non-homeobox transcription factors Mab21l2, Mafb/Kreisler, Etv4, Zfpm2, and Znf503 (Fig. 4, A–J). A second salient family consisted of the three crystallin-γ genes Crygn, Cryge, and Crygd (Fig. 4, K–M), which represent a novel class of neurite-promoting factors (31). Finally, three genes were found that are involved in serotonin signaling (48): tryptophan hydroxylase 2 (Tph2), serotonin transporter Sert (Slc6a4), and GTP cyclohydrolase I feedback regulator (Gchfr) (Fig. 4, N–P). These data point to the importance of a novel group of neurite-promoting factors and serotonin signaling in SOC circuit organization.
FIGURE 4.

Expression profiles of genes that are highly expressed prior to hearing onset and display elevated expression in SOC-P4 compared with Br-P4. A–J, transcription factors; K–M, crystallin-γ subunits; N–P, serotonin signaling. Expression profiles are shown as dashed lines, and mean expression levels are normalized to SOC-P4 = 1. Dark gray, SOC development; light gray, brain development; black insets, comparison of age-matched SOC and brain at P4 and P25. *, p < 0.05; **, p < 0.01; ***, p < 0.001. Error bars, S.E.
To exemplarily validate these data, we performed immunohistochemistry and applied an antibody that detects crystallin-γ proteins (31). Strong labeling occurred in the SOC at P5 (Fig. 5A), whereas low labeling was seen at P25 (Fig. 5D). Thus, the decline in immunoreactivity for crystallin-γ was consistent with the microarray results. At the cellular level, labeling was present mainly in auditory fiber tracts (Fig. 5, B and E), such as the trapezoid body and the ventral acoustic stria (Fig. 5, A and D). The neuropil of most SOC nuclei was also labeled with perisomatic signals surrounding immunonegative cell bodies (Fig. 5, B, C, F, and G). Only a few somata were labeled in the prehearing condition, but nearly all somata of the mature MNTB were labeled, albeit with a rather low signal intensity.
FIGURE 5.
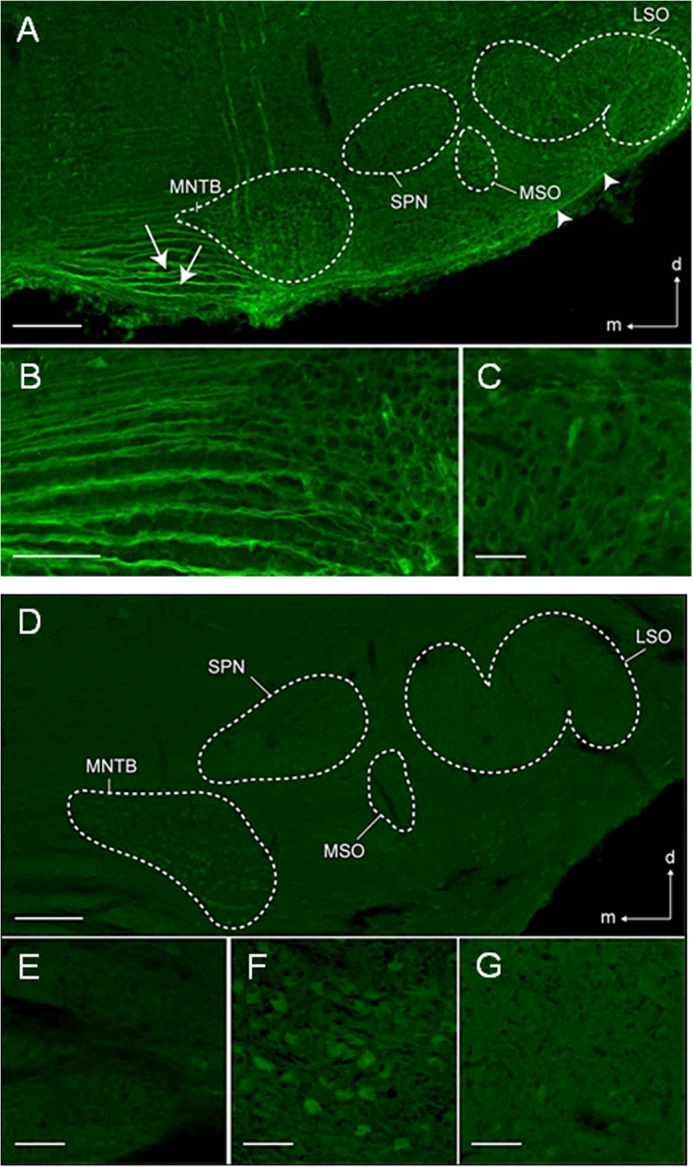
Crystallin-γ in the SOC. A, low magnification photomicrograph of the SOC-P5, demonstrating crystalline-γ immunoreactivity in the lateral superior olive (LSO), the medial superior olive (MSO), and the MNTB. Fibers in the ventral acoustic stria (arrowheads) and the trapezoid body medial to the MNTB (arrows) were also immunoreactive. B, high magnification photomicrograph of the trapezoid body, demonstrating the fascicular labeling pattern in fibers. C, lateral superior olive at higher magnification, with perisomatic labeling around spindle-shaped somata (most probably principal neurons). D, crystallin-γ in the SOC-P25. Compared with P5, immunoreactivity was lower throughout the SOC. E, high magnification photomicrograph of the trapezoid body medial to the MNTB, demonstrating fewer immunopositive fibers than at P5. F, MNTB at high magnification, demonstrating weakly immunopositive somata. G, lateral superior olive at high magnification, with a labeling pattern similar to that of P5. Dorsal is up and medial to the left in all panels. Scale bars, 200 μm (A), 250 μm (D), and 30 μm (B, C, and E–G).
Hearing Onset and the Underlying Changes in Gene Expression
We next analyzed those 1,319 oligos that were up-regulated between SOC-P4 and SOC-P25 with respect to their potential contribution to the molecular maturation of the SOC. Nine of the 10 top-ranked up-regulated oligos encode proteins important for myelination (Tmem10, Mobp, Hapln2, Trf, Mal, Mog, and Mobp); the remainder was derived from the Apod gene, encoding an antioxidant stress protein (Table 5).
TABLE 5.
Top 10 up-regulated oligos at SOC-P25 as compared with SOC-P4
| Gene symbol | Gene name | Accession number | SOC-P25/SOC-P4 | p value |
|---|---|---|---|---|
| Tmem10 | Transmembrane protein 10 | NM_001017386 | 135.07 | 0.0002 |
| Mobp | Myelin-associated oligodendrocytic basic protein | X89638 | 88.9 | 0.0002 |
| Hapln2 | Hyaluronan and proteoglycan link protein 2 | NM_022285 | 69.72 | 0.0002 |
| Trf | Transferrin | NM_001013110 | 65.99 | 0.0002 |
| Hapln2 | Hyaluronan and proteoglycan link protein 2 | NM_022285 | 62.47 | 0.0002 |
| Mal | Myelin and lymphocyte protein, T-cell differentiation protein | NM_012798 | 52.15 | 0.0002 |
| Mog | Myelin oligodendrocyte glycoprotein | NM_022668 | 47.25 | 0.0002 |
| Apod | Apolipoprotein D | NM_012777 | 46.72 | 0.0002 |
| Mog | Myelin oligodendrocyte glycoprotein | TC605393 | 31.14 | 0.0002 |
| Mobp | Myelin-associated oligodendrocytic basic protein | NM_012720 | 30.96 | 0.0002 |
Among the 1,319 oligos, 656 (49.7%) were also significantly more highly expressed in the SOC-P25 compared with the Br-P25. The most significantly enriched GO terms in these 656 transcripts were “regulation of action potential” (p < 10−10), followed by “cellular ion homeostasis” (p < 10−6). This prompted us to investigate more closely several selected categories of proteins that might participate in these neuronal processes. These functional categories were genes for K+ channels, Ca2+ channels, Na+ channels, neurotransmitter receptors and transporters, G-protein-coupled receptors, and myelination (Fig. 6). We focused within these categories on those genes that were differentially expressed between SOC-P25 and SOC-P4 and between SOC-P25 and Br-P25. This analysis revealed a striking SOC-related up- and down-regulation of genes in all six categories. The expression levels of all but one developmentally up-regulated gene in the mature SOC exceeded that of Br-P25 (Fig. 6, green triangles). The only exception was Grin2c (Fig. 6). The SOC-specific up-regulation was complemented by an SOC-related down-regulation of several genes. All of these genes showed reduced expression levels compared with the age-matched Br-P25 as well (Fig. 6, red triangles). Notably, all developmentally regulated voltage-gated Ca2+ channels were down-regulated. This indicates an important role of these channels in the perinatal period, which is in accord with the recent observation of the requirement of Cav1.3 for proper development and refinement of auditory circuits (12, 46, 49).
FIGURE 6.

Expression profiles of selected gene categories with significantly differential regulation between pre- and posthearing stages. Oligos with significant differences in expression between the SOC and the age-matched brain are marked by triangles (green, higher expression in the SOC; red, lower expression in the SOC). The blue horizontal plane depicts the border between developmentally up- and down-regulated oligos. Shown are the mean expression values, normalized to P0 = 1.
The very low number of merely 24 oligos in the SOC with differential expression between P16 and P25 (Table 1) demonstrates rapid maturation of the SOC after hearing onset and not much dynamics after P16. Only three genes (Hbb, GloA, and Hbb-B1) were up-regulated beyond P16; they all encode globin genes. In the 21 down-regulated genes, the KEGG pathway “focal adhesion” was the only significant hit (p = 0.03).
SOC-related Genetic Programs and Hearing Impairment
During our analyses, we noticed that several genes in SOC-related genetic programs were associated with peripheral hearing impairment. To investigate the contribution of transcripts associated with hearing impairment (TAHI) to the genetic program of the SOC in more detail, we compiled a list of genes associated with hearing impairment from public databases and the literature. The large majority of these genes is associated with dysfunction in the ear (50–52). 138 oligos (0.34%) from the microarray matched to TAHI. 26 oligos, derived from 22 different genes, were significantly up-regulated in the SOC in at least one pairwise comparison with the brain (Fig. 7, A and B). Only 11 TAHI (Atp2B2, Cacna1d, Cisd2, Coch, Col1a2, Crym, Gjb2, Gjb6, Hspa1a, SLc26a4, and WFS1) displayed a higher expression in the brain. Applying a maximum likelihood argument, the difference between 26 oligos in the SOC subsets and 11 oligos in the brain subsets was significant (p = 0.0015, maximum likelihood). Furthermore, in all three SOC up-regulated subsets, the number of TAHI was significantly enriched (Fig. 7C). 16 TAHI were identified within the 912 P4 SOC transcripts (p = 8.4 × 10⁻⁸), 17 within the 1,609 P25 SOC transcripts (p = 3.1 × 10⁻⁵), and seven within the 453 transcripts from SOC ↔ brain (p = 9.0 × 10⁻⁴). These seven transcripts were Ednrb, Esrrb, Gata3, Hoxa2, Mitf, Sox10, and Ucn. In the brain, only the 10 TAHI (Atp2B2, Cacna1d, Cisd2, Coch, Col1a2, Crym, Gjb2, Hspa1a, SLc26a4, and WFS1) in the Br-P25 subset represented a significant enrichment (p = 0.03).
FIGURE 7.
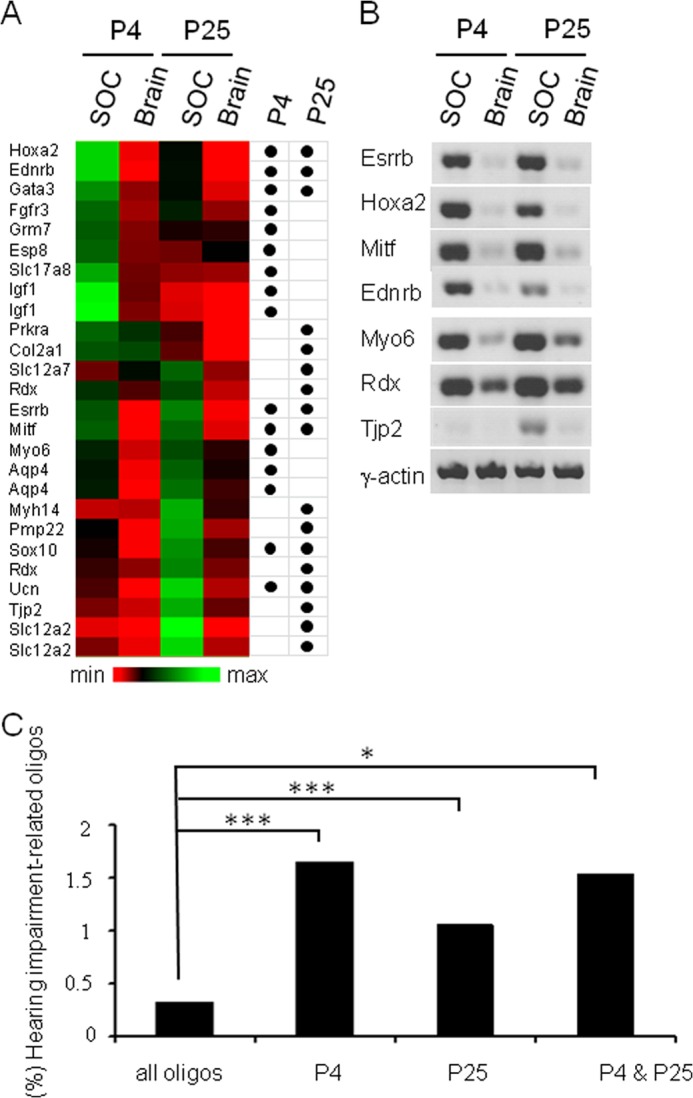
Significant enrichment of TAHI in SOC-related gene signatures. A, heat map of 26 TAHI, which are more highly expressed in the SOC than in the age-matched brain at P4 or P25. Oligos were clustered according to the similarity of their normalized expression profiles. Colors indicate the expression level relative to the overall mean intensity (black) of all investigated stages/tissues. Black dots mark statistically significant up-regulation in the SOC (Wilcoxon U test, fc > 2, p < 0.05). B, confirmation of seven up-regulated transcripts in the SOC (cf. A) by semiquantitative RT-PCR (actin as a loading control). Similar results were obtained in at least two independent experiments. C, significant enrichment of oligos associated with hearing impairment in SOC-related genetic programs. Database searches linked 138 oligos of a total of 41,012 (0.34%) to hearing impairment. Of these 138 oligos, 16 (1.75%) were part of the 912 oligos up-regulated in SOC-P4 ↔ Br-P4, 17 (1.06%) were part of the 1,609 oligos up-regulated in the SOC-P25 ↔ Br-P25, and 7 (1.61%) were up-regulated in the SOC at both stages. The enrichment of TAHI was significant for all three SOC samples. **, p < 0.01; ***, p < 0.001.
To investigate the possible participation of SOC-related genes in human heritable hearing impairment, we performed an in silico mapping analysis. We compiled lists of human genes located in 47 loci associated with heritable hearing impairment and unknown etiology. Next, we retrieved the human orthologues of the SOC-related subsets in the three signature lists and mapped them to the 47 loci. For P4, 65 orthologues were mapped to 24 deafness loci (p = 0.32). For P25 SOC ↔ brain and SOC ↔ brain, the relevant numbers were 97 orthologues to 31 deafness loci and 29 orthologues to 19 loci, respectively (p = 0.13 and p = 0.057) (Table 6). Albeit none of these scores reached significance, they point to a higher than random coverage of deafness loci by SOC-related genes. This was especially true for the 453 oligos from the SOC ↔ brain signature list with a p value close to significance. Hence, this data set will be useful to narrow down candidate genes in loci for hearing impairment.
TABLE 6.
Mapping of SOC-related genes to human genetic loci associated with hearing impairment
| Comparison | Oligos | Rat genes | Human orthologues | Orthologues located in a deafness locus | Deafness loci covered | p value |
|---|---|---|---|---|---|---|
| P4 SOC ↔ brain | 912 | 452 | 430 | 65 | 24 | 0.3182 |
| P25 SOC ↔ brain | 1,609 | 817 | 770 | 97 | 31 | 0.12937 |
| SOC ↔ brain | 453 | 209 | 196 | 29 | 19 | 0.05676 |
| All mapped oligos | 22,150 | 18,489 | 14,790 | 2,427 | 39 | NAa |
a NA, not applicable.
DISCUSSION
The aim of this comparative time course study was to gain insight into the genetic program underlying the postnatal maturation of the SOC. Chief among our findings were the observed enrichment of genes associated with hearing impairment in the SOC and the identification of novel strong candidate genes, such as crystallin-γ genes, for SOC development and function.
Study Design and Caveats
To illuminate candidate molecules for distinct phases of SOC development, we investigated the temporal changes in gene expression profiles. To pinpoint genes important for SOC maturation and function, we also compared the SOC data with those of the entire brain. The rationale of such a comparison is a similar developmental time scale between the SOC and most other brain circuits. The peak of myelination at P18 (53) suggests a similar temporal development of many circuits in the rat brain. Furthermore, a transcriptome analysis of the frontal cortex, hypothalamus, and hippocampus revealed only minor changes in gene expression after P14 (54). This indicates a rapid postnatal maturation of many brain circuits, similar to our observation in the SOC.
Retrocochlear Role of Genes Associated with Hearing Impairment
A clinically important finding of our study is the participation of genes implicated in hearing impairment in the genetic program of the SOC (Fig. 7). It implies a retrochochlear function of these genes, which have mainly been considered to compromise peripheral auditory function. Indeed, we recently showed an essential retrocochlear function of the peripheral deafness gene Cacna1d, encoding Cav1.3 (46). Strikingly, four SOC-related genes associated with hearing impairment already have a proven role in proper development and function of central auditory structures. Hoxa2 is essential for CNC development and correct projections to the SOC (55, 56), Gata3 and Unc are required for correct function of olivocochlear neurons (57, 58), and Slc17a8 is essential for refining the MNTB-lateral superior olive projection (11). A dual role in the auditory system was also established for the TF Atoh1, which is essential for hair cell development (59) and proper maturation and function of the SOC (45). These experimental data demonstrate that mutations in genes associated with hearing impairment can affect sensory and neuronal cells alike. The resulting diversity in central auditory deficits will contribute to the observed variation in the benefit that hearing devices, such as cochlear implants, can provide (52, 60). Deciphering these retrocochlear deficits will probably result in better tailored therapies and improved auditory rehabilitation.
Our SOC-related signature lists may also provide an important resource to gain insight into genetic causes of auditory processing disorders. These disorders are characterized by impaired sound processing in the central auditory system in the absence of considerable peripheral hearing loss, thus resulting in perceptual dysfunction (61, 62). Currently, the underlying molecular causes are unknown.
Circuit Organization
Among the SOC-related genes in the prehearing period were three crystallin-γ. These proteins promote axon regeneration of injured optic nerve fibers (31). Consistent with this, the related crystallin-β subunit b2 accumulates in axons and growth cones of retinal ganglion cells (63). Our immunohistochemical analysis, which demonstrated the presence of crystallin-γ proteins in fiber tracts and the neuropil of the SOC (Fig. 5), is in full agreement with these findings. The observed down-regulation of crystallins between P4 and P16 correlates well with the shift in auditory brainstem neurons from a state allowing axonal growth and reorganization to a state of largely fixed connectivity. Neurons of the anteroventral cochlear nucleus can establish novel projections to the SOC after unilateral cochlear removal only before P10 (64). In agreement, cultured MNTB neurons lose their capacity to regenerate connectivity to lateral superior olive neurons at a similar time point (65). The timing of their down-regulation, as well as their expression in the entire auditory brainstem, makes crystallin-γ proteins attractive candidates for this shift.
Also of note is the high expression of the serotonin-related genes Tph2, Slc6a4, and Gchfr in the prehearing SOC. Transiently high serotonin content in developing neurons is often observed in highly topographically organized sensory systems (66). Interestingly, deficits in serotonin-moderated synaptic signaling result in neurodevelopmental disorders, such as autism spectrum disorder (67), which is linked to altered processing of auditory information. Several studies revealed a malformed SOC with a decreased volume (68, 69) and altered auditory brainstem responses (70–72) in patients with autism. It will therefore be interesting to analyze in detail the role of serotonin in the developing brainstem.
Hearing Onset and the Underlying Genetic Program
The most remarkable physiological change during our time course study is the switch from the prehearing to the posthearing condition at around P12. Whereas the neuronal connectivity becomes implemented in the prehearing period, the hallmarks after P12 are secure and high temporal acuity in sound-induced neurotransmission and high neuronal activity. Our data provide a comprehensive quantitative and qualitative description of the underlying molecular changes. They extend, for instance, the repertoire of voltage-gated K+ channels, which play an important role in auditory neurons (73, 74). They furthermore hint at an important role of G-protein-coupled receptors, which so far have been poorly analyzed in the auditory system, despite their emerging importance (75). As an example, Gpr37 and Gpr37l1, encoded by two of the three highest up-regulated genes, were recently identified as receptors for the neuroprotective and glioprotective factor prosaposin (76).
Our study also emphasizes the importance of down regulation in sculpting mature SOC neurons. We observed various categories in which individual genes displayed SOC-related down-regulation. These included Ca2+, K+, and Na+ channels (Fig. 6). Their down-regulation (below the level in the entire brain) suggests that they are not only dispensable for mature SOC function but impair it. NaV1.2 channels make a good case for this hypothesis; they promote back-propagation of action potentials to the soma (77). This process is strongly reduced in medial superior olive neurons to optimize correct synaptic integration (78). The fact that half of the molecular specification in the mature SOC is caused by significant down-regulation compared with the entire brain (Table 2) underscores the importance of SOC-related down-regulation.
Coordinated Development of the Auditory System
The development of sensory pathways requires precise and coordinated orchestration. A striking example is provided by the visual system in Drosophila, where the same TFs promote the cell type-specific expression of sensory receptors and cell surface proteins that regulate target specificity (79). Intriguingly, several of the TFs that are up-regulated in the early postnatal SOC have established functions during development of auditory structures, such as Gata3 (57) and Mafb/Kreisler (80). They are essential for proper development of the inner ear, and Gata3 is additionally required for correct olivocochlear projections (57). Expression of Gata3 has also been reported in cochlear ganglion neurons (57), the lateral lemniscus, and the inferior colliculus (81), whereas Mafb/Kreisler is present in neurons of the ventral cochlear nucleus (82). Given these data, these TFs might provide a molecular mechanism for coordinated development of the auditory system. Finally, the intimate genetic relationship between the cochlea and the SOC supports the emerging hypothesis that the sensory cells and auditory brainstem nuclei arouse jointly by having recourse to common changes in genetic programs (83).
Taken together, our study provides the first comprehensive and quantitative molecular description of the developing SOC on the transcriptome level. We identified novel molecular pathways involved in circuit organization and function, and our catalogue represents a valuable tool to identify genes involved in normal and abnormal function of the auditory brainstem.
Acknowledgments
We thank Anja Feistner, Kornelia Ociepka, Jasmin Schröder, and Jennifer Winkelhoff for excellent technical support; Karsten Andresen (Institute of Biotechnology and Drug Research (IBWF), Kaiserslautern) for helpful discussions concerning data analysis; and members of the Kaiserslautern laboratory for comments during the course of this work. Samuel Zigler is gratefully acknowledged for providing the anti-crystallin antibody.
This work was supported by an A4 grant of the State Rhineland Palatinate within the Hochschulprogramm Wissen-Schafft-Zukunft, Deutsche Forschungsgemeinschaft Grant 428/5-1 (to H. G. N.), the Cluster of Excellence Hearing4all (H. G. N.), the Research Center (CM)2 of the University of Kaiserslautern, Israel Science Foundation Grant 1320/11, and I-CORE Gene Regulation in Complex Human Disease, Center 41/11 (to K. B. A.).
Gene expression data are accessible at the Gene Expression Omnibus public repository under accession number GSE16764.
- Pn
- postnatal day n
- SOC
- superior olivary complex
- MNTB
- medial nucleus of the trapezoid body
- TF
- transcription factor
- Br
- brain
- oligo
- oligonucleotide
- qRT-PCR
- quantitative RT-PCR
- TAHI
- transcripts associated with hearing impairment.
REFERENCES
- 1. Blatchley B. J., Cooper W. A., Coleman J. R. (1987) Development of auditory brainstem response to tone pip stimuli in the rat. Brain Res. 429, 75–84 [DOI] [PubMed] [Google Scholar]
- 2. Friauf E. (2004) Developmental changes and cellular plasticity in the superior olivary complex. in Plasticity of the Auditory System (Parks T. N., Rubel E. W., Fay R. R., Popper A. N., eds) pp. 49–95, Springer, New York [Google Scholar]
- 3. Kandler K., Clause A., Noh J. (2009) Tonotopic reorganization of developing auditory brainstem circuits. Nat. Neurosci. 12, 711–717 [DOI] [PMC free article] [PubMed] [Google Scholar]
- 4. Tallal P. (2012) Improving neural response to sound improves reading. Proc. Natl. Acad. Sci. U.S.A. 109, 16406–16407 [DOI] [PMC free article] [PubMed] [Google Scholar]
- 5. Friauf E., Kandler K. (1990) Auditory projections to the inferior colliculus of the rat are present by birth. Neurosci. Lett. 120, 58–61 [DOI] [PubMed] [Google Scholar]
- 6. Kandler K., Friauf E. (1993) Pre- and postnatal development of efferent connections of the cochlear nucleus in the rat. J. Comp. Neurol. 328, 161–184 [DOI] [PubMed] [Google Scholar]
- 7. Balakrishnan V., Becker M., Löhrke S., Nothwang H. G., Güresir E., Friauf E. (2003) Expression and function of chloride transporters during development of inhibitory neurotransmission in the auditory brainstem. J. Neurosci. 23, 4134–4145 [DOI] [PMC free article] [PubMed] [Google Scholar]
- 8. Blaesse P., Guillemin I., Schindler J., Schweizer M., Delpire E., Khiroug L., Friauf E., Nothwang H. G. (2006) Oligomerization of KCC2 correlates with development of inhibitory neurotransmission. J. Neurosci. 26, 10407–10419 [DOI] [PMC free article] [PubMed] [Google Scholar]
- 9. Sanes D. H., Siverls V. (1991) Development and specificity of inhibitory terminal arborizations in the central nervous system. J. Neurobiol. 22, 837–854 [DOI] [PubMed] [Google Scholar]
- 10. Rietzel H.-J., Friauf E. (1998) Neuron types in the rat lateral superior olive and developmental changes in the complexity of their dendritic arbors. J. Comp. Neurol. 390, 20–40 [PubMed] [Google Scholar]
- 11. Noh J., Seal R. P., Garver J. A., Edwards R. H., Kandler K. (2010) Glutamate co-release at GABA/glycinergic synapses is crucial for the refinement of an inhibitory map. Nat. Neurosci. 13, 232–238 [DOI] [PMC free article] [PubMed] [Google Scholar]
- 12. Hirtz J. J., Braun N., Griesemer D., Hannes C., Janz K., Löhrke S., Müller B., Friauf E. (2012) Synaptic refinement of an inhibitory topographic map in the auditory brainstem requires functional Cav1.3 calcium channels. J. Neurosci. 32, 14602–14616 [DOI] [PMC free article] [PubMed] [Google Scholar]
- 13. Klug A., Trussell L. O. (2006) Activation and deactivation of voltage-dependent K+ channels during synaptically driven action potentials in the MNTB. J. Neurophysiol. 96, 1547–1555 [DOI] [PubMed] [Google Scholar]
- 14. Song P., Kaczmarek L. K. (2006) Modulation of Kv3.1b potassium channel phosphorylation in auditory neurons by conventional and novel protein kinase C isozymes. J. Biol. Chem. 281, 15582–15591 [DOI] [PubMed] [Google Scholar]
- 15. Smith P. H., Spirou G. A. (2002) From the cochlea to the cortex and back. in Integrative Functions in the Mammalian Auditory Pathway (Oertel D., Fay R. R., Popper A. N., eds) pp. 6–71, Springer, New York [Google Scholar]
- 16. Awatramani G. B., Turecek R., Trussell L. O. (2005) Staggered development of GABAergic and glycinergic transmission in the MNTB. J. Neurophysiol. 93, 819–828 [DOI] [PubMed] [Google Scholar]
- 17. Ehmann H., Salzig C., Lang P., Friauf E., Nothwang H. G. (2008) Minimal sex differences in gene expression in the rat superior olivary complex. Hear. Res. 245, 65–72 [DOI] [PubMed] [Google Scholar]
- 18. Kruskal W. H., Wallis W. A. (1952) The use of ranks in one-criterion variance analysis. J. Am. Stat. Assoc. 47, 583–621 [Google Scholar]
- 19. Sachs L., Hedderich J. (2009) Angewandte Statistik, 13th Ed., Springer, Berlin [Google Scholar]
- 20. Efron B., Tibshirani R. (1993) An Introduction to the Bootstrap, Chapman & Hall, London [Google Scholar]
- 21. Gray P. A., Fu H., Luo P., Zhao Q., Yu J., Ferrari A., Tenzen T., Yuk D. I., Tsung E. F., Cai Z., Alberta J. A., Cheng L. P., Liu Y., Stenman J. M., Valerius M. T., Billings N., Kim H. A., Greenberg M. E., McMahon A. P., Rowitch D. H., Stiles C. D., Ma Q. (2004) Mouse brain organization revealed through direct genome-scale TF expression analysis. Science 306, 2255–2257 [DOI] [PubMed] [Google Scholar]
- 22. Hartmann A. K. (2009) Practical Guide to Computer Simulations, Word Scientific, Singapore [Google Scholar]
- 23. Durinck S., Moreau Y., Kasprzyk A., Davis S., De Moor B., Brazma A., Huber W. (2005) BioMart and Bioconductor. A powerful link between biological databases and microarray data analysis. Bioinformatics. 21, 3439–3440 [DOI] [PubMed] [Google Scholar]
- 24. Vilella A. J., Severin J., Ureta-Vidal A., Heng L., Durbin R., Birney E. (2009) EnsemblCompara GeneTrees. Complete, duplication-aware phylogenetic trees in vertebrates. Genome Res. 19, 327–335 [DOI] [PMC free article] [PubMed] [Google Scholar]
- 25. Huang da W., Sherman B. T., Lempicki R. A. (2009) Systematic and integrative analysis of large gene lists using DAVID bioinformatics resources. Nat. Protoc. 4, 44–57 [DOI] [PubMed] [Google Scholar]
- 26. Schroer A., Schneider S., Ropers H., Nothwang H. (1999) Cloning and characterization of UXT, a novel gene in human Xp11, which is widely and abundantly expressed in tumor tissue. Genomics 56, 340–343 [DOI] [PubMed] [Google Scholar]
- 27. Pfaffl M. W. (2001) A new mathematical model for relative quantification in real-time RT-PCR. Nucleic Acids Res. 29, e45. [DOI] [PMC free article] [PubMed] [Google Scholar]
- 28. Hurteau G. J., Spivack S. D. (2002) mRNA-specific reverse transcription-polymerase chain reaction from human tissue extracts. Anal. Biochem. 307, 304–315 [DOI] [PubMed] [Google Scholar]
- 29. Wahle P., Beckh S. (1992) A method of in situ hybridization combined with immunocytochemistry, histochemistry, and tract tracing to characterize the mRNA expressing cell types in heterogeneous neuronal populations. J. Neurosci. Methods 41, 153–166 [DOI] [PubMed] [Google Scholar]
- 30. Blaesse P., Ehrhardt S., Friauf E., Nothwang H. G. (2005) Developmental pattern of three vesicular glutamate transporters in the rat superior olivary complex. Cell Tissue Res. 320, 33–50 [DOI] [PubMed] [Google Scholar]
- 31. Fischer D., Hauk T. G., Müller A., Thanos S. (2008) Crystallins of the β/γ-superfamily mimic the effects of lens injury and promote axon regeneration. Mol. Cell Neurosci. 37, 471–479 [DOI] [PubMed] [Google Scholar]
- 32. Harris J. A., Hardie N. A., Bermingham-McDonogh O., Rubel E. W. (2005) Gene expression differences over a critical period of afferent-dependent neuron survival in the mouse auditory brainstem. J. Comp. Neurol. 493, 460–474 [DOI] [PubMed] [Google Scholar]
- 33. Friauf E., Aragón C., Löhrke S., Westenfelder B., Zafra F. (1999) Developmental expression of the glycine transporter GLYT2 in the auditory system of rats suggests involvement in synapse maturation. J. Comp. Neurol. 412, 17–37 [PubMed] [Google Scholar]
- 34. Allen P. D., Ison J. R. (2012) Kcna1 gene deletion lowers the behavioral sensitivity of mice to small changes in sound location and increases asynchronous brainstem auditory evoked potentials but does not affect hearing thresholds. J. Neurosci. 32, 2538–2543 [DOI] [PMC free article] [PubMed] [Google Scholar]
- 35. Karschin C., Wischmeyer E., Preisig-Müller R., Rajan S., Derst C., Grzeschik K. H., Daut J., Karschin A. (2001) Expression pattern in brain of TASK-1, TASK-3, and a tandem pore domain K+ channel subunit, TASK-5, associated with the central auditory nervous system. Mol. Cell Neurosci. 18, 632–648 [DOI] [PubMed] [Google Scholar]
- 36. Trussell L. O. (1999) Synaptic mechanisms for coding timing in auditory neurons. Annu. Rev. Physiol. 61, 477–496 [DOI] [PubMed] [Google Scholar]
- 37. Chen J., Nathans J. (2007) Estrogen-related receptor β/NR3B2 controls epithelial cell fate and endolymph production by the stria vascularis. Dev. Cell 13, 325–337 [DOI] [PubMed] [Google Scholar]
- 38. Van Esch H., Groenen P., Nesbit M. A., Schuffenhauer S., Lichtner P., Vanderlinden G., Harding B., Beetz R., Bilous R. W., Holdaway I., Shaw N. J., Fryns J. P., Van de Ven W., Thakker R. V., Devriendt K. (2000) GATA3 haplo-insufficiency causes human HDR syndrome. Nature 406, 419–422 [DOI] [PubMed] [Google Scholar]
- 39. Alasti F., Sadeghi A., Sanati M. H., Farhadi M., Stollar E., Somers T., Van Camp G. (2008) A mutation in HOXA2 is responsible for autosomal-recessive microtia in an Iranian family. Am. J. Hum. Genet. 82, 982–991 [DOI] [PMC free article] [PubMed] [Google Scholar]
- 40. Hodgkinson C. A., Moore K. J., Nakayama A., Steingrímsson E., Copeland N. G., Jenkins N. A., Arnheiter H. (1993) Mutations at the mouse microphthalmia locus are associated with defects in a gene encoding a novel basic-helix-loop-helix-zipper protein. Cell 74, 395–404 [DOI] [PubMed] [Google Scholar]
- 41. Pingault V., Bondurand N., Kuhlbrodt K., Goerich D. E., Préhu M. O., Puliti A., Herbarth B., Hermans-Borgmeyer I., Legius E., Matthijs G., Amiel J., Lyonnet S., Ceccherini I., Romeo G., Smith J. C., Read A. P., Wegner M., Goossens M. (1998) SOX10 mutations in patients with Waardenburg-Hirschsprung disease. Nat. Genet. 18, 171–173 [DOI] [PubMed] [Google Scholar]
- 42. Badis G., Berger M. F., Philippakis A. A., Talukder S., Gehrke A. R., Jaeger S. A., Chan E. T., Metzler G., Vedenko A., Chen X., Kuznetsov H., Wang C. F., Coburn D., Newburger D. E., Morris Q., Hughes T. R., Bulyk M. L. (2009) Diversity and complexity in DNA recognition by transcription factors. Science 324, 1720–1723 [DOI] [PMC free article] [PubMed] [Google Scholar]
- 43. Ravasi T., Suzuki H., Cannistraci C. V., Katayama S., Bajic V. B., Tan K., Akalin A., Schmeier S., Kanamori-Katayama M., Bertin N., Carninci P., Daub C. O., Forrest A. R., Gough J., Grimmond S., Han J. H., Hashimoto T., Hide W., Hofmann O., Kamburov A., Kaur M., Kawaji H., Kubosaki A., Lassmann T., van Nimwegen E., MacPherson C. R., Ogawa C., Radovanovic A., Schwartz A., Teasdale R. D., Tegnér J., Lenhard B., Teichmann S. A., Arakawa T., Ninomiya N., Murakami K., Tagami M., Fukuda S., Imamura K., Kai C., Ishihara R., Kitazume Y., Kawai J., Hume D. A., Ideker T., Hayashizaki Y. (2010) An atlas of combinatorial transcriptional regulation in mouse and man. Cell 140, 744–752 [DOI] [PMC free article] [PubMed] [Google Scholar]
- 44. Friauf E. (1993) Transient appearance of calbindin-D28k-positive neurons in the superior olivary complex of developing rats. J. Comp. Neurol. 334, 59–74 [DOI] [PubMed] [Google Scholar]
- 45. Maricich S. M., Xia A., Mathes E. L., Wang V. Y., Oghalai J. S., Fritzsch B., Zoghbi H. Y. (2009) Atoh1-lineal neurons are required for hearing and for the survival of neurons in the spiral ganglion and brainstem accessory auditory nuclei. J. Neurosci. 29, 11123–11133 [DOI] [PMC free article] [PubMed] [Google Scholar]
- 46. Satheesh S. V., Kunert K., Rüttiger L., Zuccotti A., Schönig K., Friauf E., Knipper M., Bartsch D., Nothwang H. G. (2012) Retrocochlear function of the peripheral deafness gene Cacna1d. Hum. Mol. Genet. 21, 3896–3909 [DOI] [PubMed] [Google Scholar]
- 47. Rosengauer E., Hartwich H., Hartmann A. M., Rudnicki A., Satheesh S. V., Avraham K. B., Nothwang H. G. (2012) Egr2::cre mediated conditional ablation of dicer disrupts histogenesis of mammalian central auditory nuclei. PLoS One 7, e49503. [DOI] [PMC free article] [PubMed] [Google Scholar]
- 48. Kapatos G., Hirayama K., Shimoji M., Milstien S. (1999) GTP cyclohydrolase I feedback regulatory protein is expressed in serotonin neurons and regulates tetrahydrobiopterin biosynthesis. J. Neurochem. 72, 669–675 [DOI] [PubMed] [Google Scholar]
- 49. Hirtz J. J., Boesen M., Braun N., Deitmer J. W., Kramer F., Lohr C., Müller B., Nothwang H. G., Striessnig J., Löhrke S., Friauf E. (2011) Cav1.3 calcium channels are required for normal development of the auditory brainstem. J. Neurosci. 31, 8280–8294 [DOI] [PMC free article] [PubMed] [Google Scholar]
- 50. Steel K. P., Kros C. J. (2001) A genetic approach to understanding auditory function. Nat. Genet. 27, 143–149 [DOI] [PubMed] [Google Scholar]
- 51. Petit C., Richardson G. P. (2009) Linking genes underlying deafness to hair-bundle development and function. Nat. Neurosci. 12, 703–710 [DOI] [PMC free article] [PubMed] [Google Scholar]
- 52. Dror A. A., Avraham K. B. (2010) Hearing impairment. A panoply of genes and functions. Neuron 68, 293–308 [DOI] [PubMed] [Google Scholar]
- 53. Baumann N., Pham-Dinh D. (2001) Biology of oligodendrocyte and myelin in the mammalian central nervous system. Physiol. Rev. 81, 871–927 [DOI] [PubMed] [Google Scholar]
- 54. Stead J. D., Neal C., Meng F., Wang Y., Evans S., Vazquez D. M., Watson S. J., Akil H. (2006) Transcriptional profiling of the developing rat brain reveals that the most dramatic regional differentiation in gene expression occurs postpartum. J. Neurosci. 26, 345–353 [DOI] [PMC free article] [PubMed] [Google Scholar]
- 55. Gavalas A., Davenne M., Lumsden A., Chambon P., Rijli F. M. (1997) Role of Hoxa-2 in axon pathfinding and rostral hindbrain patterning. Development 124, 3693–3702 [DOI] [PubMed] [Google Scholar]
- 56. Di Bonito M., Narita Y., Avallone B., Sequino L., Mancuso M., Andolfi G., Franzè A. M., Puelles L., Rijli F. M., Studer M. (2013) Assembly of the auditory circuitry by a Hox genetic network in the mouse brainstem. PLoS Genet. 9, e1003249. [DOI] [PMC free article] [PubMed] [Google Scholar]
- 57. Karis A., Pata I., van Doorninck J. H., Grosveld F., de Zeeuw C. I., de Caprona D., Fritzsch B. (2001) Transcription factor GATA-3 alters pathway selection of olivocochlear neurons and affects morphogenesis of the ear. J. Comp. Neurol. 429, 615–630 [DOI] [PubMed] [Google Scholar]
- 58. Vetter D. E., Li C., Zhao L., Contarino A., Liberman M. C., Smith G. W., Marchuk Y., Koob G. F., Heinemann S. F., Vale W., Lee K. F. (2002) Urocortin-deficient mice show hearing impairment and increased anxiety-like behavior. Nat. Genet. 31, 363–369 [DOI] [PubMed] [Google Scholar]
- 59. Bermingham N. A., Hassan B. A., Price S. D., Vollrath M. A., Ben-Arie N., Eatock R. A., Bellen H. J., Lysakowski A., Zoghbi H. Y. (1999) Math1. An essential gene for the generation of inner ear hair cells. Science 284, 1837–1841 [DOI] [PubMed] [Google Scholar]
- 60. Teagle H. F., Roush P. A., Woodard J. S., Hatch D. R., Zdanski C. J., Buss E., Buchman C. A. (2010) Cochlear implantation in children with auditory neuropathy spectrum disorder. Ear Hear. 31, 325–335 [DOI] [PubMed] [Google Scholar]
- 61. Chermak G. D., Musiek F. E. (1997) Conceptual and historical foundations. in Central Auditory Processing Disorders (Chermak G. D., Musiek F. E., eds) Singular Publishing Group, Inc., San Diego, CA [Google Scholar]
- 62. Griffiths T. D. (2002) Central auditory processing disorders. Curr. Opin. Neurol. 15, 31–33 [DOI] [PubMed] [Google Scholar]
- 63. Liedtke T., Schwamborn J. C., Schröer U., Thanos S. (2007) Elongation of axons during regeneration involves retinal crystallin β b2 (crybb2). Mol. Cell Proteomics 6, 895–907 [DOI] [PubMed] [Google Scholar]
- 64. Russell F. A., Moore D. R. (1995) Afferent reorganisation within the superior olivary complex of the gerbil. Development and induction by neonatal, unilateral cochlear removal. J. Comp. Neurol. 352, 607–625 [DOI] [PubMed] [Google Scholar]
- 65. Lohmann C., Ehrlich I., Friauf E. (1999) Axon regeneration in organotypic slice cultures from the mammalian auditory system is topographic and functional. J. Neurobiol. 41, 596–611 [DOI] [PubMed] [Google Scholar]
- 66. Gaspar P., Cases O., Maroteaux L. (2003) The developmental role of serotonin. News from mouse molecular genetics. Nat. Rev. Neurosci. 4, 1002–1012 [DOI] [PubMed] [Google Scholar]
- 67. Lesch K. P., Waider J. (2012) Serotonin in the modulation of neural plasticity and networks. Implications for neurodevelopmental disorders. Neuron 76, 175–191 [DOI] [PubMed] [Google Scholar]
- 68. Kulesza R. J., Jr., Lukose R., Stevens L. V. (2011) Malformation of the human superior olive in autistic spectrum disorders. Brain Res. 1367, 360–371 [DOI] [PubMed] [Google Scholar]
- 69. Lukose R., Schmidt E., Wolski T. P., Jr., Murawski N. J., Kulesza R. J. (2011) Malformation of the superior olivary complex in an animal model of autism. Brain Res. 1398, 102–112 [DOI] [PubMed] [Google Scholar]
- 70. Taylor M. J., Rosenblatt B., Linschoten L. (1982) Auditory brainstem response abnormalities in autistic children. Can. J. Neurol. Sci. 9, 429–433 [DOI] [PubMed] [Google Scholar]
- 71. Rosenhall U., Nordin V., Brantberg K., Gillberg C. (2003) Autism and auditory brain stem responses. Ear Hear. 24, 206–214 [DOI] [PubMed] [Google Scholar]
- 72. Roth D. A., Muchnik C., Shabtai E., Hildesheimer M., Henkin Y. (2012) Evidence for atypical auditory brainstem responses in young children with suspected autism spectrum disorders. Dev. Med. Child. Neurol. 54, 23–29 [DOI] [PubMed] [Google Scholar]
- 73. Oertel D. (2009) A team of potassium channels tunes up auditory neurons. J. Physiol. 587, 2417–2418 [DOI] [PMC free article] [PubMed] [Google Scholar]
- 74. Johnston J., Forsythe I. D., Kopp-Scheinpflug C. (2010) Going native. Voltage-gated potassium channels controlling neuronal excitability. J. Physiol. 588, 3187–3200 [DOI] [PMC free article] [PubMed] [Google Scholar]
- 75. Magnusson A. K., Park T. J., Pecka M., Grothe B., Koch U. (2008) Retrograde GABA signaling adjusts sound localization by balancing excitation and inhibition in the brainstem. Neuron 59, 125–137 [DOI] [PubMed] [Google Scholar]
- 76. Meyer R. C., Giddens M. M., Schaefer S. A., Hall R. A. (2013) GPR37 and GPR37L1 are receptors for the neuroprotective and glioprotective factors prosaptide and prosaposin. Proc. Natl. Acad. Sci. U.S.A. 110, 9529–9534 [DOI] [PMC free article] [PubMed] [Google Scholar]
- 77. Hu W., Tian C., Li T., Yang M., Hou H., Shu Y. (2009) Distinct contributions of Nav1.6 and Nav1.2 in action potential initiation and backpropagation. Nat. Neurosci. 12, 996–1002 [DOI] [PubMed] [Google Scholar]
- 78. Scott L. L., Hage T. A., Golding N. L. (2007) Weak action potential backpropagation is associated with high-frequency axonal firing capability in principal neurons of the gerbil medial superior olive. J. Physiol. 583, 647–661 [DOI] [PMC free article] [PubMed] [Google Scholar]
- 79. Morey M., Yee S. K., Herman T., Nern A., Blanco E., Zipursky S. L. (2008) Coordinate control of synaptic-layer specificity and rhodopsins in photoreceptor neurons. Nature 456, 795–799 [DOI] [PMC free article] [PubMed] [Google Scholar]
- 80. Vazquez-Echeverria C., Dominguez-Frutos E., Charnay P., Schimmang T., Pujades C. (2008) Analysis of mouse kreisler mutants reveals new roles of hindbrain-derived signals in the establishment of the otic neurogenic domain. Dev. Biol. 322, 167–178 [DOI] [PubMed] [Google Scholar]
- 81. Zhao G. Y., Li Z. Y., Zou H. L., Hu Z. L., Song N. N., Zheng M. H., Su C. J., Ding Y. Q. (2008) Expression of the transcription factor GATA3 in the postnatal mouse central nervous system. Neurosci. Res. 61, 420–428 [DOI] [PubMed] [Google Scholar]
- 82. Howell D. M., Morgan W. J., Jarjour A. A., Spirou G. A., Berrebi A. S., Kennedy T. E., Mathers P. H. (2007) Molecular guidance cues necessary for axon pathfinding from the ventral cochlear nucleus. J. Comp. Neurol. 504, 533–549 [DOI] [PubMed] [Google Scholar]
- 83. Duncan J. S., Fritzsch B. (2012) Transforming the vestibular system one molecule at a time. The molecular and developmental basis of vertebrate auditory evolution. Adv. Exp. Med. Biol. 739, 173–186 [DOI] [PubMed] [Google Scholar]