

Background: Selenoprotein M (SelM) is highly expressed in the brain and postulated to have neuroprotective properties.
Results: SelM expression is present in high levels in hypothalamic nuclei involved in energy metabolism, and SelM KO mice exhibit increased adiposity without apparent cognitive deficits.
Conclusion: SelM protects against obesity.
Significance: Increased understanding of the genes that protect against obesity may yield improved treatments and prevention strategies.
Keywords: Energy Metabolism, Hypothalamus, Obesity, Oxidative Stress, Selenoprotein
Abstract
Selenium is an essential trace element that is co-translationally incorporated into selenoproteins in the form of the 21st amino acid, selenocysteine. This class of proteins largely functions in oxidation-reduction reactions and is critically involved in maintaining proper redox balance essential to health. Selenoprotein M (SelM) is a thioredoxin-like endoplasmic reticulum-resident protein that is highly expressed in the brain and possesses neuroprotective properties. In this study, we first assessed the regional pattern of SelM expression in the mouse brain to provide insights into the potential functional implications of this protein in physiology and behavior. Next, we generated transgenic mice with a targeted deletion of the SelM gene and subjected them to a battery of neurobehavioral tests to evaluate motor coordination, locomotion, and cognitive function in comparison with wild-type controls. Finally, these mice were tested for several measures of metabolic function and body composition. Our results show that SelM knock-out (KO) mice display no deficits in measures of motor coordination and cognitive function but exhibit increased weight gain, elevated white adipose tissue deposition, and diminished hypothalamic leptin sensitivity. These findings suggest that SelM plays an important role in the regulation of body weight and energy metabolism.
Introduction
Selenium exerts its biochemical and metabolic effects through selenoproteins, which function primarily to protect against oxidative injury and include glutathione peroxidases, thioredoxin reductases, and iodothyronine deiodinases. Selenoproteins are characterized by the co-translational incorporation of selenium as selenocysteine, the 21st amino acid, at UGA codons, which typically serve as stop codons. Genetic knock-out studies in mice have demonstrated that at least three selenoproteins are essential as deletion of thioredoxin reductase 1 (1), thioredoxin reductase 2 (2), or glutathione peroxidase 4 (3) results in embryonic lethality. Furthermore, deletion of selenoprotein P (Sepp1),2 the putative selenium transport protein, produces a distinct neurological phenotype characterized by deficits in motor coordination, spatial learning, and hippocampal synaptic plasticity (4, 5).
Selenoprotein M (SelM) is an endoplasmic reticulum-resident selenoprotein that is highly expressed in the brain (6, 7). Structural studies have revealed that SelM possesses a selenocysteine-containing CXXU (where U is selenocysteine) thioredoxin-like domain and suggested that this protein acts as a thiol-disulfide oxidoreductase participating in disulfide bond formation (8). Previous work from our laboratory investigating SelM function in vitro demonstrated that SelM protects against oxidative stress and functions in intracellular calcium regulation (9). These initial studies suggest a neuroprotective function for SelM.
Nevertheless, to date, relatively little is known regarding the functional role of SelM. In this study, we investigated the effects of SelM deletion in vivo. First, we analyzed the expression pattern of SelM in wild-type mice. We then focused on the mouse brain to determine which regions may be compromised by SelM deletion. Next, to determine whether SelM deletion results in functional behavioral deficits, we subjected SelM knock-out (KO) mice to a battery of neurobehavioral tests to evaluate motor coordination, locomotor activity, and cognitive function. Finally, we assessed body composition and several indicators of metabolic and endocrine function in SelM KO mice. Our results indicate that mice lacking SelM exhibit no deficits in motor or cognitive function but display increased adiposity.
EXPERIMENTAL PROCEDURES
SelM KO Mouse Development
A targeting vector using a construct designed to exchange the SelM gene with a sequence containing a LacZ reporter and a neomycin selectable marker was generated by the National Center for Research Resources, National Institutes of Health-supported Knockout Mouse Project Repository (University of California, Davis). The vector was transfected into C57BL/6 embryonic stem cells by electroporation. After selection with antibiotic, surviving clones were expanded and analyzed by polymerase chain reaction (PCR) to identify recombinant embryonic stem cell (ES) clones. ES clones were microinjected into C57BL/6 blastocysts to produce chimeras with one wild-type SelM allele and one recombined SelM allele, which were then mated to generate SelM−/− mice on a C57BL/6 background. Genotyping was performing using two sets of PCR primers, one set that amplified a 553-base pair product present in the SelM wild-type allele (forward, 5′-AGC CAC AAC CTG GTG ATG AAG C-3′; reverse, 5′-CCC ACA CCA TCT ACT CGC TGC-3′) and another set that amplified a 350-base pair product of the neomycin selectable marker used in the targeting vector (forward, 5′-GCA GCC TCT GTT CCA CAT ACA CTT CA-3′; reverse, 5′-CCC ACA CCA TCT ACT CGC TGC-3′). C57BL/6J mice from The Jackson Laboratory were used to generate a colony of wild-type control mice.
Animals
All studies were performed on homozygous SelM KO and wild-type mice on a C57BL/6J background that were born, bred, and raised in the University of Hawaii Vivarium and housed under a 12/12-h light-dark cycle. Animals were housed in gender-specific groups of littermates (four to six animals per cage) until 12 weeks of age and then housed singly for behavioral experiments. All behavioral experiments were performed on adult mice aged 12–20 weeks during the light cycle. All metabolic tests were performed on singly housed adult mice aged 20–24 weeks, a time point when we observed significant differences in body weight between SelM KO and wild-type mice. For all behavioral experiments and histology, male and female SelM KO mice showed similar trends when compared with gender-specific wild-type mice, and thus data were pooled for graphical presentation and analysis. In addition, for these studies, all experimental groups consisted of equal numbers of males and females to normalize for any potential gender differences. For analysis of body composition and metabolic testing, there were significant differences between genders, and therefore the data are presented separately for each gender. All procedures using mice were conducted under an approved University of Hawaii Institutional Animal Care and Use Committee protocol. Animals were euthanized by CO2 asphyxiation or deeply anesthetized prior to perfusion for histological procedures.
Diets
Mice were fed standard laboratory chow containing adequate levels of selenium (0.25–0.30 ppm selenium). Beginning at weaning, a subset of animals (n = 5–8 of each gender) was fed a selenium-deficient Torula yeast-based diet that contained <0.01 ppm selenium.
Histology and Immunohistochemistry
Following behavioral testing, a representative sample (n = 6; three males and three females per group) of wild-type and SelM KO mice was selected for histological analysis. Mice were deeply anesthetized (1.2% Avertin; 0.7 ml/mouse) and perfused with ice-cold 0.1 m phosphate-buffered saline (PBS) followed by 4% paraformaldehyde in PBS. Brains were removed, stored in 4% paraformaldehyde for 24 h, and immersed in graded solutions of sucrose (10, 20, and 30%) until they sank. Brains were cut into 40-μm sections on a cryostat and either mounted on Superfrost Plus slides and stained with thionin or stored as free floating sections in a cryoprotective solution (0.05 m PBS, 25% glycerol, 25% polyethylene glycol) at 4 °C. For diaminobenzidine tetrahydrochloride immunohistochemistry, free floating sections were treated with 0.3% H2O2 to inactivate endogenous peroxidases, blocked, and incubated overnight at 4 °C with the proper primary antibody. The next day, sections were probed with the appropriate biotinylated secondary antibody followed by incubation in avidin-biotin-peroxidase complex (Vector ABC kit, Vector Laboratories), and immunoreactivity was visualized by peroxidase detection using diaminobenzidine tetrahydrochloride (DAB Substrate kit, Vector Laboratories) as a chromogen substrate. After several rinses in PBS, sections were mounted on slides, dehydrated with graded solutions of ethanol followed by xylene, and coverslipped. For immunofluorescence, a similar procedure was used except that sections were not incubated with H2O2, and appropriate Alexa Fluor-labeled fluorescent secondary antibodies were used for visualization instead of diaminobenzidine tetrahydrochloride.
Protein Extraction and Immunoblotting
Mouse tissues were lysed by sonication in CelLytic MT buffer (Sigma) containing protease inhibitors (Calbiochem) and centrifuged at 14,000 × g, and supernatants were collected. Samples consisting of 40 μg of total protein were separated by 4–20% SDS-PAGE on a gradient gel (Bio-Rad), transferred to Immobilon-FL polyvinylidene difluoride membranes (Millipore), and probed for 2 h at room temperature with specific primary antibodies. Membranes were washed with PBS containing 0.01% Tween 20 and incubated in the dark with secondary antibodies coupled to infrared fluorophores (LI-COR Biosciences). After additional washes in PBS, blots were imaged and analyzed using an Odyssey infrared imager (LI-COR Biosciences).
Antibodies
Primary antibodies used for Western blotting in these studies were rabbit anti-SelM (1:500; Sigma, HPA019601), rabbit anti-p-Akt Ser-473 (1:1000; Cell Signaling Technology, 9271), and mouse anti-β-actin (1:5000; Sigma, A2228). For immunohistochemistry, the antibodies utilized were rabbit anti-parvalbumin (1:10,000; Swant, PV 25), rabbit anti-SelM (1:250; Sigma), goat anti-leptin receptor (1:50; R&D Systems, AF497), mouse anti-NeuN (1:250; Millipore, MAB377), and rabbit anti-p-STAT3 Tyr-705 (1:500; Cell Signaling Technology, 9145). In addition, for immunohistochemistry, we used a blocking peptide (1:25; Peptide 2.0) consisting of the antigen sequence used to generate the SelM antibody as a control.
Stereology
Quantitative analysis of cell numbers was performed on a Zeiss Axioskop microscope equipped with MicroBrightfield Stereo Investigator software (MBF Bioscience). An optical dissector (counting box) was used to analyze and count neurons. The following regions were outlined using a 5× objective with the aid of a mouse brain atlas (10) at specified coronal levels relative to bregma: somatosensory cortex (1.18 mm); medial septum (0.50 mm); CA1, CA2/3, and dentate gyrus of the dorsal hippocampus (−1.82 mm); and inferior colliculus (−5.02 mm). Following contour selection, optical fractionator analysis was conducted at high magnification (20× objective) using a 300 × 300-μm counting frame to quantify the number of positive neurons.
Open Field Test
Mice (n = 14–22) were placed in the center of an open field apparatus (50 × 50 cm) protected with 10-cm-high opaque walls and allowed to explore for 5 min. The field was divided into 16 equal squares (12.5 × 12.5 cm) consisting of 12 outer squares and four inner squares. Animal behavior was recorded by a video camera connected to a personal computer and analyzed by video tracking software (VideoMot 2, TSE Systems). The amount of time spent in the inner and outer squares and the total distance traveled were measured.
Elevated Plus Maze Test
Mice (n = 16) were placed in the center platform of the elevated plus maze and allowed to explore for 5 min. Animal behavior was recorded by a video camera connected to a personal computer and analyzed by video tracking software. The amount of time spent in the open and closed arms was recorded. The distance traveled during the 5-min test was taken as a measure of locomotor activity.
Rotorod Test
Starting speed for the Rotorod was 4 rpm and increased to 40 rpm over a 5-min period. Mice (n = 20) were tested four times daily for 2 consecutive days with an intertrial interval of 1 h between tests. The latency to fall off the rod was measured for each trial and then used to calculate an average for each day.
Barnes Maze Test
Spatial learning and memory were assessed using a “dry land” version of the Barnes maze (TSE Systems). The maze consisted of a brightly illuminated white circular board (diameter, 122 cm) containing 40 equally spaced holes (diameter, 5 cm) raised 80 cm above the floor. One hole led to a dark gray PVC escape tunnel that was mounted underneath the maze and filled with tissue paper. Mouse behavior was monitored by an overhead video camera connected to a computer equipped with video tracking software. On the 1st day of testing, mice (n = 14) were subjected to a habituation session in which they were first placed in the escape tunnel for 1 min and then placed in the center of the apparatus and allowed to explore until either they found the escape tunnel or 5 min elapsed. Following the habituation session, mice were trained (acquisition training) to find the escape tunnel, which remained at a fixed location relative to spatial cues for the duration of training. Training consisted of two trials daily (3 min maximum per trial; intertrial interval, ∼ 1 h) with the starting location varied pseudorandomly for 20 days. At the start of each trial, mice were placed in a gray PVC starting chamber in the center of one of the four quadrants. After 15 s, the start chamber was lifted, and the mouse was allowed to explore the maze. During each trial, loud white noise (90 db) was played through a loudspeaker to induce escape behavior. The trial ended when the mouse entered the escape tunnel or 3 min elapsed. If a mouse failed to find the escape tunnel within the 3-min trial period, it was placed in the escape tunnel by the researcher and allowed to stay there for 15 s. Following each trial, the maze and escape tunnel were cleaned with 70% ethanol. For each training trial, the latency to locate and enter the escape tunnel, the distance traveled, and the number of incorrect holes checked (errors) were recorded. Three days after the final session of acquisition training, a 1-min acquisition probe trial was administered in which the escape box was removed. For the probe trial, the starting chamber was placed in the center of the apparatus, and white noise was amplified through loudspeakers.
Fear Conditioning
For the acquisition of conditioned fear, mice (n = 14–18) were placed in a computer-controlled fear conditioning system (TSE Systems) for a 6-min conditioning trial. Following a 2-min exploratory period, two electric foot shocks (0.8 mA, 2-s duration, constant current) were delivered through a stainless steel grid floor at 2-min intervals with a 10-s tone (75 db, pulsed 5 Hz) preceding each foot shock. During each 2-min postshock interval, freezing was measured. At the conclusion of conditioning, mice were returned to their home cages. After 24 h, mice were placed in a novel chamber to assess auditory fear retention. Following an initial 2-min exploratory period in the novel chamber, the tone was continuously presented for 4 min during which freezing was measured. The following day (48 h after conditioning), to assess contextual fear retention, mice were returned to the fear conditioning apparatus for a 4-min test during which freezing was measured.
Metabolic Phenotyping
Starting at 12 weeks of age, body weight (n = 10–14 of each gender) was assessed at 2-week intervals. Food consumption (n = 7 of each gender) was measured weekly for 4 consecutive weeks when mice were 20–24 weeks of age. Fasting levels (n = 7–8 of each gender) of leptin and insulin were measured using commercial ELISA kits for leptin (Crystal Chem Inc.) and insulin (Alpco), respectively. Following sacrifice, the liver and fat depots (n = 7 of each gender) for gonadal (gWAT) and inguinal (ingWAT) white adipose tissue were collected and weighed.
Glycemic Control Testing
Glucose tolerance was assessed by administering a glucose injection of 1 mg/g of body weight to animals (n = 7 of each gender) that were fasted overnight. Tail blood was collected at time points 0, 30, 60, 120, and 180 min after injection, and glucose levels were determined using strips and a glucometer (OneTouch Ultra, Lifescan). To evaluate hepatic insulin signaling, mice (n = 6; three males and three females per group) were fasted for 4 h and then injected with a dose of 10 milliunits/g of body weight human insulin (Humulin R, Eli Lilly). Twenty minutes after the insulin injection, mice were sacrificed by CO2 asphyxiation, and livers were collected for analysis. Tissue was prepared for Western blotting as described above.
Corticosterone Measurement
To determine base-line corticosterone levels, blood was collected from unstressed mice (n = 5–10 of each gender) into serum separator tubes via tail bleeding during the morning (8:30–9:30 a.m.) and early evening (4:00–6:00 p.m.) periods. Samples were centrifuged at 5000 × g for 15 min, and serum was collected, frozen, and later analyzed using a corticosterone ELISA kit (Abnova).
Quantification of STAT3 Phosphorylation in the Arcuate Hypothalamus
Mice (n = 4 of each gender; 20–22 weeks old) were fasted for 5 h prior to receiving an intraperitoneal injection of leptin (1 mg/kg; National Hormone and Peptide Program). One hour after leptin injection, mice were deeply anesthetized and perfused. Brains were extracted and later processed for p-STAT3 immunohistochemistry. Bright-field images (10× objective) were captured with a digital camera mounted on a Zeiss microscope (Axioskop2) and analyzed using ImageJ analysis software. With the aid of a mouse brain atlas (10), contours were drawn in three coronal brain sections (−1.34, −1.58, and −1.82 mm from bregma) that corresponded to the boundaries of the arcuate hypothalamus, and the number of p-STAT3-positive cells were counted in each contour. The final density of p-STAT3-positive cells for each animal was determined by dividing the total number of p-STAT3-positive cells by the total area sampled across the three sections.
Statistical Analysis
Data were analyzed and plotted using Prism software (GraphPad). Statistical tests varied according to the experiment and are indicated in the text and/or figure legends. All results are represented as means ± S.E.
RESULTS
Generation of SelM KO Mice
Heterozygous SelM+/− mice were created by the Knockout Mouse Project Repository (University of California, Davis) using a construct designed to exchange the SelM gene with a sequence containing a LacZ reporter and a neomycin selectable marker (Fig. 1A). Homozygous SelM KO (SelM−/−) mice were generated by breeding heterozygous SelM+/− mice, and deletion of the SelM gene was confirmed by PCR (primers are listed under “Experimental Procedures”). Western blot analysis of whole brains using an antibody against SelM confirmed that the SelM protein was undetectable in SelM KO mice (Fig. 1B).
FIGURE 1.

Generation of SelM KO mice. A, diagram of the targeting vector used to delete the endogenous SelM gene by means of homologous recombination. B, Western blot analysis showing that SelM is present in the brains of wild-type mice and absent in SelM KO mice.
Analysis of SelM Expression
We first investigated the expression of SelM in a variety of tissues by Western blotting to determine where SelM may be most functionally relevant. High levels of SelM expression were observed in the brain, pituitary, and pancreas, whereas SelM levels were low to undetectable in the adrenal, kidney, thyroid, and liver (Fig. 2A). Additional Western blots performed on dissected mouse brain showed that SelM expression was highest in the olfactory bulb and cerebellum, lowest in the hippocampus and cerebral cortex, and expressed at intermediate levels in the hypothalamus and brain stem (Fig. 2B). To further probe the regional expression of SelM in the mouse brain, we performed immunohistochemistry. First, to verify the specificity of our SelM antibody, we preincubated sections with a SelM-blocking peptide and observed an absence of signal over background (Fig. 2C). As expected, a similar absence of signal was found when sections from SelM KO mice were incubated with the SelM antibody (Fig. 2C). In sections from wild-type mice, SelM was highly expressed in several regions, including cerebellum, paraventricular and arcuate nuclei of the hypothalamus, red nucleus, ventral tegmental area, medial septum, and a discrete portion of the hippocampus lying at the boundary of the CA2 and CA3 regions (Fig. 2, D–I). Relative levels of SelM expression were evaluated by immunohistochemistry throughout the mouse brain and are indicated in Table 1.
FIGURE 2.

Analysis of SelM expression. A, Western blot analysis of SelM expression in different tissues of wild-type mice. B, Western blot analysis of SelM expression in brain regions of wild-type mice. C, images of the somatosensory cortex in wild-type mice probed with the SelM antibody in the absence (left) and presence (middle) of a SelM-blocking peptide. An image from a SelM KO mouse (right) probed with the SelM antibody is shown. D, E, F, G, H, and I, images showing SelM expression in the cerebellum (D), paraventricular nucleus of the hypothalamus (E), arcuate nucleus of the hypothalamus (F), ventral tegmental area/red nucleus (G), medial septum (H), and hippocampus (I). Ad, adrenal; ARC, arcuate nucleus of hypothalamus; BS, brain stem; Ce, cerebellum; Co, cerebral cortex; DG, dentate gyrus; GL, granular layer; Hi, hippocampus; Hy, hypothalamus; Ki, kidney; Li, liver; LS, lateral septum; ML, molecular layer; MS, medial septum; OB, olfactory bulb; Pa, pancreas; Pi, pituitary; PL, Purkinje layer; PVN, paraventricular nucleus of hypothalamus; RN, red nucleus; SN, substantia nigra; Th, thyroid; VTA, ventral tegmental area; WB, whole brain. Scale bars, 200 μm.
TABLE 1.
Regional expression of SelM in the mouse brain
−, no detectable expression; +, low expression; ++, moderate expression; +++, high expression.
| Brain region | SelM |
|---|---|
| Telencephalon | |
| Cortex | |
| Auditory | + |
| Cingulate | + |
| Entorhinal | − |
| Medial prefrontal | − |
| Motor | + |
| Retrosplenial | + |
| Somatosensory | + |
| Basal forebrain | |
| Bed nucleus of stria terminalis | − |
| Lateral septum | − |
| Medial forebrain bundle | ++ |
| Medial septum | +++ |
| Amygdala | |
| Basolateral | + |
| Central | − |
| Medial | + |
| Hippocampus | |
| CA1 | + |
| CA2 | +++ |
| CA3 | ++ |
| Dentate gyrus | − |
| Subiculum | ++ |
| Basal ganglia | |
| Caudate putamen | + |
| Globus pallidus | ++ |
| Nucleus accumbens | − |
| Diencephalon | |
| Hypothalamus | |
| Arcuate nucleus | +++ |
| Dorsomedial nucleus | − |
| Lateral | + |
| Paraventricular nucleus | +++ |
| Ventromedial | − |
| Thalamus | |
| Habenula | ++ |
| Lateral geniculate | + |
| Medial geniculate | − |
| Reticular thalamus | +++ |
| Ventral anterior | − |
| Ventral posterior | + |
| Mesencephalon | |
| Inferior colliculus | + |
| Oculomotor nucleus (3N) | ++ |
| Periaqueductal gray | − |
| Red nucleus | +++ |
| Substantia nigra | + |
| Superior colliculus | − |
| Ventral tegmental area | +++ |
| Metencephalon | |
| Cochlear nucleus | +++ |
| Dorsal raphe nucleus | + |
| Locus coeruleus | + |
| Motor trigeminal nucleus | +++ |
| Nuclei of the lateral lemniscus | +++ |
| Parabrachial nucleus | − |
| Pontine nuclei | ++ |
| Spinal trigeminal nucleus | + |
| Superior olivary complex | +++ |
| Cerebellum | |
| Nuclei | |
| Interposed | + |
| Lateral | ++ |
| Medial | + |
| Cortex | |
| Granular layer | +++ |
| Molecular layer | − |
| Purkinje layer | +++ |
Normal Brain Morphology and Density of Parvalbumin (PV) Interneurons in SelM KO Mice
We next examined general brain morphology to determine whether any potential developmental abnormalities existed as a result of a lack of SelM. Thionin staining of brain sections indicated that SelM deletion produced no gross morphological changes in the hippocampus (Fig. 3A) or elsewhere in the brain (data not shown). We also assessed the density of PV interneurons to determine whether there were any changes in SelM KO mice. PV interneurons are a class of fast spiking inhibitory GABAergic interneurons that are particularly susceptible to redox dysregulation (11, 12). Moreover, reduced densities of PV interneurons have been observed in mouse models with diminished selenoprotein expression (13–15). Although SelM appeared to be expressed in PV interneurons, we observed no changes in PV interneuron density between wild-type and SelM KO mice in any of the brain regions examined (Fig. 3, A and B) (F(1,10) = 0.08993, p > 0.05).
FIGURE 3.
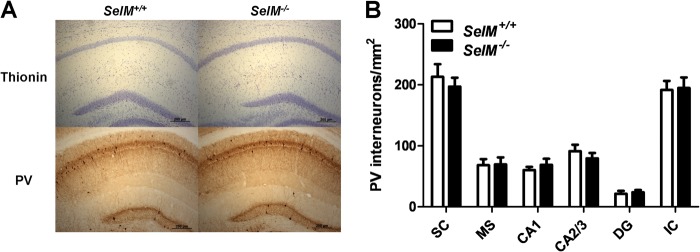
Normal brain morphology and PV interneuron density in SelM KO mice. A, images of brain sections from the hippocampus of wild-type (left) and SelM KO (right) mice stained with thionin (top) or probed with an antibody for PV (bottom). B, mean density of PV interneurons/mm2 (±S.E.; n = 6 per genotype) in brain regions investigated. DG, dentate gyrus; IC, inferior colliculus; MS, medial septum; SC, somatosensory cortex. Scale bars, 200 μm. Error bars represent S.E.
Normal Anxiety, Locomotion, and Motor Coordination in SelM KO Mice
As SelM expression was observed in brain regions implicated in motor (cerebellum and red nucleus) and cognitive function (hippocampus and medial septum), we next administered a battery of standard neurobehavioral tests to determine whether SelM deletion would result in behavioral impairments. To evaluate anxiety and locomotor activity, mice were subjected to both the open field (Fig. 4, A and B) and elevated plus maze tests (Fig. 4, C and D). We observed no differences in anxiety-like behavior between genotypes as assessed by the amount of time spent in the center of the open field apparatus (Fig. 4A) (t34 = 0.2450, p > 0.05) or in the open arms of the elevated plus maze (Fig. 4C) (t30 = 0.4198, p > 0.05). Furthermore, we found no significant differences in locomotion between genotypes on either the open field (Fig. 4B) (t34 = 0.314, p > 0.05) or elevated plus maze tests (Fig. 4D) (t30 = 1.528, p > 0.05). We also examined motor learning and coordination by means of a 2-day rotorod test. No differences in latency to fall off the accelerating rotorod were observed between genotypes on either day of rotorod testing (Fig. 4E) (F(1,38) = 0.009848, p > 0.05). There was a significant main effect for training day (F(1,38) = 23.59, p < 0.0001) as mice spent significantly more time on the rotorod on Day 2 in comparison with Day 1, indicating the presence of motor learning in both wild-type and SelM KO mice.
FIGURE 4.

Normal anxiety, locomotion, and motor coordination in SelM KO mice. A, mean (±S.E.) percentage of time spent in the center and perimeter regions during the open field test. B, mean (±S.E.) distance traveled during the open field test. C, mean (±S.E.) percentage of time spent in the open and closed arms as well as the intersection in the center during the elevated plus maze test. D, mean (±S.E.) distance traveled during the elevated plus maze test. E, mean (±S.E.) amount of time spent on the rotorod prior to falling off. Error bars represent S.E.
Normal Learning and Memory in SelM KO Mice
After determining that SelM KO mice had no impairments in locomotion or motor coordination, we evaluated learning and memory using two well established learning paradigms, a dry land version of the Barnes maze and fear conditioning. To investigate spatial learning and memory, mice were trained twice daily for 20 days to find a hidden escape tunnel located beneath one of 40 holes on the periphery of the circular Barnes maze. For each trial, mouse behavior was recorded by a video camera and analyzed using video tracking software. During training, we observed no differences between genotypes in either the latency to locate the escape hole (primary latency; Fig. 5A) (F(1,26) = 1.331, p > 0.05) or in the number of incorrect holes checked prior to locating the escape hole (primary errors; Fig. 5B) (F(1,26) = 0.3297, p > 0.05). For both primary latency (F(9,260) = 39.16, p < 0.0001) and primary errors (F(9,260) = 16.31, p < 0.0001), we observed significant main effects for trial block across genotypes, indicating that learning was taking place. We also found that wild-type mice traveled significantly greater distances than SelM KO mice during training (Fig. 5C) (F(1,26) = 18.15, p < 0.001). Post hoc tests revealed that significant differences in locomotion were observed during the first three blocks of trials and attenuated as training progressed. In addition to the differences in locomotion, we found a significant genotype × trial block interaction for the amount of time it took mice to enter the escape hole (total latency; Fig. 5D) (F(9,260) = 2.14, p < 0.05). For the first two blocks of training, wild-type mice took significantly longer to enter the escape hole than SelM KO mice. The initial significant differences in total distance and total latency disappeared as training progressed and were largely due to the greater initial propensity of SelM KO mice to enter the escape hole when they first located it. Finally, after 20 days of training, we removed the escape tunnel and subjected mice to a 60-s probe trial. No significant differences were observed between genotypes for either the latency to locate the escape tunnel (Fig. 5E) (t26 = 0.06358, p > 0.05) or the distance traveled during the probe trial (Fig. 5F) (t26 = 1.452, p > 0.05), although there was a non-significant trend toward less distance in SelM KO mice. For fear conditioning, we also observed no differences between genotypes in the retention of auditory (Fig. 5G) (F(1,30) = 0.0612, p > 0.05) or contextual fear memory (Fig. 5H) (t30 = 0.8106, p > 0.05). These results indicate that SelM KO mice have no major impairments in learning and memory.
FIGURE 5.

Normal learning and memory in SelM KO mice. A, mean (±S.E.) latency to locate the escape tunnel during Barnes maze training. B, mean (±S.E.) number of incorrect holes checked prior to locating the escape tunnel during training. C, mean (±S.E.) distance traveled during Barnes maze training. D, mean (±S.E.) latency to enter the escape tunnel during training. E, mean (±S.E.) latency to locate the escape tunnel during the probe trial. F, mean (±S.E.) distance traveled during the probe trial. G, mean (±S.E.) freezing during auditory fear retention testing. H, mean (±S.E.) freezing during contextual fear retention testing. *, p < 0.05; **, p < 0.01. Error bars represent S.E.
Increased Weight Gain and Adiposity in SelM KO Mice
Because we observed that SelM KO mice appeared to be gaining excessive weight, we began tracking body weights from 12 to 20 weeks of age. Two-way analysis of body weight during this time interval revealed significant main effects for time (males: F(4,104) = 77.20, p < 0.0001; females: F(4,72) = 35.21, p < 0.0001) and genotype (males: F(1,26) = 4.264, p < 0.05; females: F(1,18) = 8.176, p < 0.05) as well as a time × genotype interaction (males: F(4,104) = 24.02, p < 0.0001; females: F(4,72) = 7.817, p < 0.0001). At 12 weeks of age, body weight was similar between genotypes, but by 18 weeks, body weight was significantly higher in SelM KO mice in comparison with age-matched wild-type controls (Fig. 6, A and B). In addition, two-way ANOVA of serum leptin levels (Fig. 6C) showed significant differences for both gender (F(1,28) = 10.22, p < 0.01) and genotype (F(1,28) = 13.30, p < 0.01). Post hoc analysis determined that leptin levels were significantly different between genotypes in males (t14 = 3.696, p < 0.01), and differences approached significance in females (t14 = 1.463, p > 0.05). To determine whether the observed increase in body weight was due to augmented feeding behavior, we measured food consumption weekly over a 4-week period (Fig. 6D). No significant differences in average weekly food consumption were found for either genotype (F(1,24) = 1.253, p > 0.05) or gender (F(1,24) = 0.04904, p > 0.05). However, the two animals that consumed the most food during this 4-week period were female SelM KO mice. The increased feeding behavior of these two mice resulted in the average consumption of female SelM KO mice being non-significantly skewed toward higher food consumption. Nevertheless, with the exception of these two mice, food consumption was virtually identical between wild-type and SelM KO mice. We also measured the amount of gWAT and ingWAT relative to total body weight (Fig. 6, E and F). The levels of gWAT (F(1,24) = 50.31, p < 0.0001) and ingWAT (F(1,24) = 32.28, p < 0.0001) were increased ∼2-fold in both male and female SelM KO mice relative to wild-type controls.
FIGURE 6.

Increased weight gain and adiposity in SelM KO mice. A and B, mean (±S.E.) body weight for male (A) and female (B) wild-type and SelM KO mice from 12 to 20 weeks of age. C, mean (±S.E.) serum leptin levels as measured by ELISA. D, mean (±S.E.) weekly food consumption. E and F, mean (±S.E.) percentages of gWAT (E) and ingWAT (F) relative to total body weight. *, p < 0.05; **, p < 0.01; ***, p < 0.001. Error bars represent S.E.
Normal Glucose Tolerance and Hepatic Insulin Signaling in SelM KO Mice
We next determined whether the increased fat deposition observed in SelM KO mice was associated with alterations in glycemic control and/or hepatic insulin signaling. Blood glucose levels during glucose tolerance testing were similar between genotypes for both males (Fig. 7A) (F(1,12) = 0.0004288, p > 0.05) and females (Fig. 7B) (F(1,12) = 0.2444, p > 0.05). Two-way ANOVA of fasting insulin levels showed a significant effect of gender (F(1,26) = 15.07, p < 0.001) and a significant gender × genotype interaction (F(1,26) = 8.453, p < 0.01) (Fig. 7C). Post hoc tests revealed that insulin levels were significantly elevated (t14 = 3.546, p < 0.01) in male SelM KO mice, whereas levels were comparable between female wild-type and SelM KO mice. To investigate insulin signaling in the liver, a subset of animals was challenged with a sublethal dose of insulin and sacrificed shortly thereafter for analysis of insulin-induced Akt phosphorylation. Western blot analysis revealed similar levels of hepatic Akt phosphorylation between genotypes (F(1,8) = 0.01956, p > 0.05) but increased p-Akt levels in females relative to males (F(1,8) = 17.21, p < 0.01) (Fig. 7, D and E). Moreover, SelM protein was not detected in the liver of wild-type mice, further suggesting that SelM deletion did not adversely affect liver function. Similarly, when normalized to total body weight, the liver weights did not differ between wild-type and SelM KO mice (Fig. 7F).
FIGURE 7.

Normal glycemic control and hepatic insulin signaling in SelM KO mice. A and B, mean (±S.E.) blood glucose levels for male (A) and female (B) wild-type and SelM KO mice during glucose tolerance testing. C, mean (±S.E.) serum insulin levels as measured by ELISA. D, Western blot analysis of hepatic Akt phosphorylation in response to insulin challenge. E, quantification of hepatic Akt phosphorylation normalized to β-actin levels. F, mean (±S.E.) percentage of liver weight relative to total body weight. **, p < 0.01. Error bars represent S.E.
Diminished Leptin Sensitivity in the Arcuate Hypothalamus of SelM KO Mice
Based upon our previous observations that SelM is expressed in the arcuate hypothalamus and that SelM KO mice are obese with elevated leptin levels, we next investigated leptin signaling in the arcuate hypothalamus. Using multilabel immunofluorescence, we first determined that SelM is co-expressed with the leptin receptor (ObR) in neurons of the arcuate hypothalamus (Fig. 8A). Next, we injected animals with leptin (1 mg/kg; 1 h) and performed p-STAT3 immunohistochemistry to assess leptin signaling (Fig. 8B). Two-way ANOVA showed a significant main effect for genotype (F(1,12) = 5.134, p < 0.05) (Fig. 8C) as SelM KO mice had reduced numbers of p-STAT3-immunopositive cells in comparison with wild-type controls. When genders were compared separately using post hoc analysis, the differences approached significance in both males (t6 = 1.837, p > 0.05) and females (t6 = 1.367, p > 0.05).
FIGURE 8.

Diminished leptin sensitivity in the arcuate hypothalamus of SelM KO mice. A, confocal images of the arcuate hypothalamus showing expression of the leptin receptor (left), SelM (middle left), NeuN (middle right), and co-localization of the markers (right). Scale bar, 100 μm. B, images of brain sections from the hypothalamus of wild-type (top) and SelM KO (bottom) mice probed with an antibody for p-STAT3. Scale bars, 200 μm. C, mean density (±S.E.) of p-STAT3-positive nuclei/mm2 in the arcuate hypothalamus. ObR, leptin receptor; Arc, arcuate nucleus of hypothalamus; 3V, third ventricle. Error bars represent S.E.
Altered Basal Activity of the Hypothalamic-Pituitary-Adrenal (HPA) Axis in SelM KO Mice
Our immunohistochemical analyses revealed that SelM is highly expressed in the paraventricular nucleus of the hypothalamus, a brain region critically involved in control of the HPA axis. To assess HPA axis activity in SelM KO mice, we measured resting base-line levels of corticosterone during the morning and evening periods. Two-way ANOVA of serum corticosterone levels during the morning trough period revealed that levels were significantly reduced in SelM KO mice (F(1,27) = 7.317, p < 0.05) (Fig. 9A). Post hoc analyses showed that when the genders were compared separately the differences approached significance in both males (t19 = 1.944, p > 0.05) and females (t8 = 1.616, p > 0.05). Corticosterone levels during the evening peak period were comparable between genotypes (F(1,19) = 0.5815, p > 0.05) (Fig. 9B), but we did observe a significant main effect for gender (F(1,19) = 6.794, p < 0.05) as levels were significantly higher in females. These results suggest that base-line activity of the HPA axis is altered in SelM KO mice.
FIGURE 9.

Altered basal activity of the HPA axis in SelM KO mice. A and B, mean (±S.E.) serum corticosterone (Cort) levels for wild-type and SelM KO mice during the morning (A) and evening (B) periods. Error bars represent S.E.
Analysis of SelM KO Mice Fed a Selenium-deficient Diet
To further probe the effects of SelM deletion, we challenged a cohort of animals with a Torula yeast-based selenium-deficient diet (<0.01 ppm selenium) beginning at weaning. When these animals were evaluated on the open field test, we observed no differences between genotypes for the amount of time spent in the center region (t20 = 0.08118, p > 0.05), but SelM KO mice exhibited significantly decreased locomotion (t20 = 2.592, p < 0.05) (Fig. 10, A and B). Two-way ANOVA of body weight at 2-week intervals from 12 to 20 weeks of age showed a significant main effect for time (males: F(4,48) = 90.09, p < 0.0001; females: F(4,36) = 30.28, p < 0.0001) and a significant time × genotype interaction (males: F(4,48) = 5.175, p < 0.01; females: F(4,36) = 7.452, p < 0.001) in both males and females (Fig. 10, C and D). We also observed a significant main effect of genotype for females (F(1,36) = 26.18, p < 0.001), whereas males (F(1,48) = 1.957, p > 0.05) showed a non-significant trend toward increased body weight. Additionally, the observed differences in body weight between genotypes were greatest at 20 weeks in both males and females. When tested for glucose tolerance, no significant differences were found between genotypes for both males (F(1,40) = 0.8331, p > 0.001) and females (F(1,36) = 0.6538, p > 0.05) (Fig. 10, E and F). Following sacrifice, the levels of gWAT (F(1,14) = 49.29, p < 0.0001) and ingWAT (F(1,14) = 30.51, p < 0.0001) were significantly elevated in both male and female SelM KO mice relative to wild-type controls (Fig. 10, G and H).
FIGURE 10.

Analysis of wild-type and SelM KO mice fed a selenium deficient diet. A, mean (±S.E.) percentage of time spent in the center and perimeter regions during the open field test. B, mean (±S.E.) distance traveled during the open field test. C and D, mean (±S.E.) body weight for male (C) and female (D) wild-type and SelM KO mice from 12 to 20 weeks of age. E and F, mean (±S.E.) blood glucose levels for male (E) and female (F) wild-type and SelM KO mice during glucose tolerance testing. G and H, mean (±S.E.) percentages of gWAT (G) and ingWAT (H) relative to total body weight. *, p < 0.05; **, p < 0.01; ***, p < 0.001. Error bars represent S.E.
DISCUSSION
Because SelM was shown previously to be highly expressed in the brain, we anticipated that SelM deletion may lead to behavioral impairments. However, we found that SelM KO mice exhibited normal brain development and showed no significant changes in motor coordination, anxiety-like behavior, and cognitive function. In contrast, SelM KO mice showed significantly elevated body weight over time relative to wild-type controls, and this change was observed to be due to increased fat deposition. This increase in body weight is likely due to diminished energy expenditure as food consumption was comparable between genotypes, whereas SelM KO mice displayed strong tendencies toward less movement during behavioral testing. SelM KO mice were also found to have elevated serum leptin levels and diminished sensitivity to leptin in the arcuate hypothalamus. Further studies performed on a cohort of mice fed a selenium-deficient diet corroborated our main findings as SelM KO mice were observed to exhibit less movement and show increased weight gain and elevated fat deposition. In addition, we found that glucose tolerance was comparable between wild-type and SelM KO mice when fed either a normal or selenium-deficient diet.
Our results add to a growing body of evidence implicating selenium and selenoproteins in energy metabolism. An unexpected finding of the Nutritional Prevention of Cancer trial was that participants receiving a daily dose of 200 μg of selenium (as selenium-enriched bakers' yeast) over a 12-year period showed an increased likelihood of developing type 2 diabetes in comparison with those assigned a placebo (16). Moreover, Sepp1 has been shown to promote insulin resistance and was reported to be elevated in a cohort of patients with type 2 diabetes (17). Additionally, overexpression of the selenoprotein GPx1 in mice has also been found to induce insulin resistance and type 2 diabetes (18). Furthermore, genetic deletion of either Sepp1 (17) or GPx1 (19) results in improved glucose tolerance. Conversely, mice with a targeted deletion of another selenoprotein gene, the type 2 deiodinase (Dio2), were observed to have increased adiposity and to be less responsive to insulin stimulation in comparison with wild-type mice (20). Also, studies on transgenic mice in which selenoprotein expression was reduced by overexpression of a mutant i6A− selenocysteine tRNA revealed impaired glycemic control and increased insulin levels in these mutant mice relative to controls (21). Recent findings in this laboratory have documented that mice lacking selenocysteine lyase, an enzyme involved in cellular selenium recycling, exhibit diminished selenoprotein expression and develop metabolic syndrome when fed a low selenium diet (22). Finally, in humans, rare mutations in the selenocysteine insertion sequence-binding protein 2, a protein required for selenocysteine incorporation into selenoproteins, were found to produce a multisystem selenoprotein deficiency disorder with paradoxical symptoms that included enhanced insulin sensitivity and increased adiposity (23). In summary, the evidence to date suggests that certain selenoproteins (Sepp1 and GPx1) may act to promote adiposity and insulin resistance, whereas others (Dio2) may protect against it.
As noted previously, we originally hypothesized that SelM KO mice would show cognitive deficits based upon a limited number of pertinent studies in the literature. A prior study of transgenic mice overexpressing the human mutant gene presenilin-2 associated with familial Alzheimer disease found that SelM expression was significantly down-regulated, suggesting a potential neuroprotective function for SelM in the prevention of Alzheimer disease (24). Familial Alzheimer disease-linked presenilin-2 mutations have been observed to alter intracellular calcium homeostasis (25), and more recently presenilin-2 was shown to modulate calcium shuttling between the endoplasmic reticulum and mitochondria (26). Based upon our previous in vitro studies investigating SelM function (9), we anticipated that SelM deletion would negatively impact calcium regulation in brain regions involved in learning and memory and that SelM KO mice would exhibit cognitive deficits. An earlier study investigating selenoprotein mRNA expression in mice using the Allen Brain Atlas demonstrated that SelM levels are highest in the hippocampus, olfactory bulb, and cerebellum (7). We observed high levels of SelM protein in the olfactory bulb and cerebellum, but surprisingly SelM levels were relatively low in the hippocampus in comparison with other brain regions. Likewise, when the authors of the aforementioned study analyzed protein levels by Western blotting, they found that SelM expression was lower in the hippocampus relative to the hypothalamus and cerebellum (7). In our Western blot analysis, we observed moderate levels of SelM protein expression in the hypothalamus relative to other regions. However, our immunohistochemical studies revealed that SelM is highly expressed in the paraventricular and arcuate nuclei of the hypothalamus, two regions implicated in energy metabolism (27, 28). This finding may be particularly relevant in view of the increased adiposity that we observed in SelM KO mice.
Several recently published studies have documented a link between hypothalamic endoplasmic reticulum stress and obesity (29, 30). In this report, we demonstrate that SelM, an endoplasmic reticulum-resident selenoprotein with antioxidant properties, is highly expressed in discrete nuclei of the hypothalamus involved in energy metabolism. We also found that SelM deletion results in elevated serum leptin levels, increased adiposity, and hypothalamic leptin resistance. Among selenoproteins, SelM is most structurally similar to Sep15, and these two proteins form an evolutionary distinct selenoprotein family within the thioredoxin superfamily (8). In addition to SelM and Sep15, selenoprotein T and Dio2 constitute a group of endoplasmic reticulum-resident selenoproteins possessing thioredoxin-like folds (31). Of potential importance, altered hypothalamic thioredoxin activity has recently been linked to metabolic dysfunction. Studies on rodents overexpressing thioredoxin-interacting protein, an endogenous negative regulator of thioredoxin, site-specifically within the hypothalamus demonstrated decreases in hypothalamic thioredoxin activity, total energy expenditure, and brown fat metabolism (32). These metabolic changes corresponded with increases in body weight and fat deposition. Moreover, hypothalamic down-regulation of thioredoxin-interacting protein via infection with a lentivirus was shown to protect against diet-induced obesity. Further studies by this same group using transgenic mice conditionally overexpressing thioredoxin-interacting protein in Agrp-expressing neurons of the arcuate nucleus of the hypothalamus found changes in adiposity, energy expenditure, and leptin sensitivity in comparison with wild-type mice (33). Moreover, these mutant mice showed no significant changes in either feeding behavior or glucose tolerance, a metabolic phenotype with distinct parallels to our current results. Given the structural similarity between SelM and thioredoxin, SelM deletion could potentially adversely affect hypothalamic thioredoxin redox balance in a manner analogous to thioredoxin-interacting protein overexpression and promote metabolic dysfunction.
Within the hypothalamus, the paraventricular and arcuate nuclei exhibit high levels of SelM expression and also constitute two of the primary sites influenced by leptin. In rodents, leptin administration reduces feeding behavior and increases hypothalamic expression of corticotropin-releasing factor (34), a neuropeptide that mediates the endocrine response to stress by stimulating secretion of adrenocorticotrophic hormone (ACTH) and corticosterone (35). Consequently, leptin has also been demonstrated to influence the stress response by inducing the release of corticotropin-releasing factor from the hypothalamus and ACTH from the pituitary (36). Because of the increased leptin levels observed in SelM KO mice, we anticipated that base-line corticosterone levels might also be elevated. Moreover, increased corticosterone levels have also been reported in two well established rodent models of obesity, the leptin deficient ob/ob mouse (37) and the obese Zucker rat (38). To our surprise, morning base-line corticosterone levels were found to be reduced in SelM KO mice. Our finding of increased leptin levels with altered base-line corticosterone levels implies that the coupling between leptin receptor signaling and the HPA axis may be dysregulated in SelM KO mice. Of potential relevance, a high fat diet was reported to increase leptin levels and attenuate basal activity of the HPA axis as mice on the high fat diet had significantly decreased base-line corticosterone levels in comparison with mice receiving a low fat diet (39).
In conclusion, we report that SelM deletion results in increased body weight and fat deposition without apparent deficits in cognition or motor coordination. Our data suggest that the observed changes in body composition may be due in part to diminished energy expenditure as food consumption was comparable between genotypes, but SelM KO mice showed tendencies toward reduced locomotion during behavioral testing. Furthermore, the combination of elevated serum leptin levels, hypothalamic leptin resistance, and reduced morning levels of corticosterone in SelM KO mice point toward an altered equilibrium between leptin receptor signaling and the HPA axis. In sum, our findings suggest that SelM plays an important role in maintaining redox balance in key brain regions involved in energy metabolism.
Acknowledgment
We thank Robert A. Nichols from the University of Hawaii and Ann-Marie Zavacki from Brigham and Women's Hospital/Harvard Medical School for valuable discussion and commentary during manuscript preparation.
This work was supported, in whole or in part, by National Institutes of Health Grants RO1 DK47320, G12 MD007601, and G12 RR003061.
- Sepp1
- selenoprotein P
- SelM
- selenoprotein M
- GPx
- glutathione peroxidase
- HPA
- hypothalamic-pituitary-adrenal
- gWAT
- gonadal white adipose tissue
- ingWAT
- inguinal white adipose tissue
- PV
- parvalbumin
- ANOVA
- analysis of variance
- Dio2
- type 2 deiodinase.
REFERENCES
- 1. Jakupoglu C., Przemeck G. K., Schneider M., Moreno S. G., Mayr N., Hatzopoulos A. K., de Angelis M. H., Wurst W., Bornkamm G. W., Brielmeier M., Conrad M. (2005) Cytoplasmic thioredoxin reductases is essential for embryogenesis but dispensable for cardiac development. Mol. Cell. Biol. 25, 1980–1988 [DOI] [PMC free article] [PubMed] [Google Scholar]
- 2. Conrad M., Jakupoglu C., Moreno S. G., Lippl S., Banjac A., Schneider M., Beck H., Hatzopoulos A. K., Just U., Sinowatz F., Schmahl W., Chien K. R., Wurst W., Bornkamm G. W., Brielmeier M. (2004) Essential role for mitochondrial thioredoxin reductases in hematopoiesis, heart development, and heart function. Mol. Cell. Biol. 24, 9414–9423 [DOI] [PMC free article] [PubMed] [Google Scholar]
- 3. Yant L. J., Ran Q., Rao L., Van Remmen H., Shibatani T., Belter J. G., Motta L., Richardson A., Prolla T. A. (2003) The selenoprotein GPX4 is essential for mouse development and protects from radiation and oxidative damage insults. Free Radic. Biol. Med. 34, 496–502 [DOI] [PubMed] [Google Scholar]
- 4. Hill K. E., Zhou J., McMahan W. J., Motley A. K., Burk R. F. (2004) Neurological dysfunction occurs in mice with targeted deletion of the selenoprotein P gene. J. Nutr. 134, 157–161 [DOI] [PubMed] [Google Scholar]
- 5. Peters M. M., Hill K. E., Burk R. F., Weeber E. J. (2006) Altered hippocampus synaptic function in selenoprotein P deficient mice. Mol. Neurodegener. 1, 12. [DOI] [PMC free article] [PubMed] [Google Scholar]
- 6. Korotkov K. V., Novoselov S. V., Hatfield D. L., Gladyshev V. N. (2002) Mammalian selenoprotein in which selenocysteine (Sec) incorporation is supported by a new form of Sec insertion sequence element. Mol. Cell. Biol. 22, 1402–1411 [DOI] [PMC free article] [PubMed] [Google Scholar]
- 7. Zhang Y., Zhou Y., Schweizer U., Savaskan N. E., Hua D., Kipnis J., Hatfield D. L., Gladyshev V. N. (2008) Comparative analysis of selenocysteine machinery and selenoproteome gene expression in mouse brain identifies neurons as key functional sites of selenium in mammals. J. Biol. Chem. 283, 2427–2438 [DOI] [PubMed] [Google Scholar]
- 8. Ferguson A. D., Labunskyy V. M., Fomenko D. E., Araç D., Chelliah Y., Amezcua C. A., Rizo J., Gladyshev V. N., Deisenhofer J. (2006) NMR structures of the selenoproteins Sep15 and SelM reveal redox activity of a new thioredoxin-like family. J. Biol. Chem. 281, 3536–3543 [DOI] [PubMed] [Google Scholar]
- 9. Reeves M. A., Bellinger F. P., Berry M. J. (2010) The neuroprotective functions of selenoprotein M and its role in cytosolic calcium regulation. Antioxid. Redox Signal. 12, 809–818 [DOI] [PMC free article] [PubMed] [Google Scholar]
- 10. Paxinos G., Franklin K. (2004) The Mouse Brain in Stereotaxic Coordinates, 2nd Ed., Elsevier Academic Press, New York [Google Scholar]
- 11. Behrens M. M., Ali S. S., Dao D. N., Lucero J., Shekhtman G., Quick K. L., Dugan L. L. (2007) Ketamine-induced loss of phenotype of fast-spiking interneurons is mediated by NADPH-oxidase. Science 318, 1645–1647 [DOI] [PubMed] [Google Scholar]
- 12. Steullet P., Cabungcal J. H., Kulak A., Kraftsik R., Chen Y., Dalton T. P., Cuenod M., Do K. Q. (2010) Redox dysregulation affects the ventral but not dorsal hippocampus: impairment of parvalbumin neurons, γ oscillations, and related behaviors. J. Neurosci. 30, 2547–2558 [DOI] [PMC free article] [PubMed] [Google Scholar]
- 13. Carlson B. A., Schweizer U., Perella C., Shrimali R. K., Feigenbaum L., Shen L., Speransky S., Floss T., Jeong S. J., Watts J., Hoffmann V., Combs G. F., Gladyshev V. N., Hatfield D. L. (2009) The selenocysteine tRNA STAF-binding region is essential for adequate selenocysteine tRNA status, selenoprotein expression, and early age survival of mice. Biochem. J. 418, 61–71 [DOI] [PMC free article] [PubMed] [Google Scholar]
- 14. Pitts M. W., Raman A. V., Hashimoto A. C., Todorovic C., Nichols R. A., Berry M. J. (2012) Deletion of selenoprotein P results in impaired function of parvalbumin interneurons and alterations in fear learning and sensorimotor gating. Neuroscience 208, 58–68 [DOI] [PMC free article] [PubMed] [Google Scholar]
- 15. Wirth E. K., Conrad M., Winterer J., Wozny C., Carlson B. A., Roth S., Schmitz D., Bornkamm G. W., Coppola V., Tessarollo L., Schomburg L., J., Hatfield D. L., Schweizer U. (2010) Neuronal selenoprotein expression is required for interneuron development and prevents seizures and neurodegeneration. FASEB J. 24, 844–852 [DOI] [PMC free article] [PubMed] [Google Scholar]
- 16. Stranges S., Marshall J. R., Natarajan R., Donahue R. P., Trevisan M., Combs G. F., Cappuccio F. P., Ceriello A., Reid M. E. (2007) Effects of long-term selenium supplementation on the incidence of type 2 diabetes: a randomized trial. Ann. Intern. Med. 147, 217–223 [DOI] [PubMed] [Google Scholar]
- 17. Misu H., Takamura T., Takayama H., Hayashi H., Matsuzawa-Nagata N., Kurita S., Ishikura K., Ando H., Takeshita Y., Ota T., Sakurai M., Yamashita T., Mizukoshi E., Yamashita T., Honda M., Miyamoto K., Kubota T., Kubota N., Kadowaki T., Kim H. J., Lee I. K., Minokoshi Y., Saito Y., Takahashi K., Yamada Y., Takakura N., Kaneko S. (2010) A liver-derived secretory protein, selenoprotein P, causes insulin resistance. Cell Metab. 12, 483–495 [DOI] [PubMed] [Google Scholar]
- 18. McClung J. P., Roneker C. A., Mu W., Lisk D. J., Langlais P., Liu F., Lei X. G. (2004) Development of insulin resistance and obesity in mice overexpressing cellular glutathione peroxidase. Proc. Natl. Acad. Sci. U.S.A. 101, 8852–8857 [DOI] [PMC free article] [PubMed] [Google Scholar]
- 19. Loh K., Deng H., Fukushima A., Cai X., Boivin B., Galic S., Bruce C., Shields B. J., Skiba B., Ooms L. M., Stepto N., Wu B., Mitchell C. A., Tonks N. K., Watt M. J., Febbraio M. A., Crack P. J., Andrikopoulos S., Tiganis T. (2009) Reactive oxygen species enhance insulin sensitivity. Cell Metab. 10, 260–272 [DOI] [PMC free article] [PubMed] [Google Scholar]
- 20. Marsili A., Aguayo-Mazzucato C., Chen T., Kumar A., Chung M., Lunsford E. P., Harney J. W., Van-Tran T., Gianetti E., Ramadan W., Chou C., Bonner-Weir S., Larsen P. R., Silva J. E., Zavacki A. M. (2011) Mice with a targeted deletion of the type 2 deiodinase gene are insulin resistant and susceptible to diet induced obesity. PLoS One 6, e20832. [DOI] [PMC free article] [PubMed] [Google Scholar]
- 21. Labunskyy V. M., Lee B. C., Handy D. E., Loscalzo J., Hatfield D. L., Gladyshev V. N. (2011) Both maximal expression of selenoproteins and selenoprotein deficiency can promote development of type 2 diabetes-like phenotype in mice. Antioxid. Redox Signal. 14, 2327–2336 [DOI] [PMC free article] [PubMed] [Google Scholar]
- 22. Seale L. A., Hashimoto A. C., Kurokawa S., Gilman C. L., Seyedali A., Bellinger F. P., Raman A. V., Berry M. J. (2012) Disruption of the selenocysteine lyase-mediated selenium recycling pathway leads to metabolic syndrome in mice. Mol. Cell. Biol. 32, 4141–4154 [DOI] [PMC free article] [PubMed] [Google Scholar]
- 23. Schoenmakers E., Agostini M., Mitchell C., Schoenmakers N., Papp L., Rajanayagam O., Padidela R., Ceron-Gutierrez L., Doffinger R., Prevosto C., Luan J., Montano S., Lu J., Castanet M., Clemons N., Groeneveld M., Castets P., Karbaschi M., Aitken S., Dixon A., Williams J., Campi I., Blount M., Burton H., Muntoni F., O'Donovan D., Dean A., Warren A., Brierley C., Baguley D., Guicheney P., Fitzgerald R., Coles A., Gaston H., Todd P., Holmgren A., Khanna K. K., Cooke M., Semple R., Halsall D., Wareham N., Schwabe J., Grasso L., Beck-Peccoz P., Ogunko A., Dattani M., Gurnell M., Chatterjee K. (2010) Mutations in the selenocysteine insertion sequence-binding protein 2 gene lead to a multisystem selenoprotein deficiency disorder in humans. J. Clin. Investig. 120, 4220–4235 [DOI] [PMC free article] [PubMed] [Google Scholar]
- 24. Hwang D. Y., Cho J. S., Oh J. H., Shim S. B., Jee S. W., Lee S. H., Seo S. J., Lee S. K., Lee S. H., Kim Y. K. (2005) Differentially expressed genes in transgenic mice carrying human mutant presenilin-2 (N141I): correlation of selenoprotein M with Alzheimer's disease. Neurochem. Res. 30, 1009–1019 [DOI] [PubMed] [Google Scholar]
- 25. Zatti G., Burgo A., Giacomello M., Barbiero L., Ghidoni R., Sinigaglia G., Florean C., Bagnoli S., Binetti G., Sorbi S., Pizzo P., Fasolato C. (2006) Presenilin mutations linked to familial Alzheimer's disease reduce endoplasmic reticulum and Golgi apparatus calcium levels. Cell Calcium 39, 539–550 [DOI] [PubMed] [Google Scholar]
- 26. Zampese E., Fasolato C., Kipanyula M. J., Bortolozzi M., Pozzan T., Pizzo P. (2011) Presenilin-2 modulates endoplasmic reticulum (ER)-mitochondria interactions and Ca2+ cross-talk. Proc. Natl. Acad. Sci. U.S.A. 108, 2777–2782 [DOI] [PMC free article] [PubMed] [Google Scholar]
- 27. Balthasar N. (2006) Genetic dissection of neuronal pathways controlling energy homeostasis. Obesity 14, Suppl. 5, 222S–227S [DOI] [PubMed] [Google Scholar]
- 28. Sawchenko P. E. (1998) Toward a new neurobiology of energy balance, appetite, and obesity: the anatomists weigh in. J. Comp. Neurol. 402, 435–441 [PubMed] [Google Scholar]
- 29. Purkayastha S., Zhang H., Zhang G., Ahmed Z., Wang Y., Cai D. (2011) Neural dysregulation of peripheral insulin action and blood pressure by brain endoplasmic reticulum stress. Proc. Natl. Acad. Sci. U.S.A. 108, 2939–2944 [DOI] [PMC free article] [PubMed] [Google Scholar]
- 30. Zhang X., Zhang G., Zhang H., Karin M., Bai H., Cai D. (2008b) Hypothalamic IKKβ/NF-κB and ER stress link overnutrition to energy imbalance and obesity. Cell 135, 61–73 [DOI] [PMC free article] [PubMed] [Google Scholar]
- 31. Shchedrina V. A., Zhang Y., Labunskyy V. M., Hatfield D. L., Gladyshev V. N. (2010) Structure-function relations, physiological roles, and evolution of mammalian ER-resident selenoproteins. Antioxid. Redox Signal. 12, 839–849 [DOI] [PMC free article] [PubMed] [Google Scholar]
- 32. Blouet C., Schwartz G. J. (2011) Nutrient-sensing hypothalamic TXNIP links nutrient excess to energy imbalance in mice. J. Neurosci. 31, 6019–6027 [DOI] [PMC free article] [PubMed] [Google Scholar]
- 33. Blouet C., Liu S. M., Jo Y. H., Chua S., Schwartz G. J. (2012) TXNIP in Agrp neurons regulates adiposity, energy expenditure, and central leptin sensitivity. J. Neurosci. 32, 9870–9877 [DOI] [PMC free article] [PubMed] [Google Scholar]
- 34. Schwartz M. W., Seeley R. J., Campfield L. A., Burn P., Baskin D. G. (1996) Identification of targets of leptin action in rat hypothalamus. J. Clin. Investig. 98, 1101–1106 [DOI] [PMC free article] [PubMed] [Google Scholar]
- 35. Rivier C., Brownstein M., Spiess J., Rivier J., Vale W. (1982) In vivo corticotropin-releasing factor-induced secretion of adrenocorticotropin, β-endorphin, and corticosterone. Endocrinology 110, 272–278 [DOI] [PubMed] [Google Scholar]
- 36. Raber J., Chen S., Mucke L., Feng L. (1997) Corticotropin-releasing factor and adrenocorticotrophic hormone as potential central mediators of ob effects. J. Biol. Chem. 272, 15057–15060 [DOI] [PubMed] [Google Scholar]
- 37. Edwardson J. A., Hough C. A. (1975) The pituitary-adrenal system of the genetically obese (ob/ob) mouse. J. Endocrinol. 65, 99–107 [DOI] [PubMed] [Google Scholar]
- 38. Cunningham J. J., Calles-Escandon J., Garrido F., Carr D. B., Bode H. H. (1986) Hypercorticosteronuria and diminished pituitary responsiveness to corticotropin-releasing factor in obese Zucker rats. Endocrinology 118, 98–101 [DOI] [PubMed] [Google Scholar]
- 39. Auvinen H. E., Romijn J. A., Biermasz N. R., Pijl H., Havekes L. M., Smit J. W., Rensen P. C., Pereira A. M. (2012) The effects of a high fat diet on the basal activity of the hypothalamus-pituitary-adrenal axis in mice. J. Endocrinol. 214, 191–197 [DOI] [PubMed] [Google Scholar]