Abstract
The ribosome-inhibiting toxin ricin binds exposed β1→4 linked galactosyls on multiple glycolipids and glycoproteins on the cell surface of most eukaryotic cells. After endocytosis, internal cell trafficking is promiscuous, with only a small proportion of ricin proceeding down a productive (cytotoxic) trafficking route to the endoplasmic reticulum (ER). Here, the catalytic ricin A chain traverses the membrane to inactivate the cytosolic ribosomes, which can be monitored by measuring reduction in protein biosynthetic capacity or cell viability. Although some markers have been discovered for the productive pathway, many molecular details are lacking. To identify a more comprehensive set of requirements for ricin intoxication, the authors have developed an RNAi screen in Drosophila S2 cells, screening in parallel the effects of individual RNAi treatments alone and when combined with a ricin challenge. Initial screening of 806 gene knockdowns has revealed a number of candidates for both productive and nonproductive ricin trafficking, including proteins required for transport to the Golgi, plus potential toxin interactors within the ER and cytosol.
Keywords: ricin, RNAi, S2 cells, screen, PDI, ERAD
Introduction
The plant toxin ricin binds exposed cell surface β1→4-linked galactosyls on surface components of mammalian cells via its B chain (RTB), entering the cells when these components are endocytosed. A small proportion of endocytosed ricin traffics to the endoplasmic reticulum (ER).1 Here the toxic A chain (RTA) is released from RTB by protein disulfide isomerase (PDI),2 exposing a C-terminal hydrophobic patch on RTA, which interacts with the ER membrane.3 Subsequently, RTA crosses (dislocates) the ER membrane, entering the cytosol where it gains a catalytic conformation, aided by molecular chaperones.4 It then specifically depurinates a position in large ribosomal subunit 28S rRNA,5 resulting in loss of protein synthesis ability and, ultimately, cell death.
Overall knowledge of the intoxication pathway remains sparse. For example, ricin may traffic through the Golgi stack,6 but if so, it is not via known routes.7 A likely reason is ricin’s promiscuous surface binding, which promotes multiple pathways to the ER lumen. To gain further insight into ER events, we expressed RTA in the ER lumen of Saccharomyces cerevisiae,8 from where it dislocates. Dislocation requires engagement with COPII-interacting p24 proteins, leading to Golgi trafficking and subsequent ER return. RTA then uses the integral membrane HRD ubiquitylation complex of the ERAD (ER-associated protein degradation) machinery that clears the ER of misfolded proteins, targeting them to the cytosolic proteasomes for destruction. However, RTA dislocates independently of ubiquitylation. Dislocated RTA then avoids the proteosomal core and the final destructive steps of ERAD.8
Although this provides clues to RTA dislocation in mammalian cells, there are significant differences between yeast and mammalian systems: For example, yeast lacks the ER folding sensor UDP-glucose glycoprotein glucosyltransferase. Furthermore, because yeast lacks β1,4 galactosyltransferases, it does not express ricin receptors, so it cannot be probed for trafficking requirements that lie upstream of the ER dislocation step. We therefore examined a genetically tractable higher eukaryote and describe here the establishment of an RNAi screen of Drosophila S2 cells to probe for all the requirements of ricin intoxication.
Materials and Methods
RNAi library construction
The Expression Arrest RNAi library releases 1.0 and 2.0 were purchased as dsDNA templates in a 96-well format (Open Biosystems, Huntsville, AL).9 T7 polymerase was generated and purified as previously described.10 In vitro transcription reactions were performed in a 20-µL volume reaction with 3 µg DNA template, 5 mM rNTPs, 0.015 U/µL−1 yeast inorganic pyrophosphatase (Sigma, St. Louis, MO), and 0.2 U/µL−1 RNasin in a transcription buffer (30 mM HEPES [pH 7.8], 100 mM potassium glutamate, 15 mM magnesium acetate, 25 mM EDTA, 1 mM dithiothreitol [DTT]). Activity of T7 polymerase was assessed using these conditions and an optimal concentration per reaction employed for the library synthesis. Reactions were incubated at 37 °C for 4 h. RNAi was then diluted five times by the addition of DEPC-treated H2O. Yield was assessed by agarose gel electrophoresis.
Growth of S2 cells and cytotoxicity assays
S2 cells were maintained in Drosophila−SFM (Invitrogen, Carlsbad, CA) containing 18 mM glutamine (Sigma) in rotating flasks (150 rpm, 28 °C). For cytotoxicity experiments, cells were seeded into 96-well plates (15 000 cells/well) and grown (3 days), and a range of concentrations of ricin was added. After 24 h, cell viability was assayed using MTS reagent (Promega, Madison, WI) and a Mithras LB940 multimode reader (Berthold Technologies, Bad Wildbad, Germany). For RNAi screening experiments, cells were seeded into pairs of wells, one containing specific dsRNAi (750 ng/well) and the other an equivalent volume of water. After 3 days, ricin was applied and cell viability was measured.
Western blot
Cells were seeded (375 000 cells/well) into two wells of a six-well plate, one containing specific RNAi targeting torp4a and the other an equivalent volume of water, and grown for 3 days. After gentle centrifugation (100 g, 5 min), extracts were taken by resuspending the cell pellets in 0.5 mL cold 10 mM Tris-HCl (pH 7.5), 50 mM NaCl, and 1% Triton X-100 containing protease inhibitor cocktail (Roche, Basel, Switzerland). Cell debris was removed (10 000 g, 1 min), and protein concentrations of the soluble extracts were determined by colorimetric assay (Bio-Rad, Hercules, CA). Samples (10 µg) were separated by sodium dodecyl sulfate polyacrylamide gel electrophoresis (SDS-PAGE) and immunoblotted. Torp4a protein was revealed by serial probing with rabbit anti-torp4a antibodies and peroxidase-conjugated anti-rabbit antibodies followed by ECL (GE Healthcare, Piscataway, NJ) development.
Results and Discussion
Adult Drosophila and S2 cells are sensitive to ricin
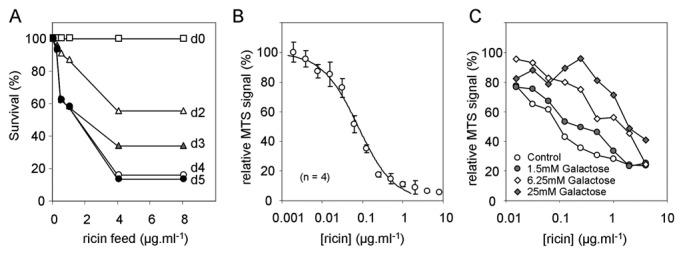
Fruit flies might be sensitive to ricin challenge because they express β1,4-galactosyltransferases, and their ribosomes are sensitive to RTA.11 Isogenized wild-type Canton-S flies were starved (8 h) to force a feeding response and were then fed once with 1% sucrose (controls) or with 1% sucrose containing ricin, followed by a daily maintenance diet of 1% sucrose. Drosophila show dose-dependent sensitivity to ricin; most died 4 days after an initial toxin feed of 4 µg/mL−1 ricin (Fig. 1A). By day 5, all surviving flies fed with this dose showed uncoordinated movements; none recovered from CO2 anesthesia.
Fig. 1.

Flies and S2 cells are sensitive to ricin. (A) Starved adult flies were fed with one meal of ricin at a range of concentrations in 1% sucrose, then fed daily with a maintenance diet of 1% sucrose, and scored for survival. (B). Dose response of S2 cells to a 24-h exposure to a range of concentrations of ricin. (C) Dose responses of S2 cells to a 24-h exposure to a range of concentrations of ricin in the presence of increasing concentrations of galactose.
Drosophila S2 cells are also sensitive to a 24-h challenge with ricin (Fig. 1B). Addition of galactose during ricin challenge gave a dose-dependent protective effect (Fig. 1C). Thus, intoxication of fly cells depends on galactose binding as it does in mammalian cells.
Establishing screening conditions
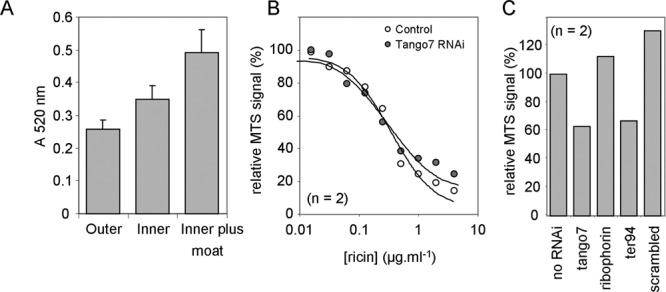
When S2 cells seeded at 15 000 cells per well in 96-well plates were grown for 4 days, cells in the outer wells of a plate grew more slowly than those in the central wells (Fig. 2A). Cells were therefore grown in the central wells only, filling the outer wells with sterile water, resulting in optimal uniform growth.
Fig. 2.

Establishing screening conditions. (A) Mean viabilities of cells grown on the outer wells (outer, n = 36), remaining wells (inner, n = 60), or inner wells (n = 60) of a plate whose outer wells were occupied with water (inner plus moat). Bars, ±1 SD. (B) S2 cells were grown for 3 days in the presence or absence of RNAi against Tango7 and then treated for 24 h with a range of concentrations of ricin prior to the MTS assay. (C) Relative MTS signals of S2 cells treated with RNAi only.
A number of genes were selected to test RNAi conditions, along with “scrambled” RNAi generated from a random arrangement of nucleotides from the sequence encoding human syntaxin 16. Cells grown (3 days) in the presence of dsRNA were treated (24 h) with a range of ricin concentrations. Golgi Tango7 RNAi did not alter the response to ricin challenge (Fig. 2B); similarly, dsRNAs directed against the ER ribophorin, the cytosolic TER94, and “scrambled” were ineffective (not shown). When assays were performed without ricin challenge, some RNAi treatments had clear growth effects (Fig. 2C), showing that for each RNAi knockdown screened with ricin, there should be a coeval control lacking ricin.
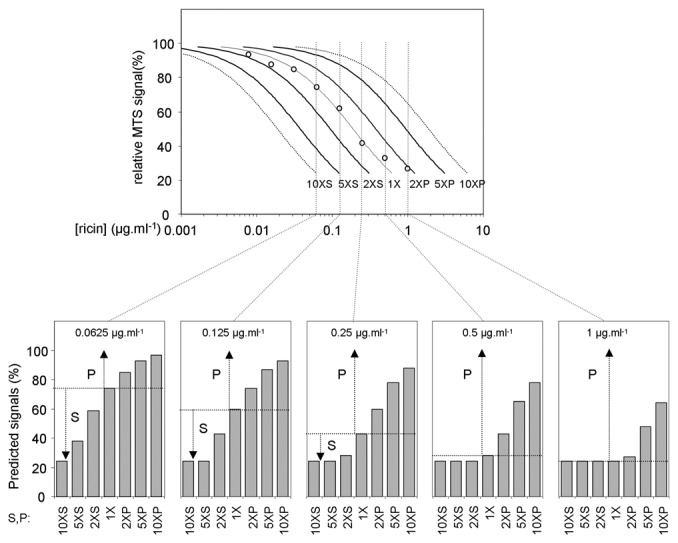
To determine the screening concentration of ricin, we treated cells with increasing doses of ricin (Fig. 3) and modeled the effects of RNAi that would provide 2-, 5-, and 10-fold protection (P) or sensitization (S). At a dose of 1 µg/mL−1 ricin, protective RNAi effects of 2-fold or less would not be measurable, whereas after treatment with 62.5 ng/mL−1 ricin, sensitizing RNAi effects would be most easily measured. We chose 0.25 µg/mL−1 ricin for screening, biasing expected results toward protective effects of 2-fold or more while still being able to recognize sensitizing effects.
Fig. 3.

Modeling the screen to determine ricin dose. Upper: S2 cells were treated with a range of ricin concentrations, and viability was measured by the MTS assay, generating a cytotoxicity curve (open circles). This curve was then shifted to the right or left to model likely results from 2-, 5-, or 10-fold shifts in sensitivity (2XS, 5XS, and 10XS sensitizing shifts; 2XP, 5XP, and 10XP protective shifts). Lower: Vertical slices (dotted lines, upper panel) were used to model expected results of treating with a range of concentrations of ricin. Arrows, magnitude of maximal protective (P) or sensitizing (S) effects.
Preliminary screening of a library of individual RNAi molecules
Cells were grown in pairs of wells, both containing the same specific RNAi. One member of the pair was then treated with ricin, and subsequent viability was measured. Screening plates also contained six control wells without RNAi treatment and a further six without RNAi treatment subsequently challenged with ricin. Values from control wells on each plate were used to determine a Z′ factor.12 Plates that generated a Z′ factor of greater than 0.5 were considered for further evaluation. Of 34 plates screened, only 1 failed this test.
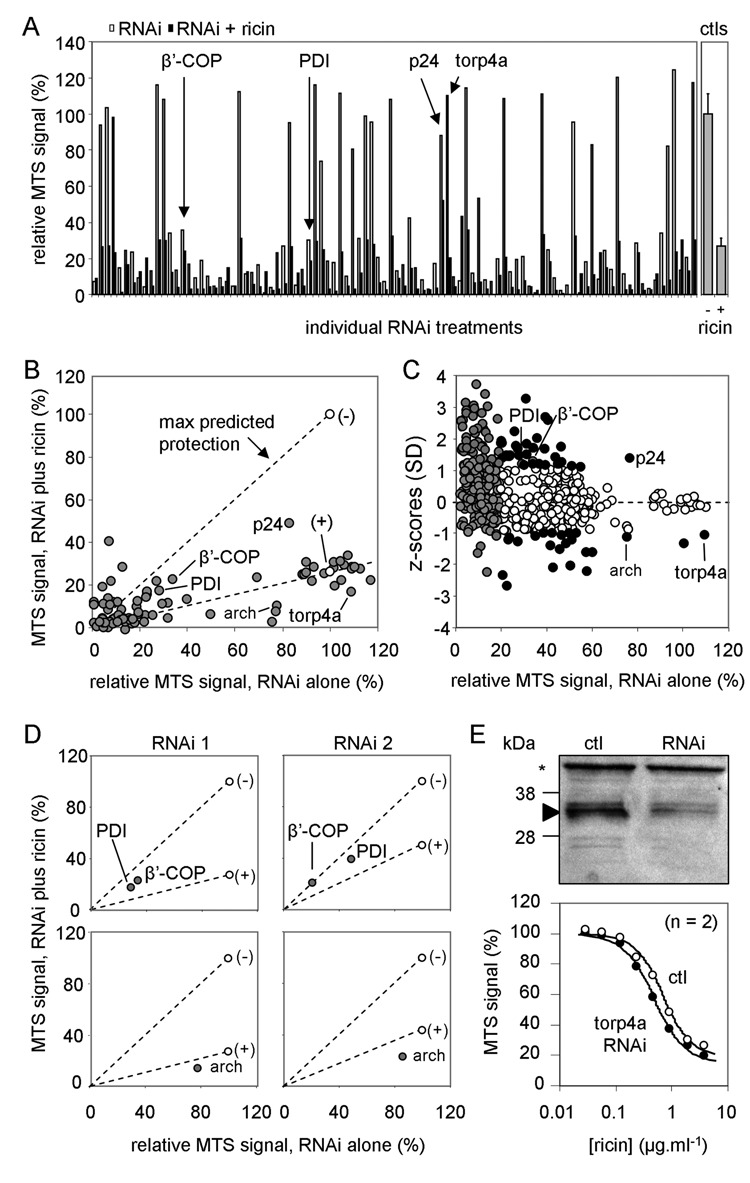
Initial screening of 96 randomly selected RNAi treatments is shown in Figure 4A. Most RNAi treatments gave low MTS signals. Results are displayed as a scatter, plotting the relative effect of the combined RNAi/ricin treatment versus the relative effect of RNAi alone (Fig. 4B). Completely protective RNAi treatments would be expected along the line of unity connecting the (–) “cells-alone” control to the origin, and ineffective RNAi treatments should lie along the line connecting the (+) “cells plus ricin” control to the origin. Protective RNAi treatments should accumulate in the segment between these lines, and sensitizing RNAi treatments should collect in the segment between the (+)-origin line and the abscissa. A few RNAi treatments sat outside these ranges, with ricin-treated samples growing more strongly than nontreated cells. These false positives were from highly toxic RNAi treatments, reflecting difficulties in accurate measurement of small MTS signals.
Fig. 4.

Screening results. (A) Left panel: MTS signals from initial screening of 96 RNAi treatments are displayed as pairs of bars (white, RNAi treatment alone; black, RNAi treatment with subsequent ricin challenge). A number of candidate hits are highlighted (arrows). Right panel: Corresponding ricin-treated controls (no RNAi treatment). (B) Signals from A plotted in scatter format, defining the sectors into which protective and sensitizing hits are likely to fall. (–), cells alone; (+), cells treated with ricin. (C) Standard z scores plotted versus relative growth of RNAi-treated cells for all 768 RNAi treatments tested. Gray circles: treatments rejected because the RNAi signal alone was 25% or less that of non-RNAi-treated cells. White circles: treatments rejected that lie within 1 SD from the mean value. Black circles: 45 remaining candidate treatments that may influence ricin cytotoxicity. (D) Testing alternative RNAi treatments: upper panels, RNAi treatments against PDI and β′-COP taken from B (RNAi 1, left) and from different RNAi treatments targeted against the same genes (RNAi 2, right); lower panels, RNAi 1 (left panel) from B against archipelago (arch) and an alternative RNAi 2 against the same gene (right panel). (E) Upper panel: Cell extracts (10 µg) of S2 cells treated or not (ctl) with torp4a RNAi were electrophoresed, immunoblotted, and probed for torp4a protein. *, cross-reacting protein. Approximate migration of size markers is shown on the left. Lower graph: S2 cells treated or not with torp4a RNAi were subsequently treated with ricin, and viabilities were determined by the MTS assay.
For each RNAi treatment pair, a standard z score was determined—the difference between treatment value (relative growth [%] after ricin treatment compared to treatment with RNAi alone) and the mean value of all treatments divided by the SD of all the treatment values. These are presented in a scatter versus relative growth after individual RNAi treatment (Fig. 4C). Practical considerations limit accuracy of cytotoxicity curves where the RNAi-treated but non-ricin-treated controls give an MTS signal of about a quarter of that of non-RNAi-treated controls, allowing us to reject 541 treatments (gray circles). Because RNAi treatment reduces rather than abolishes expression of target genes, sensitivity changes to ricin might be small. Furthermore, promiscuous binding/trafficking and multiple cytosolic interactions of ricin lead to small changes after interfering with genes controlling toxicity.1,4 Rather than use a z score threshold of 2 or 3, we therefore adopted an unusually low threshold of 1, at the risk of increasing the false-positive rate, to ensure capture of such small changes. This led us to reject only those 182 treatments that lay between 0 and 1 SD from the mean score (white circles), leaving 45 RNAi treatments from an initial screening population of 806 that reflect potentially sensitizing and protective RNAi treatments (black circles).
Confirmation of selected targets
Table 1 shows candidate “hits” with human orthologs, ranked according to z score. A selection is marked in Figure 4A–D. Supplementary Table S1 (online at http://jbx.sagepub.com/content/by/supplemental-data) shows candidates with no known human orthologs: Most appear to have only arthropod orthologs and may be uninformative.
Table 1.
Candidate RNAi Treatments with Human Orthologs That Influence Ricin Toxicity
| Target Gene | Name | Human Ortholog | Candidate Role |
|---|---|---|---|
| z>3 | |||
| CG8428 | Spinster | Spinster homolog 1 | Endocytosis |
| 3>z>2 | |||
| CG11184 | Upf3 | UPF3 regulator of nonsense transcripts homolog B (yeast) | Gene silencing by miRNA |
| CG30429 | None | MORN repeat containing 3 | Not known |
| CG10302 | Bicoid stability factor | Leucine-rich PPR-motif containing | mRNA 3′-UTR binding |
| CG30338 | None | RWD domain containing 2B | Not known |
| CG31683 | None | Phospholipase A2, group XV | Phospholipase |
| CG10078 | Phosphoribosyl amidotransferase 2 | Phosphoribosyl pyrophosphate amidotransferase | Nucleoside metabolic process |
| CG5809 | CaBP1 | Protein disulfide isomerase family A, member 6 | Reduction of ricin intrachain disulfide |
| CG31787 | None | ERP2 (yeast) | ER-to-Golgi transport |
| CG3570 | None | UPF0532 protein C7orf60 | Not known |
| CG6699 | β′−coatomer protein | Coatomer protein complex, subunit beta 2 (beta prime) | ER-to-Golgi transport |
| CG8726 | None | PX domain containing serine/threonine kinase | Protein kinase |
| CG13708 | None | Leucine-rich repeat containing 49 | Not known |
| −2<z<−1 | |||
| CG3024 | Torp4a | Torsin family 1, member A (torsin A) | Chaperone-mediated protein folding |
| CG18654 | None | Diacylglycerol kinase, beta 90 kDa | Diacylglycerol kinase |
| CG5189 | None | Roadblock domain containing 3; Rab25 | Golgi apparatus; endosome? |
| CG2173 | Rs1 | DEAD (Asp-Glu-Ala-Asp) box polypeptide 27 | RNA helicase; ribosome biogenesis |
| CG3766 | Scattered | Vacuolar protein-sorting 54 homolog | Endosome/Golgi transport and sorting |
| CG33008 | None | Transmembrane protease, serine 4 | Serine-type endopeptidase |
| CG14396 | Ret oncogene | Ret proto-oncogene | Signal transduction |
| CG5403 | Retained | AT-rich interactive domain 3A (BRIGHT-like) | Transcription activator |
| CG15010 | Archipelago | F-box and WD repeat domain containing 7 | Ubiquitin-protein ligase |
| −3<z<−2 | |||
| CG4046 | Ribosomal protein S16 | Ribosomal protein S16 | Structural constituent of ribosome |
| CG11079 | None | 5,10-Methenyltetrahydro-folate synthetase (5-formyltetrahydrofolate cyclo-ligase) | Unknown |
| CG3029 | Orange | Adaptor-related protein complex 3, sigma 2 subunit | Intracellular protein transport |
Bold type indicates genes tested with two different RNAi molecules.
CG5809 encodes a PDI family member. In mammalian cells, PDI reduces the interchain disulfide bond between RTA and RTB.2 We tested a different RNAi against PDI (from the Sheffield RNAi Screening Facility, Sheffield, UK), confirming that knockdown leads to protection against ricin in flies (Fig. 4D, upper panels).
CG6699 encodes the essential β′-COP subunit of the COPI coatomer complex that binds p24 cytosolic tails, allowing Golgi-to-ER transport of p24 proteins. Knockdown by alternative RNAi confirmed reproducibility (Fig. 4D). CG31787 encodes a family member of the fly p24 proteins, type I transmembrane proteins with ill-defined roles in Golgi-ER cargo transport.13 Its yeast ortholog is Erp2p, which promotes transport of RTA to the Golgi prior to recycling and dislocation.8 Thus, in fly cells, entry to the Golgi from the ER may require a specific interaction with a p24 protein. The protective effects of RNAi against its expression and against expression of β′-COP in fly cells point to ER-Golgi cycling of RTA as a common feature of ricin intoxication.
The cytosolic fate of RTA is controlled by ubiquitin signals.4 To test reproducibility for sensitizing RNAi hits, two different RNAi molecules against the low z score ubiquitin ligase-encoding archipelago (“arch”; Fig. 4B) were compared (Fig. 4D, lower panels). Both sensitized cells slightly to ricin. Examining the remaining sensitizing hits revealed CG3024 (torp4a, an AAA-ATPase with a role in protein folding in the ER lumen; Fig. 4B) as a presumptive ER modulator of ricin cytotoxicity. Substantial torp4a knockdown gave only a modest (1.4-fold) sensitizing effect (Fig. 4E), a minor effect consistent with low confidence in designating this a hit from its z score position in Figure 4C.
We have designed and performed a preliminary screen of approximately 6% of Drosophila melanogaster genes by RNAi knockdown, controlling in parallel for the effects of RNAi alone. If our screen had tested only specific RNAi treatment with subsequent ricin challenge, then from the first 96 RNAi treatments in Figure 4A, some of the false positives and only RNAi against the p24-encoding CG31787 would have been identified as potentially protective, because these are the sole examples that gave a signal greater than that of ricin-treated control cells. The growth inhibitory effects of RNAi treatments against PDI and β′-COP would have led to the erroneous interpretation that reduced levels of these lead to ricin sensitivity. Indeed, the majority of RNAi treatments would be deemed to be highly sensitizing, giving signals substantially lower than ricin-treated controls. A similar strategy that included testing the effects of gene depletion alone14 underscores the need for inclusion of such a counterscreen, which broadens the dynamic range and allows us to identify false positives more easily, thus improving the ability to identify likely candidates for genes involved in the ricin intoxication process.
Acknowledgments
We thank Stephen Brown, Sheffield RNAi Screening Facility, UK, for supplying alternative RNAi templates for knockdown of archipelago and the PDI and β′-COP orthologs. VP and AD were supported by UK Department of Health and Home Office grants to LMR, JML, and KGM; LB by UK Medical Research Council project grant G0400580 to STS; MMO by National Institutes of Health Grant 5U01AI65869-02 to LMR and JML, and RAS was supported by Wellcome Trust Programme Grant 080566/Z/06/Z to LMR and JML.
References
- 1. Spooner R. A., Smith D. C., Easton A. J., Roberts L. M., Lord J. M. Retrograde Transport Pathways Utilised by Viruses and Protein Toxins. Virol. J. 2006, 3, 26. [DOI] [PMC free article] [PubMed] [Google Scholar]
- 2. Spooner R. A., Watson P. D., Marsden C. J., Smith D. C., Moore K. A., Cook J. P., Lord J. M., Roberts L. M. Protein Disulphide-Isomerase Reduces Ricin to Its A and B Chains in the Endoplasmic Reticulum. Biochem. J. 2004, 383, 285–293 [DOI] [PMC free article] [PubMed] [Google Scholar]
- 3. Mayerhofer P. U., Cook J. P., Wahlman J., Pinheiro T. T., Moore K. A., Lord J. M., Johnson A. E., Roberts L. M. Ricin A Chain Insertion into Endoplasmic Reticulum Membranes Is Triggered by a Temperature Increase to 37°C. J. Biol. Chem. 2009, 284, 10232–10242 [DOI] [PMC free article] [PubMed] [Google Scholar]
- 4. Spooner R. A., Hart P. J., Cook J. P., Pietroni P., Rogon C., Hohfeld J., Roberts L. M., Lord J. M. Cytosolic Chaperones Influence the Fate of a Toxin Dislocated from the Endoplasmic Reticulum. Proc. Natl. Acad. Sci. U. S. A. 2008, 105, 17408–17413 [DOI] [PMC free article] [PubMed] [Google Scholar]
- 5. Endo Y., Tsurugi K. RNA N-Glycosidase Activity of Ricin A-Chain: Mechanism of Action of the Toxic Lectin Ricin on Eukaryotic Ribosomes. J. Biol. Chem. 1987, 262, 8128–8130 [PubMed] [Google Scholar]
- 6. van Deurs B., Tonnessen T. I., Petersen O. W., Sandvig K., Olsnes S. Routing of Internalized Ricin and Ricin Conjugates to the Golgi Complex. J. Cell. Biol. 1986, 102, 37–47 [DOI] [PMC free article] [PubMed] [Google Scholar]
- 7. Chen A., AbuJarour R. J., Draper R. K. Evidence That the Transport of Ricin to the Cytoplasm Is Independent of Both Rab6A and COPI. J. Cell. Sci. 2003, 116, 3503–3510 [DOI] [PubMed] [Google Scholar]
- 8. Li S., Spooner R. A., Allen S. C., Guise C. P., Ladds G., Schnoder T., Schmitt M. J., Lord J. M., Roberts L. M. Folding-Competent and Folding-Defective Forms of Ricin A Chain Have Different Fates after Retrotranslocation from the Endoplasmic Reticulum. Mol. Biol. Cell. 2010, 21, 2543–2554 [DOI] [PMC free article] [PubMed] [Google Scholar]
- 9. Foley E., O’Farrell P. H. Functional Dissection of an Innate Immune Response by a Genome-Wide RNAi Screen. PLoS Biol. 2004, 2, E203. [DOI] [PMC free article] [PubMed] [Google Scholar]
- 10. He B., Rong M., Lyakhov D., Gartenstein H., Diaz G., Castagna R., McAllister W. T., Durbin R. K. Rapid Mutagenesis and Purification of Phage RNA Polymerases. Protein Expr. Purif. 1997, 9, 142–151 [DOI] [PubMed] [Google Scholar]
- 11. Moffat K. G., Gould J. H., Smith H. K., O’Kane C. J. Inducible Cell Ablation in Drosophila by Cold-Sensitive Ricin A Chain. Development 1992, 114, 681–687 [DOI] [PubMed] [Google Scholar]
- 12. Zhang J. H., Chung T. D., Oldenburg K. R. A Simple Statistical Parameter for Use in Evaluation and Validation of High Throughput Screening Assays. J. Biomol. Screen. 1999, 4, 67–73 [DOI] [PubMed] [Google Scholar]
- 13. Strating J. R., Martens G. J. The p24 Family and Selective Transport Processes at the ER-Golgi Interface. Biol. Cell. 2009, 101, 495–509 [DOI] [PubMed] [Google Scholar]
- 14. Whitehurst A. W., Bodemann B. O., Cardenas J., Ferguson D., Girard L., Peyton M., Minna J. D., Michnoff C., Hao W., Roth M. G., et al. Synthetic Lethal Screen Identification of Chemosensitizer Loci in Cancer Cells. Nature 2007, 446, 815–819 [DOI] [PubMed] [Google Scholar]


