

Abstract
Ultrasound imaging has been proposed as a rapid, portable alternative imaging modality to examine stroke patients in pre-hospital or emergency room settings. However, in performing transcranial ultrasound examinations, 8%–29% of patients in a general population may present with window failure, in which case it is not possible to acquire clinically useful sonographic information through the temporal bone acoustic window. In this work, we describe the technical considerations, design and fabrication of low-frequency (1.2 MHz), large aperture (25.3 mm) sparse matrix array transducers for 3-D imaging in the event of window failure. These transducers are integrated into a system for real-time 3-D bilateral transcranial imaging—the ultrasound brain helmet—and color flow imaging capabilities at 1.2 MHz are directly compared with arrays operating at 1.8 MHz in a flow phantom with attenuation comparable to the in vivo case. Contrast-enhanced imaging allowed visualization of arteries of the Circle of Willis in 5 of 5 subjects and 8 of 10 sides of the head despite probe placement outside of the acoustic window. Results suggest that this type of transducer may allow acquisition of useful images either in individuals with poor windows or outside of the temporal acoustic window in the field.
Keywords: Transcranial, Temporal acoustic window, Real-time 3-D ultrasound, Contrast-enhanced
INTRODUCTION
As the second-leading cause of death in developed nations, stroke constitutes a significant public health concern (World Health Organization 2008). In the United States, stroke constitutes 17% of overall national health spending (Heidenreich et al. 2011). At present, stroke diagnosis commonly relies on imaging with X-ray computed tomography (CT) to rule out hemorrhage and enable administration of thrombolytics (Smith et al. 2003; Adams et al. 2005). Ischemic stroke comprises approximately 87% of all stroke cases (Roger et al. 2011). Of these, 68% affect the anterior circulation, supplied by the left and right internal carotid arteries, with 96% of these occlusions occurring in the middle cerebral arteries (Bogousslavsky et al. 1988). Given an aging population and the high incidence of stroke in developed nations (Carandang et al. 2006; Tobias et al. 2007; Hallstrom et al. 2008; Heuschmann et al. 2008), providing rapid diagnostic imaging of stroke is essential. If a stroke can be determined to arise from the presence of a thrombus or embolus and hemorrhage can be ruled out within a specified time window—currently 4.5 h in the United States (Davis and Donnan 2009; Del Zoppo et al. 2009)—tissue plasminogen activator (tPA) can be administered intravenously to lyse the thrombus, decreasing recovery times and improving patients’ functional outcomes (Hacke et al. 1995). Approximately 50% of patients receiving tPA experience full recovery within 3 mo (NINDS rt-PA Stroke Study Group 1995).
In recent years, investigators have explored using transcranial ultrasound imaging to fill a niche as a portable, inexpensive approach to stroke imaging, the feasibility of which has been demonstrated in various pre-hospital settings including ambulances, emergency helicopters and in remote environments (Holscher et al. 2008; Bowman 2010; Hoyer et al. 2010; Chenaitia et al. 2011; Wilson et al. 2011; Schlachetzki et al. 2012). By reducing the time to diagnosis and increasing confidence in the diagnosis, prehospital imaging might increase the number of eligible patients receiving tPA, currently at 1%–7% (NINDS rt-PA Stroke Study Group 1995; Katzan et al. 2000; Koennecke et al. 2001). Three-dimensional ultrasound is particularly well-suited to emergency medicine, because an operator with limited training has a greater likelihood of capturing clinically useful information within a 3-D volume than within a single 1-D scan or 2-D slice. In the hospital setting, 3-D ultrasound has been cited as a potentially faster and clinically acceptable alternative to X-ray for examining blood flow in intracranial collateral arteries (Wessels et al. 2004).
However, the viability of pre-hospital transcranial ultrasound imaging is dependent on the ability of the operators—emergency medical personnel—in acquiring diagnostically useful images. Researchers at the University of California-San Diego and Regensburg University have recently demonstrated proof-of-concept use of portable 2-D ultrasound in visualizing intracranial vessels in real-time either at the site of the emergency or during patient transport by ambulance or helicopter (Holscher et al. 2008). A follow-up publication reported a sensitivity of 90% and a specificity of 98% in detecting MCA occlusions in the field (Schlachetzki et al. 2012). This group is currently attempting to train paramedics to perform such exams (Holscher 2012); the outcome of this training program will provide an important indicator as to the feasibility of performing transcranial ultrasound examinations by operators with limited training. Manufacturers of ultrasound scanners have also investigated reducing the operator dependence of ultrasound scans in various anatomical regions, including designing conformal arrays for abdominal imaging (Daft 2010), developing an automated breast scanner (Porter and Seck 2009) and providing on-screen feedback of probe placement in transcranial imaging (Vignon et al. 2009). If emergency medical personnel could acquire diagnostically useful images in the field, those images might be transferred to the stroke team at the hospital via telemedicine, as has recently been demonstrated with a portable CT scanner and a telemedicine unit (Walter et al. 2012). However, at this time it is unknown whether transcranial ultrasound scans may be reliably performed by individuals with limited training.
Additionally, transcranial ultrasound faces physical challenges in overcoming the attenuation and aberration introduced by the skull. Aaslid et al. first presented the temporal acoustic window as a thinner, more homogeneous region of the temporal bone relative to the rest of the skull through which one-dimensional transcranial Doppler (1-D TCD) examinations could be performed (Aaslid et al. 1982). It was later described as a roughly circular region 2–3 cm in diameter having a thickness of 2–3 mm (Becker and Griewing 1998; Furuhata 1998). The decreased attenuation within the window results from structural variation: the skull within the window consists of an inner and an outer table of compact bone with little or no trabecular bone between them (Becker and Griewing 1998). Grolimund reported a one-way mean attenuation of 7 dB due to transmitting through the window at 2 MHz (Grolimund 1986).
However, the simplified view of the temporal acoustic window as a several centimeter-wide region free of trabeculae does not always hold; in many patients a suitable imaging window may not be found. Temporal bone window failure rates in the range of 8% to 29% have been reported (Table 1) (Hashimoto et al. 1992; Seidel et al. 1995; Baumgartner et al. 1997; Marinoni et al. 1997; Postert et al. 1997; Gahn et al. 2000; Krejza et al. 2007; Wijnhoud et al. 2008). Of individuals with window failure, 39% had bilateral window failure in a study of 624 subjects (Marinoni et al. 1997). Previous studies of window failure were performed in the 2–3 MHz range; none used 3-D ultrasound. While microbubble contrast-enhancement may reduce window failure rates, it does not eliminate window failure in all patients (Baumgartner et al. 1997; Postert et al. 1997; Gahn et al. 2000). Of particular interest is the study of Wijnhoud et al., in which a window failure rate of 18% was found in 182 subjects having a transient ischemic attack or minor ischemic stroke, thus investigating window failure in a population representative of stroke patients. Results of this study indicate that absence of window failure may be predicted by three factors: skull thickness, age and gender.
Table 1.
Comparison of window failure rates in previous transcranial ultrasound studies
| Study | Number of subjects | Study location | Transmit frequency | 2-D imaging or 1-D TCD | Window failure rate |
|---|---|---|---|---|---|
| Hashimoto et al. 1992 | 423 | Japan | 2.0 MHz | 1-D TCD | 29% |
| Seidel et al. 1995 | 84 | Germany | 2.5 MHz | 2-D imaging | 20% |
| Baumgartner et al. 1997 | 33 | Switzerland | 2.0–2.5 MHz | 2-D imaging | 34% (with contrast agent) |
| Marinoni et al. 1997 | 624 | Italy | 2.0 MHz | 1-D TCD | 8% |
| Postert et al. 1997 | 172 | Germany | 2.25 MHz | 2-D imaging | 12% |
| Hoksbergen et al. 1999 | 112 | The Netherlands | 2.0–2.5 MHz | 2-D imaging | 11% |
| Gahn et al. 2000 | 171 | Germany | 2.0–2.5 MHz | 2-D imaging | 29% |
| Krejza et al. 2007 | 90 | United States | 2.0 MHz (1-D TCD) 2.5 MHz (2-D imaging) |
Both | 11% (both 1-D TCD and 2-D imaging) |
| Wijnhoud et al. 2008 | 186 (stroke patients) | The Netherlands | 2.0 MHz | 1-D TCD | 18% |
In previous work, we demonstrated simultaneous bilateral real-time 3-D transcranial ultrasound, the ultrasound brain helmet (Smith et al. 2009). More recently, we described the ability to simultaneously acquire two 3-D transcranial volumes from either side of the head (Fig. 1a) and fuse these volumes into a single 3-D visualization offline both with and without contrast agent (Lindsey et al. 2011). In real-time, two orthogonal imaging planes are displayed from each transducer (Fig. 1b). This scanning configuration provides advantages by decreasing the scan depth required for a single transducer, allowing for assessment of asymmetry between blood flow on the left and right sides of the head (Kenton et al. 1997), and providing the possibility of overcoming a single unfavorable temporal acoustic window. In Figure 2, we present two simultaneously-acquired bilateral real-time 3-D transcranial ultrasound volumes acquired with this system during a previous study according to an IRB-approved protocol (Lindsey et al. 2011). These volume renderings show results of scanning via favorable and less favorable windows in two different adult female subjects scanned with micro-bubble contrast enhancement at 1.8 MHz. In the new study presented in this article, we will attempt to avoid results such as the window failure case (Fig. 2b) by scanning with custom-designed, lower frequency matrix arrays. While reducing transmit frequency (alternatively, increasing wavelength) produces a proportional increase in spatial resolution, in this work we will maintain constant imaging resolution by concomitantly increasing the size of the aperture in the designed arrays. In the expression for lateral resolution λz/D, D is increased to offset the increase in λ.
Fig. 1.

(a) Array placement over both temporal acoustic windows, and (b) volume acquired by each array during such a scan, with a steerable Doppler beam shown in blue.
Fig. 2.

Three-dimensional contrast-enhanced (Definity) renderings acquired from scanning two different healthy volunteers (both 24-y-old females) with 2.3 MHz echo and 1.8 MHz Doppler according to an IRB-approved protocol. Subject (a) had significantly more favorable windows than Subject (b), in which the major cerebral arteries appear small and Doppler signal dropout is apparent. MCA = middle cerebral artery; ICA = internal carotid artery.
While presenting window failure rate as a single number as in Table 1 provides a starting point for understanding the prevalence of this problem, it is also an over-simplification in that results are averaged over gender, age groups and ethnic groups. The success rate of trans-temporal imaging remains low in certain populations, particularly elderly women and non-whites (Grolimund et al. 1987; Bruno et al. 1988; Eden 1988; Halsey 1990; Fujioka and Douville 1992; Hashimoto et al. 1992; Itoh et al. 1993; Comerota et al. 1995; Baumgartner et al. 1997). Halsey found window failure rates of 13% in white males, 18% in white females, 23% in black males and 50% in black females at 2.0 MHz (Halsey 1990). Alternatively, Hoksbergen reported failure rates of 1% in white men and 23% in white women over age 60 (Hoksbergen et al. 1999). In a Japanese population, Hashimoto reported a significant increase in window failure rates beginning at age 50, especially in women (Hashimoto et al. 1992). Hyperostosis—thickening of the skull’s inner table—has been proposed as a possible explanation for window failure in elderly women (Eden 1988). Hyperostosis has been observed in 6% to 12% of adult women of all ages (as compared with only 1% of men) (Moore and Carr 1952; Gegick et al. 1973), and in 50% of women over the age of 60 at time of death (Henschen 1939).
The groups having the highest incidence of window failure are some of the same populations at greatest risk for stroke. In the United States, the incidence of stroke among African-Americans is almost double that of white Americans, and twice as many African-Americans who have a stroke die from it compared to white Americans (NINDS 2004). Women are less at risk for stroke than men, although on average women have strokes at a greater age than men and are more likely to die (NINDS 2004).
Given an uncertain rate of window failure in these at-risk populations varying from perhaps 20% to 50%, we propose performing 3-D diagnostic transcranial ultrasound at lower frequencies, near 1 MHz. For most diagnostic equipment—either imaging or non-imaging transcranial Doppler—this would require new transducers capable of operating at lower frequencies. In this article, we describe the design, fabrication and testing of a new prototype 3-D bilateral imaging device with matrix array transducers operating at 1.2 MHz with the goal of performing transcranial imaging either outside of the window or in patients exhibiting window failure.
Previous efforts have attempted to address the effects of poor temporal acoustic windows by using the other window (Marinoni et al. 1997) or by finding the optimal probe placement (Vignon et al. 2009). Other attempts at overcoming the skull in ultrasound imaging include inducing shear-mode conversions at the soft tissue-skull interfaces (Clement et al. 2004; Yousefi et al. 2009) and various phase aberration correction techniques including multi-lag least squares approaches (Flax and O’Donnell 1988; Liu and Waag 1994; Ivancevich et al. 2008; Ivancevich et al. 2009) and spatiotemporal inverse filtering (Aubry et al. 2001; Tanter et al. 2001; Vignon et al. 2006). Most recently, our own group has described bilateral 3-D phase aberration correction of the skull bone using pitch-catch measurements (Lindsey and Smith). However, in the present article, we will focus on attenuation rather than aberration. It is worth noting that at lower frequencies, the effect of aberration is also diminished, as the root-mean-square amplitude—or “strength”—of the aberrator constitutes a smaller fraction of a wavelength at 1 MHz relative to 2 MHz (Smith 1975; Davros et al. 1985).
Previous probe designs for transcranial ultrasound include a low-frequency 1-D TCD probe (Klotzsch et al. 1998; Cullinane and Markus 2001), therapeutic arrays for high-intensity focused ultrasound (Clement et al. 2000; Hynynen et al. 2004; Hynynen and Clement 2007), a combined probe for imaging and thrombolysis (Azuma et al. 2010; Shimizu et al. 2012) and a 128-element, 750 kHz linear array (Meral and Clement 2010). Outside of our own previous work, no known previous attempts at matrix arrays for transcranial imaging have been made.
MATERIALS AND METHODS
Scanning system
Bilateral imaging in this work was performed using the Volumetrics Model 1 scanner (Volumetrics Medical Imaging, Durham, NC), modified as previously described (Lindsey et al. 2011). Offline fusion of simultaneously-acquired imaging volumes is performed by maximizing correlation in the frequency domain (Reddy and Chatterji 1996), then summing the two spatially-registered volumes in place. Four slices from two probes are displayed in real-time: one azimuth and one elevation slice from each transducer, corresponding to coronal and transverse planes in transtemporal imaging (Fig. 1b). The operator uses a trackball control to select four slices (any two from each transducer) for real-time display.
Lateral line separation is in 1.2° azimuth and 2.4° in elevation. Typical range gate resolution is 200 gates per line, so for Doppler gates with an extent of 6 cm in depth, Doppler spatial resolution is 0.3 mm. However, the angular resolution is limited by the transducer angular resolution of 3.1°, discussed in the “Transducer design” section (Fig. 4). The minimum detectable velocity is determined by the wall filter and is 11 cm/s (172 Hz). Figures in this paper present the magnitude of the Doppler data.
Fig. 4.

(a) Aperture design for 1 MHz sparse matrix array. Gray elements only transmit; white elements both transmit and receive. Simulated two-way response of this aperture (b) on-axis, (c) steered to +16° in both azimuth and elevation and (d) steered to +32° in both azimuth and elevation.
Frequency and SNR considerations
In transcranial ultrasound imaging, Hölscher et al. have used a 1 MHz transmit pulse in the development of a harmonic contrast-enhanced transcranial imaging technique, though the transducer arrays used in this work were 1-D and 1.5D arrays centered at 2.5 MHz (Holscher et al. 2005). Investigations in transcranial therapeutic ultrasound (Ammi et al. 2008) and non-imaging TCD (Klotzsch et al. 1998) also support decreasing transmit frequency from greater than 2 MHz to the 1 to 2 MHz range as a means of overcoming insufficient bone windows. Seeking theoretical basis for these indications in the literature, we have examined a simple model for answering the question of which frequency is best for transcranial ultrasound imaging.
For the continuous wave case, a design frequency (f) for maximizing the backscattered echo in an attenuating medium for a given depth (R) and attenuation (β) can be determined by using the product of the expression for frequency-dependent attenuation and the square of frequency (Rayleigh scattering is assumed) (Reid and Shung 1979). The derivative of this product is then set to zero, yielding the final result in eqn (1b):
| (1a) |
| (1b) |
Using a conversion factor of 0.1151 Nepers/dB, in the case of transcranial imaging with R1 = 2 mm of skull at β1 = 2.8 dB/cm/MHz (White and Stevenson 1978) and R2 = 7 cm of brain parenchyma (approximately to the midline) at β2 = 1.0 dB/cm/MHz, eqn (1b) yields a design frequency of 1.1 MHz. Outside of the window (R1 = 4 mm, β1 = 20 dB/cm/MHz), the design equation produces a frequency of 0.6 MHz. This is far too low for our scanner, which cannot transmit below 1.2 MHz, and leads to serious concerns regarding the size and resolution of an array that can be reasonably built and coupled to a human head since a 0.6 MHz array would need to be twice as large as a 1.2 MHz array to maintain resolution. The inability to transmit below 1.2 MHz also precludes harmonic imaging with a transmit frequency of 0.6 MHz and a receive frequency of 1.2 MHz. While this is a simple calculation for the continuous wave case, this corroborates the view expressed by other investigators: a probe having a resonant frequency of approximately 1 MHz, which is lower than those commonly used, may be advantageous. While this simple model does not account for specular reflections, the frequency-dependence of such reflections is negligible when wavelengths are much smaller than the skull-soft tissue interface surface.
On the basis of data acquired from point target echoes in a water tank as a measure of electronic SNR, we estimated signal to noise ratio (SNR) for our system as a function of increasing skull thickness. This SNR was then two-way attenuated by 7 cm of soft tissue and 0.3 cm of skull inside the acoustic window versus 7 cm of soft tissue and 0.4 cm of skull outside of the window, while the signal amplitude was assumed to vary with frequency according to f2 (Rayleigh scattering). The plots of SNR versus frequency (Fig. 3) indicate that (1) SNR falls off very rapidly at 1.8 MHz outside of the window and (2) for reasonable skull thicknesses outside of the window, 1.2 MHz would be expected to significantly outperform 1.8 MHz, generally by at least 5 dB. Under these parameters, imaging outside the window at 1.8 MHz is not possible for skull thicknesses beyond 0.25 cm.
Fig. 3.

Predicted system SNR as a function of skull thickness when scanning both inside and outside of the temporal acoustic window.
As previously noted, the ability to perform transcranial color flow imaging is of particular interest due to its potential diagnostic utility. Given the SNR of Figure 3, this signifies that (i) for our system, color flow imaging will be very difficult given that blood scattering generally lies 20–40 dB below tissue echoes (Jensen 1996), (ii) to successfully image blood flow from outside of the window, the design model should reflect color flow SNR rather than just echo SNR and (iii) although it is desirable to perform transcranial color flow imaging without contrast enhancement, the necessity of using microbubble contrast agent seems likely with this system. In light of (ii), we will briefly consider system color flow SNR.
Color flow SNR
While SNR considerations have been examined, Doppler imaging is of greatest interest for the proposed applications. Color Doppler SNR is largely determined by the operation of the stationary target canceller, or “wall” filter. The most common types of wall filters are the single- and double- delay-line cancellers, which remove stationary echoes by weighted subtraction of two or three successive lines of demodulated, digitized data. While efficient to implement, these filters also have zeros in their magnitude spectra which depend on the flow velocity and pulse repetition frequency (PRF) (Jensen 1996). In addition, because the wall filter cancels the highest-amplitude signals, the remaining blood flow signals suffer from low dynamic range since they occupy only the least significant bits during analog-to-digital conversion. Because of the complex relationship between echo and color flow SNR, the color flow imaging capabilities at the two frequencies will be directly compared experimentally.
Transducer design
In designing an approximately 1 MHz sparse 2-D array, the spatial dimensions of the 2.5 MHz aperture previously designed for transcranial imaging through the window (Lindsey et al. 2011) were scaled by approximately 2.5 to maintain resolution at the lower frequency. The resulting array has an element pitch of 0.725 mm and an aperture diameter of 25.3 mm (Fig. 4a). Simulations of the two-way beam for the 1 MHz array were produced using Field II (Fig. 4b, c, d) (Jensen and Svendsen 1992). −6 dB beam width for the unsteered response is 3.8 × 3.8 mm at a depth of 7 cm, an approximate measure of spatial resolution in the lateral dimensions. Cross talk is negligible and its effect on the beam has been ignored (Transducer testing section).
The proposed 2-D array acoustic stack—consisting of ground foil, PZT, flex circuit and acoustic backing—was simulated using the KLM model (PiezoCAD, Sonic Concepts, Bothell, WA) (Krimholtz et al. 1970; Desilets et al. 1978). The transducer was simulated with water at the front acoustic port, and additionally with the appropriate loads for imaging inside and outside of the temporal acoustic window using the attenuation values of White and Stevenson inside and outside of the window (White and Stevenson 1978). Electrical parameters were set to system values. Acoustic parameters for these simulations are given in Table 2. Transducer impulse response and the response to a 3 cycle, 1.2 MHz excitation waveform were simulated.
Table 2.
Materials parameters for KLM model simulations
| Material | Z0 | Thickness | α (attenuation) |
|---|---|---|---|
| PZT-5H (TRS HKI-HD) | 26.95 MRayl | 1.37 mm | — |
| Extracranial Tissues | 1.54 MRayl | 5 mm | 1 dB/cm/MHz |
| Skull (inside window) | 4.70 MRayl at 1.2 MHz 4.43 MRayl at 1.8 MHz |
3 mm | 2.8 dB/cm/MHz |
| Skull (outside of window) | 4.38 MRayl at 1.2 MHz 4.06 MRayl at 1.8 MHz |
4 mm | 20 dB/cm/MHz |
| Brain | 1.54 MRayl | 140 mm | 1 dB/cm/MHz |
Transducer fabrication
The simulated transducer described in Figure 4 and Table 2 was built on a custom flexible multilayer circuit having a polyimide substrate, 5 μm-thick copper traces and 9 μm copper pads with ENIG (electroless nickel, immersion gold) finish, with pads arranged as in Figure 4a (Microconnex, Snoqualmie, WA). Total thickness of this flex circuit was 209 μm, or 0.13λ at 1 MHz. A 27 × 27 × 1.37 mm piece of high dielectric constant PZT-5H (TRS Technologies, State College, PA) was bonded to the flex circuit by screen printing a silver-loaded anisotropic conductive epoxy (Chomerics, Woburn, MA) onto the back of the PZT. The bonded PZT was then diced using a programmable dicing saw (Disco DAD3220, Tokyo, Japan). A photograph of an array after dicing is shown in Figure 5. Kerf widths are approximately 90 μm. A ground foil was screen printed with conductive epoxy and bonded to the diced PZT, then the transducer was sealed. Finally, a lossy acoustic backing was cast and bonded to the back of the flex circuit. Two completed arrays were connected to a custom printed circuit board (PCSM/Moog Components, Galax, VA) via 300-pin connectors (Samtec BTH/BSH, New Albany, IN). This board then mates with the scanner front end.
Fig. 5.
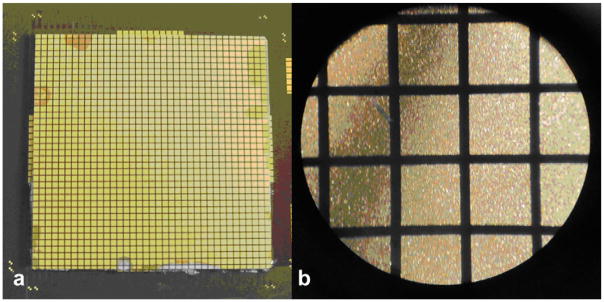
(a) Photograph and (b) micrograph of an array after dicing. Gold pads extending beyond the PZT in (a) are extra pads used only for alignment. Element pitch is 0.725 mm.
Transducer testing
The following measurements were made in a water tank on fabricated arrays: pulse-echo sensitivity/bandwidth, 50 Ω insertion loss and crosstalk. Pulse-echo testing was performed on individual channels by positioning an aluminum block reflector as close as possible to the face of the transducer. The transducer was excited using a pulser-receiver (Panametrics 5073PR) and power amplifier (ENI 525). Results were viewed on an oscilloscope (Tektronix 744A) and on a spectrum analyzer (HP3588A) with the use of a stepless gate (Panametrics 5605A). Insertion loss testing was performed with a 50 Ω source transmitting a 5 cycle, 1 MHz pulse. Element yields were tested during fabrication using a complex impedance analyzer (HP4194A) and after connecting the transducer to the scanner using a 14-bit programmable acquisition board (Signatec PDA14, Corona, CA) to digitize single channel echoes from a point target.
Safety measurements
Measurements in this section were made using a calibrated membrane hydrophone (Sonic Tech, Hatboro, PA) in a water tank. The spatial location on the hydrophone giving the maximum response was positioned at the transducer focus (7 cm). Acoustic output measurements were made while scanning in spectral Doppler mode with the highest transmit power level to measure worst-case values.
Mechanical index (MI) is used to estimate the potential for mechanical bioeffects, although no adverse effects in humans have been reported due to exposure to diagnostic-level ultrasonic pressures (Abbott 1999). The threshold for cavitation is reduced in the presence of microbubble contrast agents, though contrast-enhanced color Doppler sonography at approved diagnostic output levels has not shown any signs of damaging brain tissue or opening the blood-brain barrier (Schlachetzki et al. 2002). FDA limit for MI is 1.9.
The cranial bone thermal index (TIC) is a measure of heating at the transducer-bone interface (Abbott 1999). There is no FDA limit for TIC, and it is infrequently reported in literature, though it is part of the output display standard (AIUM/NEMA 1998).
Phantom imaging
Phantom testing was conducted in a water tank with side-viewing silicone rubber panels with 5 mm diameter latex tubing passing through the center of the tank in a U-shape to mimic a blood vessel. Gravity-fed seltzer water was made to flow through the tubing at approximately 50 cm/s, similar to systolic flow velocity in the internal carotid artery (66 ± 16 cm/s) (Valdueza et al. 2008). A 3 mm attenuator comprised of Wallgone absorbing rubber (Consumer Usage Labs, Parkville, MD) was placed in front of each transducer, producing two-way attenuation of 45.2 dB at 1.8 MHz and 32.9 dB at 1.2 MHz. This is similar to two-way in vivo attenuation outside of the temporal acoustic window, which is computed to be 43.2 dB at 1.8 MHz and 28.8 dB at 1.2 MHz (assuming 0.4 cm at 30 dB/cm/MHz) (White and Stevenson 1978; Ivancevich 2009). The rubber attenuators mimic the effects of in vivo attenuation, not reflections, although reflections due to mismatches in acoustic impedance may be assumed to be frequency-independent.
The 1.8 MHz arrays used in phantom and in vivo experiments are modified versions of the 2.3 MHz arrays used in the previous study (Lindsey et al. 2011). They were constructed using the same flex circuit as the 2.3 MHz array but PZT having a different thickness (760 μm for 1.8 MHz versus 600 μm for 2.3 MHz) so that their resonant frequency is 1.8 MHz and thus provides a fair comparison for the newly designed arrays operating at 1.2 MHz.
In vivo imaging
As a surrogate for window failure, we scanned all subjects outside of their temporal acoustic windows by placing the probes above the pinnae of the ears, superior to the window by approximately 2 cm. In a pilot study, one of the authors (S.S.) scanned himself to provide in vivo comparison between dual flex transducers at 1.8 MHz and 1.2 MHz in a healthy 64-y-old male. This subject was first scanned at 1.2 MHz with the probes, described in the Methods section, placed superior to the temporal acoustic windows by approximately 2 cm. On-screen image quality was optimized by adjusting the overall gain and the time gain control. Next, the subject was scanned with 1.8 MHz probes fabricated as described previously (Lindsey et al. 2011), again optimizing on-screen image quality. Care was taken to position the probes in the same position on the skull and to acquire the same field of view as with the lower frequency arrays.
Five additional healthy subjects were then scanned with Definity (Lantheus Medical Imaging, North Billerica, MA) microbubble contrast agent enhancement only at 1.2 MHz after providing informed consent according to a protocol approved by the Institutional Review Board of Duke University. Because there was not time to change and reposition transducers or modify scanner settings after injection and each subject is limited to two doses of 10 μL/kg, these subjects were not scanned at 1.8 MHz. The five subjects consisted of 4 males, 1 female; 4 Caucasians and 1 African-American. Data for each subject were reviewed in offline 3-D renderings and in the scanner’s orthogonal 3-D display to assess visibility of each of the following vessels: left and right internal carotid arteries, left and right middle cerebral arteries, left and right posterior cerebral arteries, and anterior carotid artery (treated as a single structure for identification purposes). The presence of anatomical landmarks such as the sphenoid bone and falx cereberi in B-mode echo imaging was also assessed. Images were analyzed by the same person, the first author (B.L.), who has experience in transcranial ultrasound imaging.
For each subject, the two transducer arrays were positioned approximately 2 cm superior to the bilateral temporal acoustic windows. Imaging was performed during positioning to ensure adequate contact and determine imaging field of view. Transducers were held in place using an EEG cap (Jordan NeuroScience, San Bernadino, CA). Each subject was then given a bolus injection intravenously of 10 μL/kg followed by a 10 mL saline flush according to the Definity prescribing information. After a 30-m delay, a second bolus injection was administered to allow acquisition of additional images.
RESULTS
KLM model simulations
Results of KLM model simulations for the designed 1 MHz transducer are presented in Table 3. Figure 6 shows the simulated pulse-echo waveform and spectrum showing a center frequency of 1.08 MHz produced by transmitting and receiving into water with a single element. When this transducer is loaded with the skull and soft tissues, the KLM model predicts a decrease in SNR of 23.08 dB (inside the window) and 33.32 dB (outside of the window). For comparison, for the 1.8 MHz transducer, these figures are 38.68 (inside the window) and 43.00 dB (outside of the window).
Table 3.
Results of KLM modeling, 1.2 MHz excitation response
| Without skull | With skull (within window) | With skull (outside of window) | |
|---|---|---|---|
| Pulse-echo amplitude relative to no skull case | 0 dB(reference) | −23.08 dB | −33.32 dB |
| Center frequency (f0) | 1.08 MHz | 1.07 MHz | 1.00 MHz |
| −6 dB bandwidth | 32.89% | 28.31% | 16.61% |
Fig. 6.
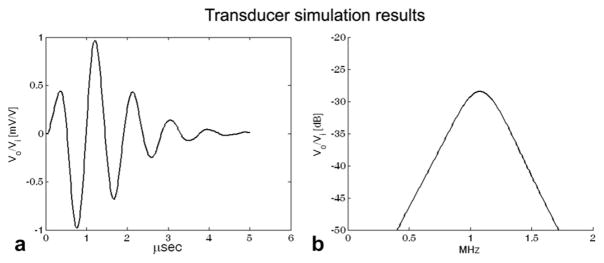
Simulated pulse-echo impulse response (a) and spectrum (b) for a single element using PiezoCAD. The units on the ordinate axes are measured output voltage (Vo) relative to applied input voltage (Vi).
Transducer testing
The single-element waveform and spectrum shown in Figure 7 are similar to the simulation results, although the strong harmonics do not occur in the simulation. Bandwidth is 46.86%, centered at 1.0 MHz. 50 Ω insertion loss was measured to be −58 dB. This is an improvement over the 2.3 MHz transducer (−80 dB), as the larger elements provide better electrical matching. Worst-case crosstalk on adjacent channels in the flex circuit was −46.90 dB. This improvement in crosstalk as compared to the previous 2.3 MHz transducers (−30 dB) is due to increased trace separation in the flex circuit allowed by a larger aperture (Lindsey et al. 2011). Lower cross talk in the transducer is expected to improve imaging signal to noise ratio and angular sensitivity. Element yields of the two transducers used for simultaneous imaging were 91% and 95%.
Fig. 7.

(a) Typical single element pulse-echo response and (b) average spectrum from all single-element acquisitions. The simulated spectrum of Figure 6 is reproduced for comparison (dashed line).
Safety measurement
Measured worst-case MI for this transducer is 0.33. Though operating at a lower transmit frequency increases MI, the output of these transducers is well below both the FDA limit and reported MIs for previous in vivo transcranial imaging studies (Schlachetzki et al. 2002; Holscher et al. 2005). In addition, Definity microbubbles are reported to exhibit a slight decrease in energy absorption with decreasing frequency (Chatterjee et al. 2005; Goertz et al. 2007), decreasing the potential for cavitation as compared with a transducer having the same acoustic output at a higher frequency. As we do not have sufficient voltage control to maintain constant MI across frequencies, constant transmit voltage amplitude will be maintained.
Measured worst-case value for TIC for this transducer is 1.66. As a rough comparison with a different thermal index, it may be noted that soft tissue thermal indices (TIS) of greater than 2 are often reported in the literature. Measured worst-case Isppa is 2.4 W/cm2 and Ispta is 0.068 W/cm2.
Phantom imaging
The results of three phantom experiments are shown in Figure 8, in which fused renderings clearly depict flow in the expected spatial pattern at 1.2 MHz, while only the outermost legs of the tube are visible when scanning at 1.8 MHz.
Fig. 8.

Results of three separate tests of water tank flow testing in the present of 3 mm Wallgone rubber using two different sets of transducers at the indicated frequencies. Attenuation is 28.8 dB at 1.2 MHz and 43.2 dB at 1.8 MHz. Images are acquired at the same transmit voltage.
In vivo imaging
In producing a 3-D rendered image, a rendering threshold must be selected below which noise is rejected and above which anatomical structures are displayed. As seen in Figure 9a, at 1.8 MHz it was not possible to determine a threshold at which intracranial structures could be visualized. However, the reduced attenuation at 1.2 MHz allows visualization of several hyperechoic structures, including the choroid plexus in the lateral ventricles and the sphenoid bone inferiorly in the coronal view of Figure 9b and the axial view of Figure 9c.
Fig. 9.
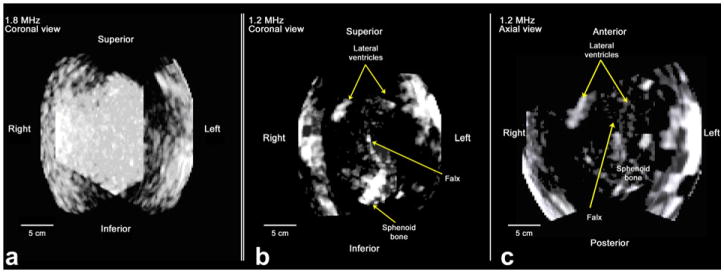
Fused renderings of the same subject using the described 1.8 MHz (a) and 1.2 MHz (b and c) imaging system. Coronal views are shown in (a) and (b) and an axial view in (c). Both data sets were acquired outside of the temporal acoustic window. For 1.8 MHz imaging, we were unable to find a threshold setting which allowed visualization of anatomical structures. In the 1.2 MHz image, anterior horns of lateral ventricles, sphenoid bone and contralateral skull surfaces are visible.
On the basis of these initial results, additional subjects were imaged outside the window using micro-bubble contrast agent according to an IRB-approved protocol as described in the Methods section.
An offline 3-D rendering of contrast-enhanced Doppler data in a single subject is shown in Figure 10. The vessels of the Circle of Willis can be seen in this image. Table 4 summarizes the detectability of arteries of the Circle of Willis in Doppler imaging and of anatomical landmarks in B-mode imaging in this study and compares with the previous 1.8 MHz study through the temporal acoustic windows. Bilateral anterior cerebral arteries are treated as a single structure, as they commonly appear in Doppler ultrasound images (Bogdahn et al. 1998; Valdueza et al. 2008). Detection rates were slightly lower than with higher frequency 3-D imaging through the temporal acoustic window, but as discussed in the Methods section (Fig. 3), imaging in this 1.2 MHz study was performed through a much more highly attenuating region of the skull.
Fig. 10.

Registered, fused rendering of a healthy 34-y-old male with Definity microbubble contrast enhancement. ACA = anterior cerebral artery; ICA = internal carotid artery; MCA = middle cerebral artery; PCA = posterior cerebral artery.
Table 4.
Detection rates of major cerebral arteries through the acoustic windows in 3-D Doppler imaging at 1.8 MHz (Lindsey et al. 2011) versus outside the acoustic windows at 1.2 MHz
| Doppler scanning frequency | Probe placement | Detection rates | ||||
|---|---|---|---|---|---|---|
|
| ||||||
| ACA | ICA | MCA | PCA | Echo landmarks | ||
| 1.8 MHz | Within temporal acoustic windows | 1/4 | 8/8 | 8/8 | 6/8 | 4/4 |
| 1.2 MHz | Outside of acoustic windows | 4/5 | 8/10 | 9/10 | 3/10 | 8/10 |
ACA = anterior cerebral artery; ICA = internal carotid artery; MCA = middle cerebral artery; PCA = posterior cerebral artery.
DISCUSSION
By designing and fabricating lower frequency, large aperture matrix array probes, we have demonstrated the potential for performing 3-D transcranial ultrasound imaging not through the temporal acoustic window, but through a thicker, more highly attenuating part of the skull. This approach may be reasonably expected to enable transcranial ultrasound imaging in some patients with poor temporal bone windows. Improvement in 3-D echo imaging was significant at 1.2 MHz as compared to 1.8 MHz as seen in Figure 9. However, due to the SNR requirements for color flow imaging, microbubble contrast agent was still required.
This study merely examined feasibility and was not comprehensive given the aforementioned varying window characteristics among populations and individuals. A comprehensive study of window failure across ethnic groups and ages would provide greater insight into the prevalence of this problem, especially a study examining several different transmit frequencies.
Detection rates of middle cerebral and internal carotid arteries were slightly lower when imaging outside the window at 1.2 MHz as compared to imaging through the temporal acoustic window at 1.8 MHz in the previous study (Lindsey et al. 2011). Nonetheless, to our knowledge, transcranial ultrasound imaging outside of the temporal acoustic window has not been demonstrated previously. Two of five subjects exhibited a partial or complete unilateral failure to image, suggesting window failure will persist in some subjects even at a lower frequency; Figure 3 suggests this occurs when the skull becomes too thick on one side. Both of these subjects were, however, successfully imaged through a single side. An example of single-sided imaging failure is shown in Figure 11. Conversely, for subjects having adequate windows, reduction in transmit frequency would still increase penetration, improving the ability to image contralateral structures.
Fig. 11.

An example of unilateral imaging failure in one subject, a 32-y-old African-American male. Imaging with the low frequency array does enable imaging through the right side of the subject’s skull outside of the temporal acoustic window, but not through the left side. ACA = anterior cerebral artery; ICA = internal carotid artery; MCA = middle cerebral artery; PCA = posterior cerebral artery.
The presented results suggest that a large, low-frequency (∼1 MHz) array may allow imaging outside of the window, which would prove helpful both for imaging subjects with poor acoustic windows and for allowing operators with minimal training to image subjects from an ambulance or other field setting. In a small study, the ability to detect blood flow in internal carotid and middle cerebral arteries in healthy volunteers is encouraging, especially when one considers that 68% of strokes affect the anterior circulation, and of these 96% occur in the middle cerebral arteries (Bogousslavsky et al. 1988).
In particular, this study only examined healthy individuals; as such, the ability to image blood flow in pathologic states such as low flow velocity or compensated flow in the event of a stroke remains unknown. In addition to the ability to image an occlusion as a distinct absence of blood, any technique for diagnostic imaging of stroke must also be able to rule out intracerebral hemorrhage. While some encouraging results have been published using ultrasound (Meyer-Wiethe et al. 2009), ultrasound imaging techniques have yet to demonstrate this capability in a large clinical trial.
Designing a large aperture produces beams which are virtually identical to 2.3 MHz simulations (−6 dB beam width of 3.6 mm at 2.3 MHz as compared to 3.8 mm at 1 MHz) (Lindsey et al. 2011). When using a large aperture, individual elements are more likely to encounter varying aberration and attenuation due to the inhomogeneity of the skull. However, these effects are diminished by the lower frequency of the waves. In the future, heating at the probe surface could become a concern due to energy deposition at the skull’s outer surface. However, because a probe with a large surface area spreads out energy, switching to a large array at the same power setting is thus less of a concern than increasing the transmit power when using a small array.
We have presented a system for overcoming temporal acoustic window limitations in transcranial ultrasound imaging which relies on a bilateral approach using low frequency, large aperture sparse arrays. It is our hope that when combined with recent developments in portable ultrasound, such an approach may be useful to allow acquisition of useful images either in individuals with poor windows or outside of the temporal acoustic window in the field.
Acknowledgments
The authors wish to thank Gerald Harris and Subha Maruvada of FDA for providing Wallgone attenuation data, Vivek Patel and Albert Chang for assistance with the clinical study, David Bradway, Ned Rouze and Kathy Nightingale for providing the hydrophone and calibration data and Gregg Trahey for helpful conversations. This research was supported by grants R01 HL089507 and T32EB001040 from the National Institutes of Health.
References
- Aaslid R, Markwalder TM, Nornes H. Noninvasive transcranial Doppler ultrasound recording of flow velocity in basal cerebral arteries. J Neurosurg. 1982;57:769–774. doi: 10.3171/jns.1982.57.6.0769. [DOI] [PubMed] [Google Scholar]
- Abbott JG. Rationale and derivation of MI and TI—a review. Ultrasound Med Biol. 1999;25:431–441. doi: 10.1016/s0301-5629(98)00172-0. [DOI] [PubMed] [Google Scholar]
- Adams H, Adams R, Del Zoppo G, Goldstein LB. Guidelines for the early management of patients with ischemic stroke: 2005 guidelines update a scientific statement from the Stroke Council of the American Heart Association/American Stroke Association. Stroke. 2005;36:916–923. doi: 10.1161/01.STR.0000163257.66207.2d. [DOI] [PubMed] [Google Scholar]
- AIUM/NEMA. Standard for real-time display of thermal and mechanical acoustic indices on diagnostic ultrasound equipment. Laurel, MD: AIUM; 1998. [Google Scholar]
- Ammi AY, Mast TD, Huang IH, Abruzzo TA, Coussios CC, Shaw GJ, Holland CK. Characterization of ultrasound propagation through ex-vivo human temporal bone. Ultrasound Med Biol. 2008;34:1578–1589. doi: 10.1016/j.ultrasmedbio.2008.02.012. [DOI] [PMC free article] [PubMed] [Google Scholar]
- Aubry JF, Tanter M, Gerber J, Thomas JL, Fink M. Optimal focusing by spatio-temporal inverse filter. II. Experiments. Application to focusing through absorbing and reverberating media. J Acoust Soc Am. 2001;110:48–58. doi: 10.1121/1.1377052. [DOI] [PubMed] [Google Scholar]
- Azuma T, Ogihara M, Kubota J, Sasaki A, Umemura S-i, Furuhata H. Dual-Frequency Ultrasound Imaging and Therapeutic Bilaminar Array Using Frequency Selective Isolation Layer. IEEE Trans Ultrason Ferroelectr Freq Control. 2010;57:1211–1224. doi: 10.1109/TUFFC.2010.1534. [DOI] [PubMed] [Google Scholar]
- Baumgartner RW, Arnold M, Gonner F, Staikow I, Herrmann C, Rivoir A, Muri RM. Contrast-enhanced transcranial color-coded duplex sonography in ischemic cerebrovascular disease. Stroke. 1997;28:2473–2478. doi: 10.1161/01.str.28.12.2473. [DOI] [PubMed] [Google Scholar]
- Becker G, Griewing B. Examination techniques. In: Bogdahn U, Becker G, Schlachetzki F, editors. Echoenhancers and transcranial color duplex songoraphy. Berlin: Blackwell Science; 1998. pp. 219–231. [Google Scholar]
- Bogdahn U, Winkler J, Schwab S, Adolf H. Parenchymal anatomy. In: Bogdahn U, Becker G, Schlachetzki F, editors. Echoenhancers and transcranial color duplex sonography. Berlin: Blackwell Science; 1998. pp. 233–250. [Google Scholar]
- Bogousslavsky J, Van Melle G, Regli F. The Lausanne Stroke Registry: Analysis of 1,000 consecutive patients with first stroke. Stroke. 1988;19:1083–1092. doi: 10.1161/01.str.19.9.1083. [DOI] [PubMed] [Google Scholar]
- Bowman J. Ultrasound applications in EMS. Journal of Emergency Medical Services. 2010;35:36–47. doi: 10.1016/S0197-2510(10)70229-1. [DOI] [PubMed] [Google Scholar]
- Bruno A, Biller J, Silvidi JA. A reason for failure to obtain transcranial Doppler flow signals. Hyperostosis of the skull. Stroke. 1988;19:274. [PubMed] [Google Scholar]
- Carandang R, Seshadri S, Beiser A, Kelly-Hayes M, Kase CS, Kannel WB, Wolf PA. Trends in incidence, lifetime risk, severity, and 30-day mortality of stroke over the past 50 years. JAMA. 2006;296:2939–2946. doi: 10.1001/jama.296.24.2939. [DOI] [PubMed] [Google Scholar]
- Chatterjee D, Sarkar K, Jain P, Schreppler NE. On the suitability of broadband attenuation measurement for characterizing contrast microbubbles. Ultrasound Med Biol. 2005;31:781–786. doi: 10.1016/j.ultrasmedbio.2005.02.014. [DOI] [PubMed] [Google Scholar]
- Chenaitia H, Squarcioni C, Marie BP, Emgan Q, Tomislav P. Transcranial sonography in prehospital setting. Am J Emerg Med. 2011;29:1231–1233. doi: 10.1016/j.ajem.2011.06.025. [DOI] [PubMed] [Google Scholar]
- Clement G, Sun J, Giesecke T, Hynynen K. A hemisphere array for non-invasive ultrasound brain therapy and surgery. Physis in Medicine and Biology. 2000;45:3707–3719. doi: 10.1088/0031-9155/45/12/314. [DOI] [PubMed] [Google Scholar]
- Clement GT, White PJ, Hynynen K. Enhanced ultrasound transmission through the human skull using shear mode conversion. J Acoust Soc Am. 2004;115:1356–1364. doi: 10.1121/1.1645610. [DOI] [PubMed] [Google Scholar]
- Comerota AJ, Katz ML, Hosking JD, Hashemi HA, Kerr RP, Carter AP. Is transcranial Doppler a worthwhile addition to screening tests for cerebrovascular disease? J Vasc Surg. 1995;21:90–95. doi: 10.1016/s0741-5214(95)70247-4. discussion 5–7. [DOI] [PubMed] [Google Scholar]
- Cullinane M, Markus HS. Evaluation of a 1 MHz transducer for transcranial Doppler ultrasound including embolic signal detection. Ultrasound Med Biol. 2001;27:795–800. doi: 10.1016/s0301-5629(01)00369-6. [DOI] [PubMed] [Google Scholar]
- Daft CMW. Conformable transducers for large-volume, operator-independent imaging. IEEE Ultrasonics Symposium. 2010:798–808. [Google Scholar]
- Davis SM, Donnan GA. 4.5 hours: The new time window for tissue plasminogen activator in stroke. Stroke. 2009;40:2266–2267. doi: 10.1161/STROKEAHA.108.544171. [DOI] [PubMed] [Google Scholar]
- Davros WJ, Madsen EL, Zagzebski JA. Breast mass detection by US: A phantom study. Radiology. 1985;156:773–775. doi: 10.1148/radiology.156.3.3895293. [DOI] [PubMed] [Google Scholar]
- Del Zoppo GJ, Saver JL, Jauch EC, Adams HP., Jr Expansion of the time window for treatment of acute ischemic stroke with intravenous tissue plasminogen activator: A science advisory from the American Heart Association/American Stroke Association. Stroke. 2009;40:2945–2948. doi: 10.1161/STROKEAHA.109.192535. [DOI] [PMC free article] [PubMed] [Google Scholar]
- Desilets CS, Fraser JD, Kino GS. The Design of efficient broad-band piezoelectric transducers. IEEE Trans Sonics Ultrason. 1978;25:115–125. [Google Scholar]
- Eden A. Transcranial Doppler ultrasonography and hyperostosis of the skull. Stroke. 1988;19:1445–1446. doi: 10.1161/01.str.19.11.1445. [DOI] [PubMed] [Google Scholar]
- Flax SW, O’Donnell M. Phase-aberration correction using signals from point reflectors and diffuse scatterers—basic principles. IEEE Transactions on Ultrasonics Ferroelectrics and Frequency Control. 1988;35:758–767. doi: 10.1109/58.9333. [DOI] [PubMed] [Google Scholar]
- Fujioka K, Douville C. Anatomy and freehand examination techniques. In: Newell D, Aaslid R, editors. Transcranial doppler. New York: Raven Press; 1992. [Google Scholar]
- Furuhata H. Historical development of transcranial-color tomography. In: Bogdahn U, Becker G, Schlachetzki F, editors. Echoenhancers and transcranial color duplex sonography. Berlin: Blackwell Science; 1998. pp. 3–15. [Google Scholar]
- Gahn G, Gerber J, Hallmeyer S, Hahn G, Ackerman RH, Reichmann H, von Kummer R. Contrast-enhanced transcranial color-coded duplexsonography in stroke patients with limited bone windows. AJNR Am J Neuroradiol. 2000;21:509–514. [PMC free article] [PubMed] [Google Scholar]
- Gegick CG, Danowski TS, Khurana RC, Vidalon C, Nolan S, Stephan T, Chae S, Wingard L. Hyperostosis frontalis interna and hyperphos-phatasemia. Ann Intern Med. 1973;79:71–75. doi: 10.7326/0003-4819-79-1-71. [DOI] [PubMed] [Google Scholar]
- Goertz DE, de Jong N, van der Steen AF. Attenuation and size distribution measurements of Definity and manipulated Definity populations. Ultrasound Med Biol. 2007;33:1376–1388. doi: 10.1016/j.ultrasmedbio.2007.03.009. [DOI] [PubMed] [Google Scholar]
- Grolimund P. Transmission of ultrasound through the temporal bone. In: Aaslid R, editor. Transcranial doppler sonography. Vienna: Springer-Verlag; 1986. pp. 10–21. [Google Scholar]
- Grolimund P, Seiler RW, Aaslid R, Huber P, Zurbruegg H. Evaluation of cerebrovascular disease by combined extracranial and transcranial Doppler sonography. Experience in 1,039 patients. Stroke. 1987;18:1018–1024. doi: 10.1161/01.str.18.6.1018. [DOI] [PubMed] [Google Scholar]
- Hacke W, Kaste M, Fieschi C, Toni D, Lesaffre E, von Kummer R, Boysen G, Bluhmki E, Hoxter G, Mahagne MH, et al. Intravenous thrombolysis with recombinant tissue plasminogen activator for acute hemispheric stroke. The European Cooperative Acute Stroke Study (ECASS) JAMA. 1995;274:1017–1025. [PubMed] [Google Scholar]
- Hallstrom B, Jonsson AC, Nerbrand C, Norrving B, Lindgren A. Stroke incidence and survival in the beginning of the 21st century in southern Sweden: Comparisons with the late 20th century and projections into the future. Stroke. 2008;39:10–15. doi: 10.1161/STROKEAHA.107.491779. [DOI] [PubMed] [Google Scholar]
- Halsey JH. Effect of emitted power on waveform intensity in transcranial Doppler. Stroke. 1990;21:1573–1578. doi: 10.1161/01.str.21.11.1573. [DOI] [PubMed] [Google Scholar]
- Hashimoto H, Etani H, Naka M, Kinoshita N, Nukada T. Assessment of the rate of successful transcranial Doppler recording through the temporal windows in Japanese with special reference to aging and sex. Nippon Ronen Igakkai Zasshi. 1992;29:119–122. doi: 10.3143/geriatrics.29.119. [DOI] [PubMed] [Google Scholar]
- Heidenreich PA, Trogdon JG, Khavjou OA, Butler J, Dracup K, Ezekowitz MD, Finkelstein EA, Hong Y, Johnston SC, Khera A, Lloyd-Jones DM, Nelson SA, Nichol G, Orenstein D, Wilson PW, Woo YJ. Forecasting the future of cardiovascular disease in the United States: A policy statement from the American Heart Association. Circulation. 2011;123:933–944. doi: 10.1161/CIR.0b013e31820a55f5. [DOI] [PubMed] [Google Scholar]
- Henschen F. Classification of cranial hyperostoses. Acta Chir Scand. 1939;82:107–116. [Google Scholar]
- Heuschmann PU, Grieve AP, Toschke AM, Rudd AG, Wolfe CD. Ethnic group disparities in 10-year trends in stroke incidence and vascular risk factors: The South London Stroke Register (SLSR) Stroke. 2008;39:2204–2210. doi: 10.1161/STROKEAHA.107.507285. [DOI] [PubMed] [Google Scholar]
- Hoksbergen AW, Legemate DA, Ubbink DT, Jacobs MJ. Success rate of transcranial color-coded duplex ultrasonography in visualizing the basal cerebral arteries in vascular patients over 60 years of age. Stroke. 1999;30:1450–1455. doi: 10.1161/01.str.30.7.1450. [DOI] [PubMed] [Google Scholar]
- Holscher T. Prehospital use of portable ultrasound for stroke diagnosis and treatment initiation. Air Rescue. 2012;2:48–50. [Google Scholar]
- Holscher T, Schlachetzki F, Zimmermann M, Jakob W, Ittner KP, Haslberger J, Bogdahn U, Boy S. Transcranial ultrasound from diagnosis to early stroke treatment. 1. Feasibility of prehospital cerebro-vascular assessment. Cerebrovasc Dis. 2008;26:659–663. doi: 10.1159/000166844. [DOI] [PubMed] [Google Scholar]
- Holscher T, Wilkening WG, Lyden PD, Mattrey RF. Transcranial ultrasound angiography (T USA): a new approach for contrast specific imaging of intracranial arteries. Ultrasound Med Biol. 2005;31:1001–1006. doi: 10.1016/j.ultrasmedbio.2005.04.014. [DOI] [PubMed] [Google Scholar]
- Hoyer HX, Vogl S, Schiemann U, Haug A, Stolpe E, Michalski T. Pre-hospital ultrasound in emergency medicine: incidence, feasibility, indications and diagnoses. Eur J Emerg Med. 2010;17:254–259. doi: 10.1097/MEJ.0b013e328336ae9e. [DOI] [PubMed] [Google Scholar]
- Hynynen K, Clement G. Clinical applications of focused ultrasound–The brain. International Journal of Hyperthermia. 2007;23:193–202. doi: 10.1080/02656730701200094. [DOI] [PubMed] [Google Scholar]
- Hynynen K, Clement G, McDannold N, Vykhodtseva N, King R, White PJ, Vitek S, Jolesz FA. 500-element ultrasound phased array system for noninvasive focal surgery of the brain: a preliminary rabbit study with ex vivo human skulls. Magn Reson Med. 2004;52:100–107. doi: 10.1002/mrm.20118. [DOI] [PubMed] [Google Scholar]
- Itoh T, Matsumoto M, Handa N, Maeda H, Hougaku H, Hashimoto H, Etani H, Tsukamoto Y, Kamada T. Rate of successful recording of blood flow signals in the middle cerebral artery using transcranial Doppler sonography. Stroke. 1993;24:1192–1195. doi: 10.1161/01.str.24.8.1192. [DOI] [PubMed] [Google Scholar]
- Ivancevich NM. Biomedical Engineering Department. Duke University; Durham, NC: 2009. Phase aberration correction for real-time 3-D transcranial ultrasound imaging; p. 123. PhD. [Google Scholar]
- Ivancevich NM, Dahl JJ, Smith SW. Comparison of 3-D multi-lag cross-correlation and speckle brightness aberration correction algorithms on static and moving targets. IEEE Trans Ultrason Ferroelectr Freq Control. 2009;56:2157–2166. doi: 10.1109/TUFFC.2009.1298. [DOI] [PMC free article] [PubMed] [Google Scholar]
- Ivancevich NM, Pinton GF, Nicoletto HA, Bennett E, Laskowitz DT, Smith SW. Real-Time 3-D Contrast-Enhanced Transcranial Ultrasound and Aberration Correction. Ultrasound in Medicine and Biology. 2008;34:1387–1395. doi: 10.1016/j.ultrasmedbio.2008.01.015. [DOI] [PMC free article] [PubMed] [Google Scholar]
- Jensen JA. Estimation of blood velocities using ultrasound. Cambridge: Cambridge University Press; 1996. [Google Scholar]
- Jensen JA, Svendsen NB. Calculation of pressure fields from arbitrarily shaped, apodized, and excited ultrasound transducers. IEEE Trans Ultrason Ferroelectr Freq Control. 1992;39:262–267. doi: 10.1109/58.139123. [DOI] [PubMed] [Google Scholar]
- Katzan IL, Furlan AJ, Lloyd LE, Frank JI, Harper DL, Hinchey JA, Hammel JP, Qu A, Sila CA. Use of tissue-type plasminogen activator for acute ischemic stroke: the Cleveland area experience. JAMA. 2000;283:1151–1158. doi: 10.1001/jama.283.9.1151. [DOI] [PubMed] [Google Scholar]
- Kenton AR, Martin PJ, Abbott RJ, Moody AR. Comparison of transcranial color-coded sonography and magnetic resonance angiography in acute stroke. Stroke. 1997;28:1601–1606. doi: 10.1161/01.str.28.8.1601. [DOI] [PubMed] [Google Scholar]
- Klotzsch C, Popescu O, Berlit P. A new 1-MHz probe for transcranial Doppler sonography in patients with inadequate temporal bone windows. Ultrasound Med Biol. 1998;24:101–103. doi: 10.1016/s0301-5629(97)00231-7. [DOI] [PubMed] [Google Scholar]
- Koennecke HC, Nohr R, Leistner S, Marx P. Intravenous tPA for ischemic stroke team performance over time, safety, and efficacy in a single-center, 2-year experience. Stroke. 2001;32:1074–1078. doi: 10.1161/01.str.32.5.1074. [DOI] [PubMed] [Google Scholar]
- Krejza J, Swiat M, Pawlak MA, Oszkinis G, Weigele J, Hurst RW, Kasner S. Suitability of temporal bone acoustic window: conventional TCD versus transcranial color-coded duplex sonography. J Neuroimaging. 2007;17:311–314. doi: 10.1111/j.1552-6569.2007.00117.x. [DOI] [PubMed] [Google Scholar]
- Krimholtz R, Leedom DA, Matthaei GL. New equivalent circuits for elementary piezoelectric transducers. Electronics Letters. 1970;6:398–399. [Google Scholar]
- Lindsey BD, Light ED, Nicoletto HA, Bennett ER, Laskowitz DT, Smith SW. The ultrasound brain helmet: new transducers and volume registration for in vivo simultaneous multi-transducer 3-D transcranial imaging. IEEE Trans Ultrason Ferroelectr Freq Control. 2011;58:1189–1202. doi: 10.1109/TUFFC.2011.1929. [DOI] [PMC free article] [PubMed] [Google Scholar]
- Lindsey BD, Smith SW. Pitch-catch phase aberration correction of multiple isoplanatic patches for 3-D transcranial ultrasound imaging. IEEE Trans Ultrason Ferroelectr Freq Control. doi: 10.1109/TUFFC.2013.2590. [in press]. [DOI] [PMC free article] [PubMed] [Google Scholar]
- Liu DL, Waag RC. Time-shift compensation of ultrasonic pulse focus degradation using least-mean-square error estimates of arrival time. J Acoust Soc Am. 1994;95:542–555. doi: 10.1121/1.408348. [DOI] [PubMed] [Google Scholar]
- Marinoni M, Ginanneschi A, Forleo P, Amaducci L. Technical limits in transcranial Doppler recording: inadequate acoustic windows. Ultrasound Med Biol. 1997;23:1275–1277. doi: 10.1016/s0301-5629(97)00077-x. [DOI] [PubMed] [Google Scholar]
- Meral FC, Clement G. 128 Element ultrasound array for transcranial imaging. IEEE International Ultrasonics Symposium. 2010:1984–1987. [Google Scholar]
- Meyer-Wiethe K, Sallustio F, Kern R. Diagnosis of intracerebral hemorrhage with transcranial ultrasound. Cerebrovasc Dis. 2009;27(Suppl 2):40–47. doi: 10.1159/000203125. [DOI] [PubMed] [Google Scholar]
- Moore S, Carr AD. Hyperostosis frontalis interna; two contrasting cases. J Am Med Assoc. 1952;148:199–200. doi: 10.1001/jama.1952.62930030004009b. [DOI] [PubMed] [Google Scholar]
- National Institute of Neurological Disorders and Stroke. [accessed 2012];2004 NIH Publication No. 99-2222. http://www.ninds.nih.gov/disorders/stroke/detail_stroke.htm.
- The National Institute of Neurological Disorders and Stroke rt-PA Stroke Study Group. Tissue plasminogen activator for acute ischemic stroke. N Engl J Med. 1995;333:1581–1587. doi: 10.1056/NEJM199512143332401. [DOI] [PubMed] [Google Scholar]
- Porter BA, Seck H. Automated breast volume scanning: Visualization of mammographically occult breast cancer—two cases (Whitepaper) Mountain View, CA: Siemens Medical Solutions, USA; 2009. [Google Scholar]
- Postert T, Federlein J, Przuntek H, Buttner T. Insufficient and absent acoustic temporal bone window: potential and limitations of transcranial contrast-enhanced color-coded sonography and contrast-enhanced power-based sonography. Ultrasound Med Biol. 1997;23:857–862. doi: 10.1016/s0301-5629(97)00047-1. [DOI] [PubMed] [Google Scholar]
- Reddy BS, Chatterji BN. An FFT-based technique for translation, rotation, and scale-invariant image registration. IEEE Trans Image Process. 1996;5:1266–1271. doi: 10.1109/83.506761. [DOI] [PubMed] [Google Scholar]
- Reid JM, Shung KK. Quantitative Measurements of scattering of ultrasound by heart and liver. Ultrasonic Tissue Characterization II. 1979;2:153–156. [Google Scholar]
- Roger VL, Go AS, Lloyd-Jones DM, Benjamin EJ, Berry JD, Borden WB, Bravata DM, Dai S, Ford ES, Fox CS, Fullerton HJ, Gillespie C, Hailpern SM, Heit JA, Howard VJ, Kissela BM, Kittner SJ, Lackland DT, Lichtman JH, Lisabeth LD, Makuc DM, Marcus GM, Marelli A, Matchar DB, Moy CS, Mozaffarian D, Mussolino ME, Nichol G, Paynter NP, Soliman EZ, Sorlie PD, Sotoodehnia N, Turan TN, Virani SS, Wong ND, Woo D, Turner MB. Heart Disease and Stroke Statistics—2012 Update: A Report From the American Heart Association. Circulation. 2011;125:e2–e220. doi: 10.1161/CIR.0b013e31823ac046. [DOI] [PMC free article] [PubMed] [Google Scholar]
- Schlachetzki F, Herzberg M, Holscher T, Ertl M, Zimmermann M, Ittner KP, Pels H, Bogdahn U, Boy S. Transcranial ultrasound from diagnosis to early stroke treatment: part 2: Prehospital neuro-sonography in patients with acute stroke: the Regensburg stroke mobile project. Cerebrovasc Dis. 2012;33:262–271. doi: 10.1159/000334667. [DOI] [PubMed] [Google Scholar]
- Schlachetzki F, Holscher T, Koch HJ, Draganski B, May A, Schuierer G, Bogdahn U. Observation on the integrity of the blood-brain barrier after microbubble destruction by diagnostic transcranial color-coded sonography. J Ultrasound Med. 2002;21:419–429. doi: 10.7863/jum.2002.21.4.419. [DOI] [PubMed] [Google Scholar]
- Seidel G, Kaps M, Gerriets T. Potential and limitations of transcranial color-coded sonography in stroke patients. Stroke. 1995;26:2061–2066. doi: 10.1161/01.str.26.11.2061. [DOI] [PubMed] [Google Scholar]
- Shimizu J, Fukuda T, Abe T, Ogihara M, Kubota J, Sasaki A, Azuma T, Sasaki K, Shimizu K, Oishi T, Umemura S, Furuhata H. Ultrasound safety with midfrequency transcranial sonothrombolysis: preliminary study on normal macaca monkey brain. Ultrasound Med Biol. 2012;38:1040–1050. doi: 10.1016/j.ultrasmedbio.2012.02.009. [DOI] [PubMed] [Google Scholar]
- Smith SW. Biomedical Engineering Department. Duke University; Durham, NC: 1975. Information processing for improved acoustic imaging through aberrating media. Ph.D.: dissertation. [Google Scholar]
- Smith SW, Ivancevich NM, Lindsey BD, Whitman JJ, Light ED, Fronheiser MP, Nicoletto HA, Laskowitz DT. The ultrasound brain helmet: Feasibility study of multiple simultaneous 3-D scans of cerebral vasculature. Ultrasound in Medicine and Biology. 2009;35:329–338. doi: 10.1016/j.ultrasmedbio.2008.08.016. [DOI] [PubMed] [Google Scholar]
- Smith WS, Roberts HC, Chuang NA, Ong KC, Lee TJ, Johnston SC, Dillon WP. Safety and feasibility of a CT protocol for acute stroke: combined CT, CT angiography, and CT perfusion imaging in 53 consecutive patients. AJNR Am J Neuroradiol. 2003;24:688–690. [PMC free article] [PubMed] [Google Scholar]
- Tanter M, Aubry JF, Gerber J, Thomas JL, Fink M. Optimal focusing by spatio-temporal inverse filter. I. Basic principles. J Acoust Soc Am. 2001;110:37–47. doi: 10.1121/1.1377051. [DOI] [PubMed] [Google Scholar]
- Tobias M, Cheung J, Carter K, Anderson C, Feigin VL. Stroke surveillance: population-based estimates and projections for New Zealand. Aust N Z J Public Health. 2007;31:520–525. doi: 10.1111/j.1753-6405.2007.00136.x. [DOI] [PubMed] [Google Scholar]
- Valdueza JM, Schreiber SJ, Roehl JE, Klingebiel R. Neurosonology and Neuroimaging of Stroke. New York: Thieme; 2008. [Google Scholar]
- Vignon F, Aubry JF, Tanter M, Margoum A, Fink M. Adaptive focusing for transcranial ultrasound imaging using dual arrays. J Acoust Soc Am. 2006;120:2737–2745. doi: 10.1121/1.2354073. [DOI] [PubMed] [Google Scholar]
- Vignon F, Shi WT, Erkamp R, Radulescu E, Shamdasani V, Powers JE. Mapping skull attenuation for optimal probe placement in transcranial ultrasound applications. IEEE Ultrasonics Symposium. 2009:2336–2339. [Google Scholar]
- Walter S, Kostopoulos P, Haass A, Keller I, Lesmeister M, Schlechtriemen T, Roth C, Papanagiotou P, Grunwald I, Schumacher H, Helwig S, Viera J, Korner H, Alexandrou M, Yilmaz U, Ziegler K, Schmidt K, Dabew R, Kubulus D, Liu Y, Volk T, Kronfeld K, Ruckes C, Bertsch T, Reith W, Fassbender K. Diagnosis and treatment of patients with stroke in a mobile stroke unit versus in hospital: a randomised controlled trial. Lancet Neurol. 2012;11:397–404. doi: 10.1016/S1474-4422(12)70057-1. [DOI] [PubMed] [Google Scholar]
- Wessels T, Bozzato A, Mull M, Klotzsch C. Intracranial collateral pathways assessed by contrast-enhanced three-dimensional transcranial color-coded sonography. Ultrasound Med Biol. 2004;30:1435–1440. doi: 10.1016/j.ultrasmedbio.2004.05.011. [DOI] [PubMed] [Google Scholar]
- White DN, Stevenson RJ. The acoustic characteristics of the skull. Ultrasound in Medicine and Biology. 1978;4:225–252. doi: 10.1016/0301-5629(78)90054-6. [DOI] [PubMed] [Google Scholar]
- Wijnhoud AD, Franckena M, van der Lugt A, Koudstaal PJ, Dippel ED. Inadequate acoustical temporal bone window in patients with a transient ischemic attack or minor stroke: role of skull thickness and bone density. Ultrasound Med Biol. 2008;34:923–929. doi: 10.1016/j.ultrasmedbio.2007.11.022. [DOI] [PubMed] [Google Scholar]
- Wilson MH, Levett DZ, Dhillon S, Mitchell K, Morgan J, MPWG, Imray C. Stroke at high altitude diagnosed in the field using portable ultrasound. Wilderness & Environmental Medicine. 2011;22:54–57. doi: 10.1016/j.wem.2010.10.007. [DOI] [PubMed] [Google Scholar]
- World Health Organization. The top 10 causes of death: Fact sheet no. 310. [accessed 2011];2008 http://www.who.int/mediacentre/factsheets/fs310/en/index.html.
- Yousefi A, Goertz DE, Hynynen K. Transcranial shear-mode ultrasound: assessment of imaging performance and excitation techniques. IEEE Trans Med Imaging. 2009;28:763–774. doi: 10.1109/TMI.2008.2012017. [DOI] [PubMed] [Google Scholar]