Figure 1.
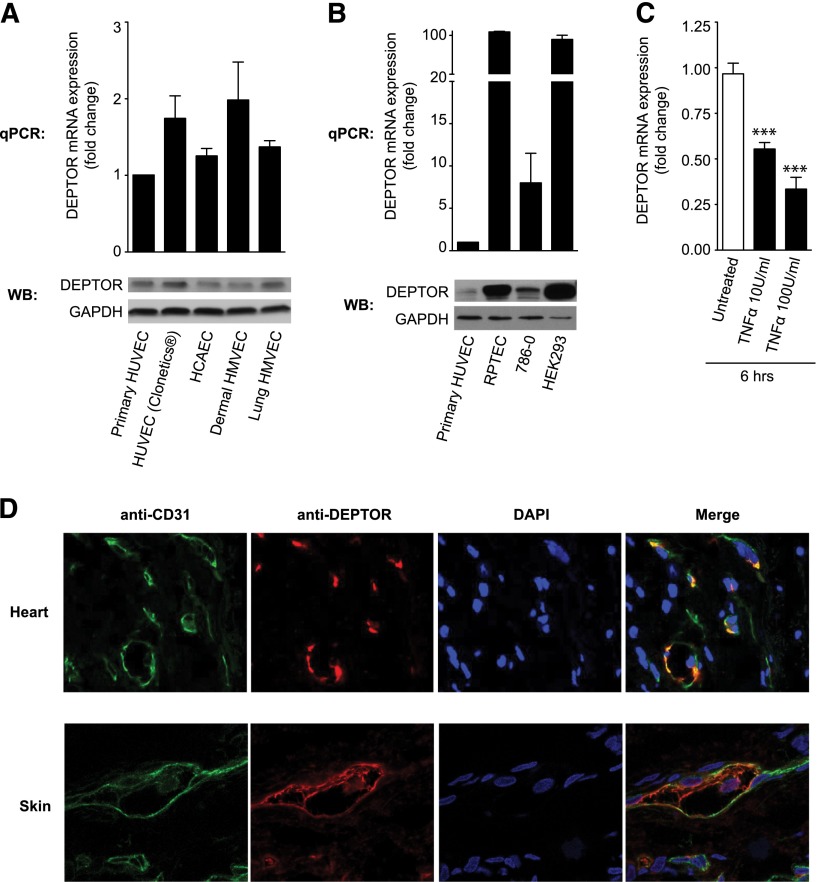
DEPTOR expression in human vascular ECs. (A) DEPTOR expression was analyzed at the mRNA level by quantitative PCR (qPCR) and at the protein level by western blot analysis in primary cultures of HUVECs, commercially available HUVECs, human coronary artery ECs, and dermal and lung human microvascular ECs (HMVECs). Illustrated is the mean fold change in mRNA expression ± standard error of the mean (SEM) from 3 independent experiments. (B) qPCR and western blot analysis of DEPTOR expression in HUVECs compared with renal proximal tubule epithelial cells (RPTECs), renal cancer 786-0 cells, and human embryonic kidney HEK293 cells. Representative of 3 experiments. (C) HUVECs were treated with TNFα (10 or 100 U/mL) for 6 hours, and DEPTOR mRNA expression was subsequently analyzed by qPCR. The bar graph represents the mean fold change in DEPTOR mRNA expression (±SEM) in 5 independent experiments (***P < .001). (D) Human cardiac tissue (atrium) and skin were evaluated by double immunofluorescence for the expression of DEPTOR or endothelial-specific CD31, as indicated. Illustrated are representative confocal images where DEPTOR (red) was found to colocalize with ECs (green) in each tissue. The yellow staining in the merged image is representative of colocalization.

