Summary
The PhoQ/PhoP two-component system activates many genes for lipopolysaccharide (LPS) modification when cells are grown at low Mg2+ concentrations. An additional target of PhoQ and PhoP is MgrR, an Hfq-dependent small RNA that negatively regulates expression of eptB, also encoding a protein that carries out LPS modification. Examination of LPS confirmed that MgrR effectively silences EptB; the phosphoethanolamine modification associated with EptB is found in ΔmgrR::kan but not mgrR+ cells. Sigma E has been reported to positively regulate eptB, although the eptB promoter does not have the expected Sigma E recognition motifs. The effects of Sigma E and deletion of mgrR on levels of eptB mRNA were independent, and the same 5′ end was found in both cases. In vitro transcription and the behavior of transcriptional and translational fusions demonstrate that Sigma E acts directly at the level of transcription initiation for eptB, from the same start point as Sigma 70. The results suggest that when Sigma E is active, synthesis of eptB transcript outstrips MgrR-dependent degradation; presumably the modification of LPS is important under these conditions. Adding to the complexity of eptB regulation is a second sRNA, ArcZ, which also directly and negatively regulates eptB.
Keywords: LPS, Sigma E, PhoPQ, sRNA
Introduction
Lipopolysaccharide (LPS) modification in Escherichia coli and other enterobacteria plays an important role in the ability of these cells to thrive in hosts and to be successful pathogens (Trent, 2004). Many such modifications render the cell more resistant to antimicrobial peptides and/or may shield the cell from the immune system. Many of the genes encoding the modifying enzymes are positively regulated by the PhoQ/PhoP two-component system, studied most extensively in Salmonella (Raetz et al., 2007). The histidine kinase, PhoQ, is activated during growth at low Mg2+ concentrations or after exposure to antimicrobial peptides, and phosphorylates the response regulator, PhoP (Groisman, 2001). PhoP-P binds to and activates transcription of genes involved in both Mg2+ transport and LPS modification (reviewed in (Kato & Groisman, 2008)). We demonstrated that a small RNA (sRNA), MgrR, was also positively regulated by PhoQ/PhoP (Moon & Gottesman, 2009). We found that MgrR strongly negatively regulated expression of eptB, a gene encoding a phosphethanolamine (pEtN) transferase that modifies the outer 3-deoxy-d-manno-octulosonic acid (Kdo) of the E. coli LPS core (Moon & Gottesman, 2009). When MgrR is absent, cells are modestly less susceptible to the antimicrobial peptide polymyxin B and that resistance is reversed by deleting eptB. Therefore, in addition to the PhoQ/PhoP positive regulation of expression of other LPS modifying enzymes, PhoQ/PhoP negatively regulates eptB, indirectly via the sRNA.
The other intriguing characteristic of eptB is that its expression is fully silenced by MgrR under normal laboratory growth conditions. In cells grown in LB, mRNA for the eptB gene is below levels detectable by Northern blot, unless mgrR is deleted (Moon & Gottesman, 2009). When, then, is eptB expressed, and when does its function in modifying LPS matter? One hint to this was provided by the observation that eptB is significantly upregulated by inactivation of Hfq, and that this is because an hfq mutant upregulates Sigma E expression (Klein et al., 2011, Figueroa-Bossi et al., 2006). Sigma E, also called σ24, is encoded by the rpoE gene. Sigma E regulated functions, referred to as an envelope stress response, generally deal with unfolded or misfolded proteins in the periplasm (reviewed in (Ho & Ellermeier, 2012)). This suggests that under Sigma E activation conditions, eptB is expressed, even in the presence of MgrR. In this work, we demonstrate that the EptB-dependent LPS modification is negatively regulated by MgrR. We find that at least part of the previously reported Ca2+ activation of EptB is due to down-regulation of MgrR synthesis. We have confirmed Sigma E regulation of eptB; although the promoter was not originally identified as directly regulated by Sigma E (Rhodius et al., 2006), we find that it is recognized by Sigma E in vitro. Finally, we have identified a second sRNA, ArcZ, that negatively regulates eptB. The results suggest a complex regulatory network controlling this enzyme, suggesting an important role for it as well as other LPS modifying enzymes of this sort, in cell physiology and/or pathogenesis.
Results
LPS modification by EptB is silenced by MgrR
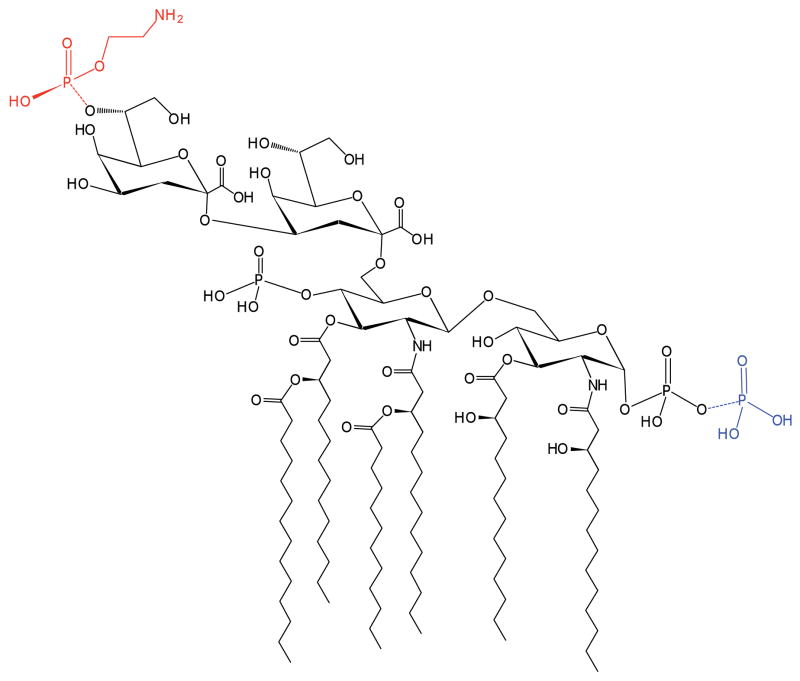
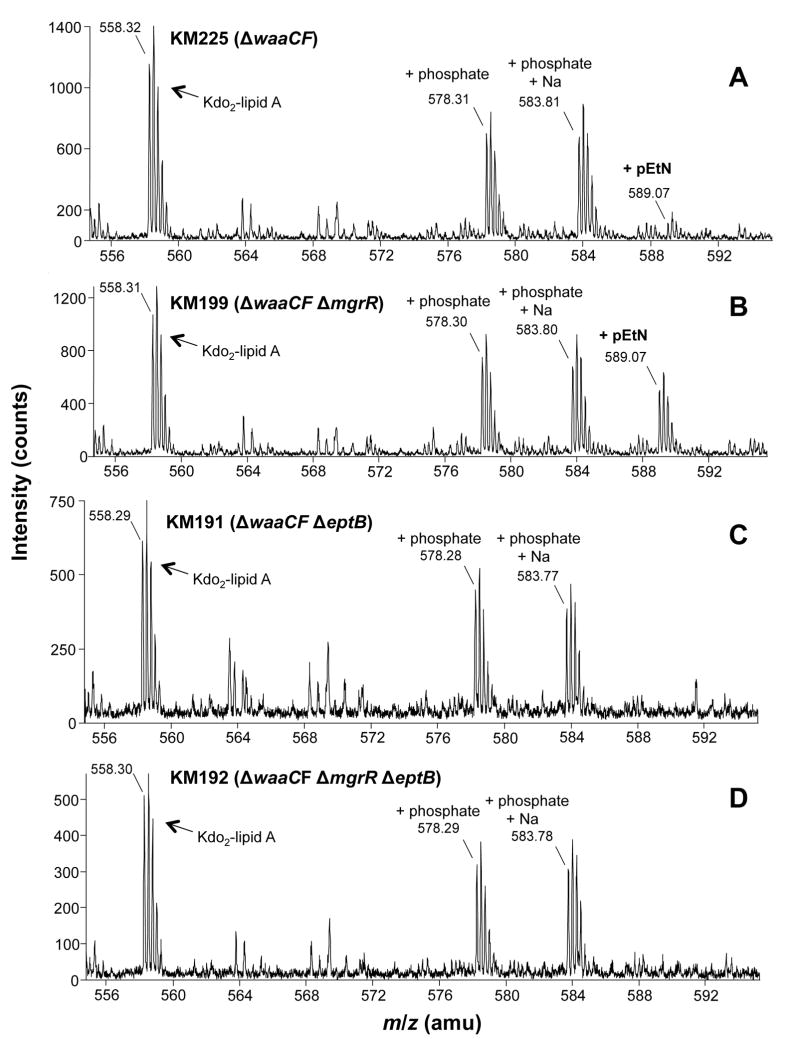
In previous work, we have shown that MgrR negatively regulates eptB mRNA levels (Moon & Gottesman, 2009). There is a predicted direct pairing of MgrR with eptB, overlapping the eptB start codon. The increase in EptB-dependent polymyxin resistance when mgrR is deleted (Moon & Gottesman, 2009) strongly suggested that MgrR expression is sufficient to silence EptB-dependent modifications. Strains producing deep-rough LPS were employed to examine the effects of MgrR and EptB because of the ability to detect the Kdo modification in the deep-rough LPS (Kanipes et al., 2001). The LPS from these strains is composed of Kdo2-lipid A (Fig. 1), which lacks O-antigen and core sugars due to deletion of the core heptosyltransferases, waaC and waaF. The LPS from a set of isogenic strains, all carrying this deletion, were examined by electrospray ionization mass spectrometry (ESI-MS). Strains were otherwise wild-type or carried deletions in mgrR, mgrR and eptB, or eptB alone. The deep-rough LPS species were present as negatively-charged ions with 2 to 4 negative charges. Peaks corresponding to the quadruply-charged and doubly-charged ions were well separated from unrelated phospholipid peaks (600-800 m/z) and showed consistent results with one another (Fig. 2 and Fig. S1, respectively). A quadruply-charged peak consistent with the [M-4H]4- ion of unmodified Kdo2-lipid A is present in all strains around 558.3 m/z (Fig. 2). In addition, the mass spectrum from each strain has peaks (approx. 578.3 and 583.8 m/z) consistent with Kdo2-lipid A with an extra phosphate group, presumably due to the action of LpxT. LpxT catalyzes the transfer of a phosphate group from undecaprenyl pyrophosphate to lipid A to form the lipid A 1-diphosphate in the periplasm (Touze et al., 2008). In the ΔmgrR strain, the peak at 589.07 m/z is elevated relative to the mgrR+ strain (Fig. 2B vs Fig. 2A). The LPS peak assignments for Fig. 2 with calculated and observed masses are listed in Table 1. The 589.07 m/z peak corresponds to the [M-4H]4- ion of pEtN-modified Kdo2-lipid A. The detection of minor pEtN modification in the parental deep rough strain suggests some eptB expression despite the silencing effects of mgrR. The spectrum for the LPS doubly-charged region also shows that the pEtN-modified peak (1179.12 m/z) is elevated in the ΔmgrR strain (Fig. S1B vs S1A). The LPS peak assignments for Fig. S1 with calculated and observed masses are listed in Table S1. In the eptB single and mgrR eptB double mutant, the pEtN modification is absent (Fig. 2 and Fig. S1), as expected. The absence of the pEtN modification is fully consistent with the pEtN modification being catalyzed exclusively by EptB (Reynolds et al., 2005).
Figure 1. Structure of LPS from the E. coli ΔwaaCF mutant.
Deep-rough mutants of Gram-negative bacteria lack O-antigen and most of the core-oligosaccharide normally attached to the inner Kdo sugar of LPS. The LPS from the ΔwaaCF deep-rough mutant of E. coli is composed of hexa-acylated Kdo2-lipid A. Under normal laboratory growth conditions, a portion of the LPS can be modified by LpxT with an additional phosphate at the 1-position (as shown in blue). A minor portion of the LPS can be modified by EptB with pEtN at the outer Kdo sugar (as shown in red).
Figure 2.
ESI-MS analysis of quadruply-charged LPS from ΔwaaCF derivatives.
The window of the ESI mass spectra containing peaks for the quadruply-negatively charged LPS ions. The spectra derive from the total lipid extracts of A) KM225 (ΔwaaCF), B) KM199 (ΔwaaCFΔmgrR), C) KM191 (ΔwaaCFΔeptB), and D) KM192 (ΔwaaCFΔmgrRΔeptB). All four strains were grown in LB medium. The structure of the LPS is shown in Fig. 1 and the peak assignments are in Table 1.
Table 1.
Lipid A peak assignments from Fig. 1.
| Peak assignment | [M-4H]4- Calculated m/z | KM225a[M-4H]4- Observed m/z | KM199 [M-4H]4- Observed m/z | KM191 [M-4H]4- Observed m/z | KM192 [M-4H]4-Observed m/z |
|---|---|---|---|---|---|
| Kdo2-lipid A | 558.307 | 558.32 | 558.31 | 558.29 | 558.30 |
| +phosphate | 578.318 | 578.31 | 578.30 | 578.28 | 578.29 |
| +phosphate | 583.814 | 583.81 | 583.80 | 583.77 | 583.78 |
| +Na | |||||
| +pEtN | 589.079 | 589.07 | 589.07 | N.D.b | N.D. |
All strains were grown in LB medium as described.
N.D., not detected.
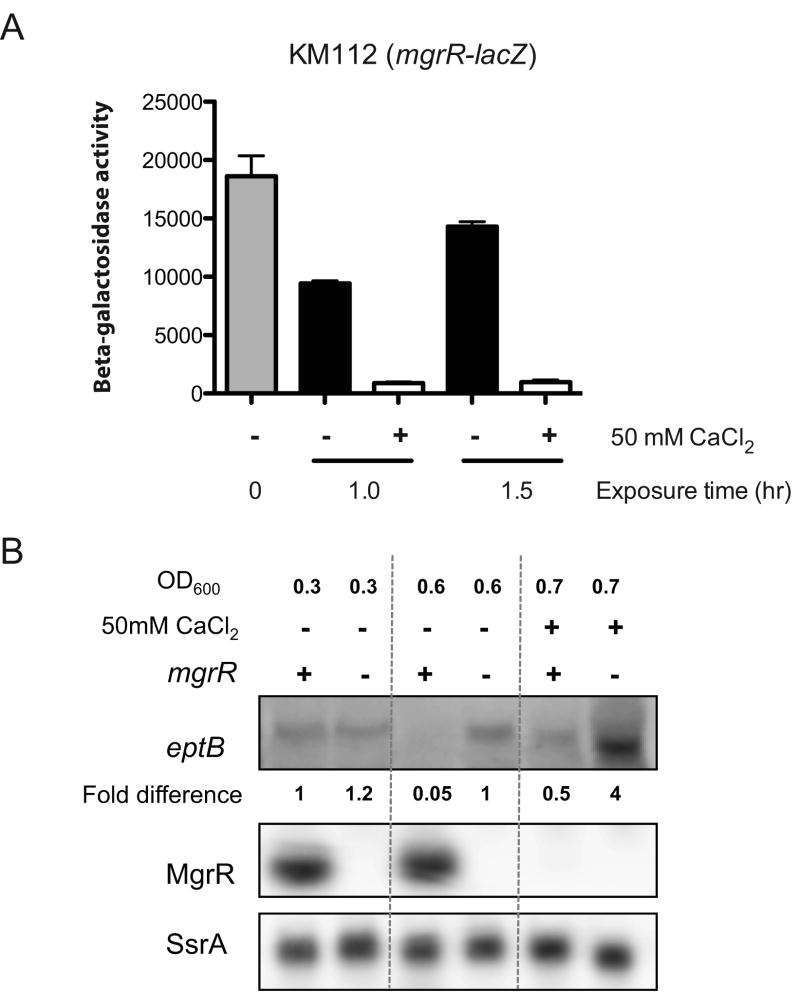
In previous work, EptB was found to show increased levels of activity at high Ca2+ concentrations, and ΔwaaCF cells also missing eptB were sensitive to high Ca2+ levels (Kanipes et al., 2001, Reynolds et al., 2005). We confirmed that growth with high levels of Ca2+ led to significant increases in pEtN modification for the ΔwaaCF strain (Fig. S2 and Fig. S3). The LPS peak assignments for Fig. S2 and Fig. S3 with calculated and observed masses are listed in Table S2 and Table S3, respectively. Previous work demonstrated that the pEtN-modification induced with high Ca2+ levels is located on the outer Kdo residue and is catalyzed by EptB (Kanipes et al., 2001) (Fig. 1). The Ca2+-induced activation of pEtN modification could occur at many levels. The expression of MgrR is significantly decreased at high Ca2+ levels (Fig. 3), measured both with a reporter fusion to the mgrR promoter (Fig. 3A) and by measurement of MgrR RNA (Fig. 3B). Such an effect of high Ca2+ levels on PhoPQ promoters has been seen before (Vescovi et al., 1997). Under these conditions, the mRNA for eptB is increased in the mgrR+ host (Fig. 3B; compare level of .05 without CaCl2 addition, OD 0.6, to .5 with CaCl2 addition, OD 0.7).
Figure 3.
Ca2+ regulation of MgrR. A.
Ca2+ repression of fusion. KM112, carrying an mgrR-lacZ transcriptional fusion, was grown in LB at 37°C to exponential phase (0′ sample, OD6000.25) and split into two cultures, with or without 50mM CaCl2. Samples were taken after 1.0 (OD600 of 1.2 without CaCl2 and 1.1 with CaCl2) and 1.5 hr (OD600 of 1.9 without CaCl2 and 1.7 with CaCl2) exposure to CaCl2 and the activity of β-galactosidase measured. The error bars show standard deviation after two trials. B. Ca2+ effects on MgrR RNA and eptB mRNA. Northern blot analysis of eptB, MgrR and SsrA in a wild-type strain (MG1655) and an mgrR mutant strain (KM201). Cells were grown in LB at 37°C to exponential phase and split into two cultures for incubation with or without 50 mM CaCl2. Samples were collected when the OD600 reached 0.6 and 0.7 after CaCl2 exposure respectively and RNA was extracted and analyzed as described in Experimental Procedures. Normalization was set to levels of SsrA.
Our data suggest that high Ca2+ must also act through an additional mechanism. Ca2+ treatment increased the level of eptB mRNA even in ΔmgrR cells (Fig. 3B), and the level of Ca2+-induced pEtN modification of the LPS was also further increased for a ΔwaaCF ΔmgrR strain (Fig. S2 and S3). Interestingly, we also observed another Ca2+-dependent change in the LPS from both strains – a complete loss of the LPS 1-diphosphate, presumably formed by the action of LpxT (Fig. S2 and Fig. S3). In Salmonella, the activity of LpxT is negatively regulated by PmrA, via expression of an inhibitory peptide, PmrR that directly inhibits LpxT (Herrera et al., 2010, Kato et al., 2012). Indeed, LpxT inhibition is necessary for full pEtN-modification of the Salmonella lipid A by EptA (Herrera et al., 2010). A similar regulation could be at play with LpxT and EptB in E. coli in response to increased Ca2+; this was not further studied here.
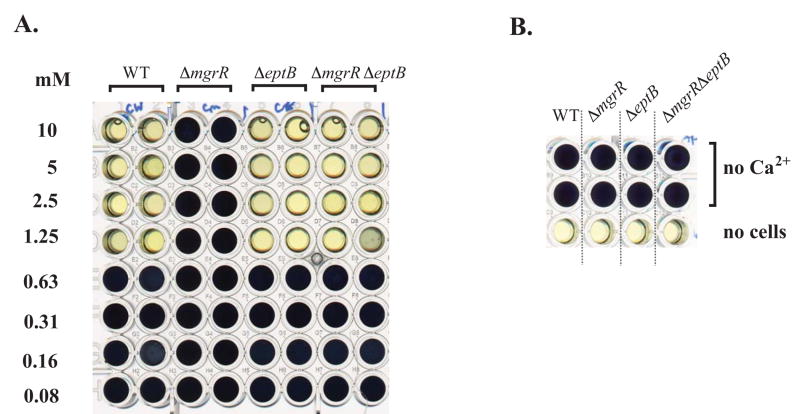
We extended these observations by determining the minimum inhibitory concentration of Ca2+ in a broth microdilution assay for each strain (Fig. 4). In this assay, viable cells metabolize yellow [4,5-dimethylthiazol-2-yl]-2,5-diphenyltetrazolium bromide (MTT) to produce the insoluble dark blue MTT formazan. Controls with and without cells are shown in Fig. 4B. Cells synthesizing LPS with intact core (waaCF+) were Ca2+-resistant under these conditions (data not shown). In the ΔwaaCF background, the wild-type cells and cells deleted for eptB were unable to grow at Ca2+ concentrations of 1.25 mM and higher. Deletion of mgrR allowed growth up to the highest concentration tested (10 mM). However, this resistance was lost when eptB was also deleted (last two rows, ΔmgrR ΔeptB). This result is consistent with previous findings that the activity of EptB provided protection from high calcium toxicity (Reynolds et al., 2005), and demonstrates that EptB function appears in the absence of MgrR, consistent with the modification seen in Fig. 2.
Figure 4. Ca2+ sensitivity of ΔwaaCF derivatives.
Cell viability was measured with MTT in microtiter wells containing CaCl2 at the indicated concentrations, as described in Experimental Procedures (MIC); yellow wells have no viable cells present. A. Strains are as in Fig. 2. B. Wells without cells were used as negative controls and wells without added Ca2+ (marked as no drug) in the presence of cells were used as positive controls. This experiment was carried out in duplicate in two independent trials and showed the same result.
Effects of Sigma E on eptB expression
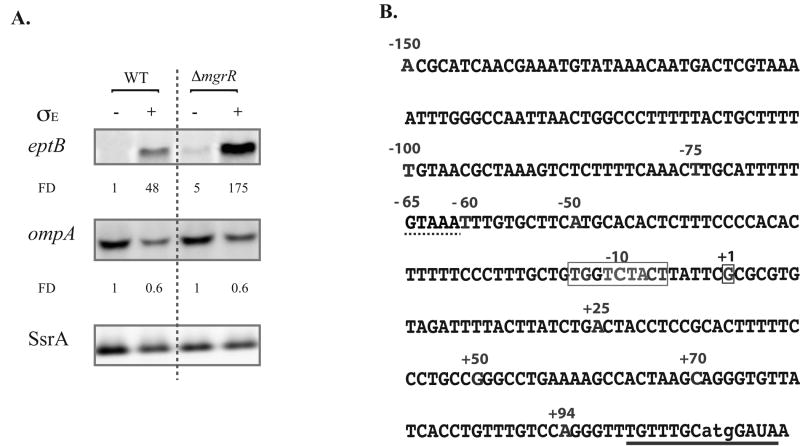
As noted above, it has been reported that an eptB fusion is well expressed when Sigma E activity is high (Figueroa-Bossi et al., 2006). In those experiments, the translational fusion site was about one-quarter of the way into the open reading frame for eptB (Figueroa-Bossi et al., 2006). In microarrays, overexpression of Sigma E led to increased eptB mRNA, in a pattern similar to that seen for known Sigma E-dependent promoters, although no Sigma E-dependent promoter could be identified (Rhodius et al., 2006). We re-examined the effect of Sigma E on eptB mRNA by Northern blot, in the presence and absence of MgrR, with and without overexpression of Sigma E (Fig. 5A). We used ompA mRNA, which is known to be negatively regulated by the Sigma E-dependent MicA sRNA (Udekwu & Wagner, 2007, Johansen et al., 2006) as a control for Sigma E induction. Levels of RNA were normalized to SsrA, which was found to decrease modestly after Sigma E induction. Levels of eptB mRNA increased almost 50-fold upon induction of Sigma E in an otherwise wild-type host (Fig. 5A). The basal level of eptB increased 5-fold upon deletion of mgrR, consistent with previous observations (Fig. 5A) (Moon & Gottesman, 2009). The effect of Sigma E and MgrR appeared to be independent and additive; when Sigma E was induced in the ΔmgrR strains, levels of the eptB transcript increased 3.5-fold over the level when Sigma E was induced in the wild-type host, and 35-fold relative to the levels in the ΔmgrR strain (Fig. 5A). Thus, under conditions of Sigma E induction, eptB mRNA accumulated, even if MgrR was expressed.
Figure 5.
The effect of Sigma E on eptB transcripts and the sequence of the eptB promoter and leader.
A. The levels of eptB mRNA were compared by northern blot analysis with and without the induction of Sigma E from an inducible promoter (pTrc99A for control and pTrc99A-sigmaE for Sigma E) in the wild type (NM22540) and mgrR mutant (KM129) in two independent experiments. The fold difference (FD) was obtained as the ratio of mRNA after induction of pTrc99A-sigmaE to levels after induction of the control vector. ompA was used as a positive control whose expression was negatively regulated (indirectly) by Sigma E. Normalization was set to levels of SsrA. B. The sequence of the eptB promoter +1 was obtained by 5′ RACE as described in material and methods. Numbers listed defines end-points for various promoter lacZ fusions. The grey boxes indicate a possible extended -10 and +1, and the dashed line shows the conserved motif mutated in Fig. 6 (-65 motif). The solid line represents the sequence that base pairs with MgrR.
5′ RACE experiments were carried out in cells deleted for mgrR, with and without Sigma E induction (data not shown); the same +1 was found (Fig. 5B). This +1 gives a 106 nt 5′ UTR, and is preceded by an extended -10 (TGgTCTACT) (Fig. 5B).
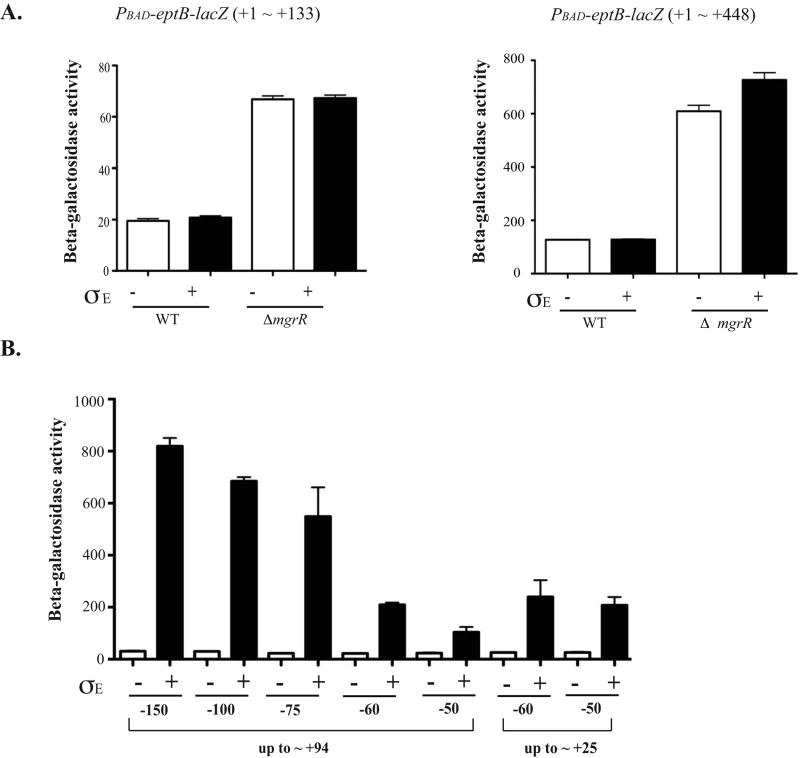
Two types of lacZ fusions were examined to further define the level of Sigma E action. First, two translational fusions were tested (Fig. 6A). The first of these fusions (+1- +448) is similar in extent to that tested by Figueroa-Bossi et al. (Figueroa-Bossi et al., 2006), but the eptB promoter has been replaced by a pBAD promoter; the fusion joint is at position +448 relative to the +1, or at codon 94 of eptB. The other fusion (+1- +133) has only the beginning (first 10 codons) of the eptB coding region. The fusions were assayed in a wild-type strain and in a ΔmgrR mutant, with and without induction of Sigma E. As expected, deletion of mgrR led to a significant increase in expression of both of these translational fusions. However, Sigma E induction had little effect on either fusion. Thus, changing the promoter abolishes all or almost all of the Sigma E-dependent regulation seen by Figueroa-Bossi et al (Figueroa-Bossi et al., 2006), and does not show the induction seen by Northern blots (compare Fig. 6A to Fig. 5A). Therefore, we conclude that Sigma E does not significantly stimulate eptB mRNA stability or translation, directly or indirectly, making it likely Sigma E acts at the level of transcription. On the other hand, MgrR acts independently of the promoter, and independently of sequences beyond the start of eptB, consistent with previous work (Moon & Gottesman, 2009).
Figure 6. Regulation of eptB by sigma E.
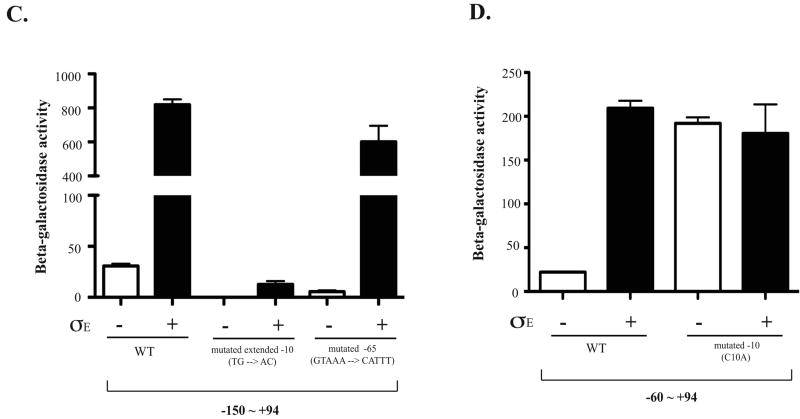
A. Two different translational fusions of eptB were constructed; each is expressed from an arabinose inducible promoter (PBAD). One (KM125) contains from +1 to +133 of the eptB mRNA, which includes the sequence encoding 9 amino acids of eptB and the other one contains from +1 to +448 (KM233); this should be similar to the fusion used by Figueroa-Bossi et al (Figueroa-Bossi et al., 2006), but with the promoter exchanged. Cells containing either a control vector or a vector harboring Sigma E under the inducible promoter (Ptec) were inoculated in LB with ampicillin and a final concentration of 100 uM of IPTG and 0.2% arabinose. The cells were collected at 5 hours (OD600 = 1∼2). The Miller assay was performed to measure the activity of β-galactosidase in both WT and mgrR deletion backgrounds. The results reported are representative of at least three experimental trials. Error bars indicate standard deviations. B. Various upstream regions of eptB promoter fusions were constructed to examine the effect of Sigma E. Also, two different lengths of the DNA downstream of +1 were used to characterize the minimal promoter element for the regulation, +25 and +94. Cells were grown for 5 hours to reach the stationary phase in the presence of IPTG with either the control vector or the Sigma E plasmid and collected for a Miller assay to measure the enzyme activity. The results reported are representative of four independent experimental trials and standard deviations are shown as error bars. C. Cells were grown and assayed as for A and B. A possible extended -10 (TG→AC) (KM250) and GTAAA box located at -65 were mutated in the background of KM 238 (-150 ∼ +94) (KM299). The wild-type data are the same as for panel B. D. Cells were grown and assayed as for A and B. The -10 mutation (C→A) (KM202-1) was an inadvertant change identified during screening of various fusions and saved. It is compared to its wild-type sibling (KM202-3), also shown in Fig. 6B.
The role of Sigma E was examined further with a set of transcriptional fusions that contained varying amounts upstream of the +1 (promoter and upstream regulatory regions) and the first 94 nt of the eptB leader, all transcriptionally fused to lacZ (Fig. 6B). The expression of these fusions was increased significantly by expression of Sigma E; deletion of the upstream DNA gradually reduced the maximal level of expression but did not abolish stimulation. Deleting the downstream region to +25 gave a similar level of activity, strongly suggesting that downstream sequences are not needed for this effect. The results from the transcriptional and translational fusions together point to a strong stimulatory effect of Sigma E on transcription initiation. Theoretically, Sigma E could act indirectly, by regulating an activator that acts upstream of the Sigma 70 promoter of eptB. However, if that were the case, we would have expected loss of the upstream binding site for such an activator to lead to a loss of all Sigma E stimulation. This was not seen; the pattern of a gradual decrease with decreasing upstream sequences would suggest that upstream sequences, while somewhat stimulatory, are not essential for Sigma E to act.
Given these results as well as the observation that the same starting point was found for transcripts in cells deleted of mgrR and those overexpressing Sigma E, we reconsidered the possibility that Sigma E might act directly on the promoter for eptB. If so, we would expect that the eptB promoter can be read by both Sigma 70 and Sigma E, as seen previously for other promoters (Wade et al., 2006). An alignment of the promoter and leader region of eptB from related organisms (Fig. S4) suggests an extended -10 (TGgTcTacT) is present at the appropriate position upstream of the starting G nucleotide, and is fully conserved. At the position of the -35, ACACTTTT is found (highlighted in Fig. S4); this is fully conserved in Escherichia fergusonii and partially conserved in Salmonella, Enterobacter, and Klebsiella. Upstream, an A/T rich region is the clearest conserved element (shaded in Fig. S4). The promoter sequence was compared to the Sigma E consensus developed by Rhodius et al (Rhodius et al., 2006). We observed an overlap (underlined consensus positions in Fig. S4) that includes the conserved regions within the eptB promoter. The extended A/T rich upstream region would be consistent with an UP element; deletion of it would be expected to reduce but not abolish promoter activity for both sigma factors, as seen in Fig. 6B (Wade et al., 2006).
Mutations were introduced into the promoter fusion and are consistent with a bifunctional promoter. Mutation of one conserved motif at -65 (GTAAA to CATTT; within shaded region in Fig. S4) reduced the basal level from 31 units to 19 units but not the ability of Sigma E to stimulate, suggesting this motif may be specifically needed for the activity of Sigma 70 at this promoter (Fig. 6C). Mutation of the extended -10 conserved TG to AC abolished the basal activity of the promoter and also drastically reduced the ability of Sigma E to stimulate it, consistent with this sequence playing a role for both sigma factors (Fig. 6C). Given the alignment in Fig. S4, this would be expected. Mutation of the -10 from TCTACT to TCTAAT increased the basal level of expression ten-fold, and Sigma E did not increase it further (Fig. 6C). Because this change should significantly improve the ability of Sigma 70 to work at this promoter, it may bypass the Sigma E requirement.
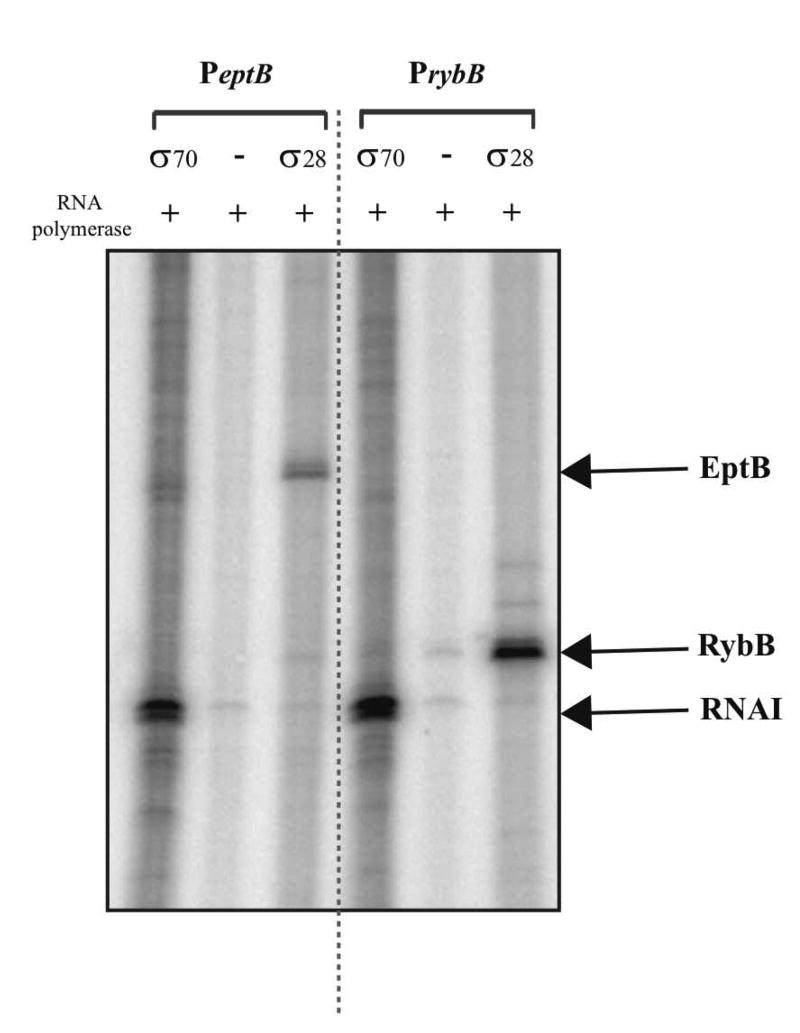
We next confirmed the existence of a Sigma E-dependent promoter by in vitro transcription studies (Fig. 7, left panel). Transcription of eptB was observed by purified Sigma E (σ24); it is less clear that Sigma 70 (σ70 in figure) was able to stimulate transcription in vitro. Given the observation of an essential site at -65 (Fig. 6C), it seems possible that transcription by Sigma 70 depends on an activator missing from the purified in vitro system. The promoter of rybB, a known strong Sigma E-dependent promoter (Thompson et al., 2007), was used as a positive control; Sigma E but not Sigma 70 stimulated transcription from this promoter (Fig. 7, right panel).
Figure 7. Sigma E-dependent regulation of theeptBpromoter in vitro.
Single round in vitro transcription from plasmid templates in the presence of either Sigma E or Sigma 70 was carried out as described in Experimental Procedures. The rybB promoter was used as a positive control for a Sigma E-dependent promoter and the plasmid RNAI transcript served as a positive control for a Sigma 70-dependent promoter. A representative experiment is shown; two independent assays were performed with very similar results.
It seemed possible that Ca2+ would affect sigma E activity or levels, providing an additional level of induction of eptB. However, no increase in expression of the P1 and P2 promoters of rpoE, encoding sigma E, was found upon treatment with Ca2+ (Fig. S5). P2 is sigma E regulated (Rouviere et al., 1995), and thus should show an increase if sigma E activity were increased.
An additional sRNA regulator of eptB
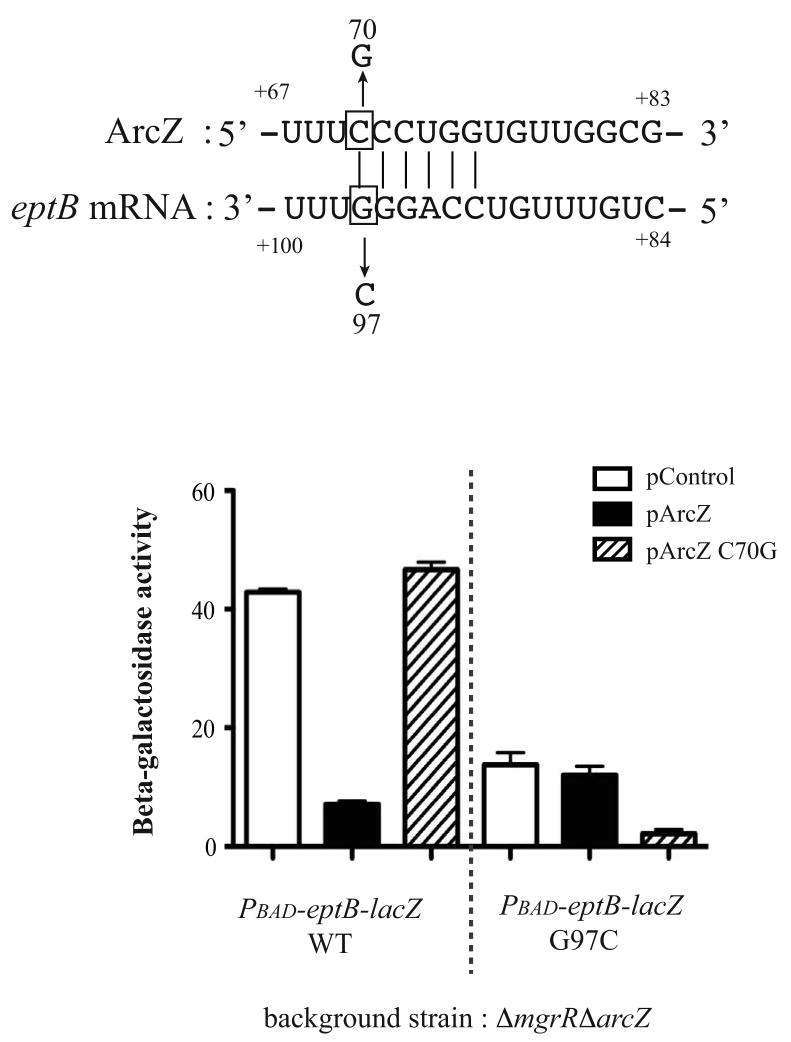
The data above supports our previous demonstration of a role for negative regulation of eptB by MgrR (Moon & Gottesman, 2009). In a prior study, we also screened the PBAD-eptB-lacZ translational fusion for the effect of 24 sRNAs, each over-expressed from a plac promoter on a plasmid. The resulting RNA landscape (Moon & Gottesman, 2011) demonstrated negative regulation by MgrR, as expected, but also negative regulation by ArcZ. No other sRNA negative regulators were detected. The effect of ArcZ was confirmed and extended in the experiment shown in Fig. 8. ArcZ and eptB are predicted to pair, overlapping the eptB Shine-Dalgarno (SD) region (Fig. 8). Note that the AUG of eptB is at +107, numbering from the start of transcription, so that the mutant in eptB tested in Fig. 8 at G97 is just 10 nt upstream of the AUG. The importance of the predicted pairing was confirmed with mutations and compensating mutations. Overproduction of wild-type ArcZ down-regulated the eptB-lacZ fusion; a single mutation in ArcZ, C70G, abolished that regulation. The compensating mutation in eptB, G97C, significantly lowered the expression of the fusion, presumably because ribosome entry was impaired. However, the wild-type ArcZ had no effect on this fusion, while the ArcZ C70G mutation that restored pairing significantly reduced expression. Therefore, the predicted pairing is required for in vivo regulation by ArcZ. ArcZ is rapidly processed; the mutation is within the processed fragment thought to be the active moiety of ArcZ and overlaps the region of ArcZ that positively regulates RpoS (Mandin & Gottesman, 2010, Papenfort et al., 2009).
Figure 8. The regulation of ArcZ on theeptBmRNA by base pairing.
A. Predicted base pairing between ArcZ and the eptB leader region. Nucleotides are numbered from the +1 (transcriptional start site) of the eptB mRNA; translational start site is at nt 107. Mutated nucleotides are boxed and the changes made in them are shown.
B. Effect of wild type ArcZ or a C70G mutation in ArcZ were tested on the wild type PBAD-eptB–lacZ fusion (KM376) and eptB (G97C)-lacZ fusion (KM399); strains are deleted for both MgrR and ArcZ. The error bars show standard deviation after three trials.
Discussion
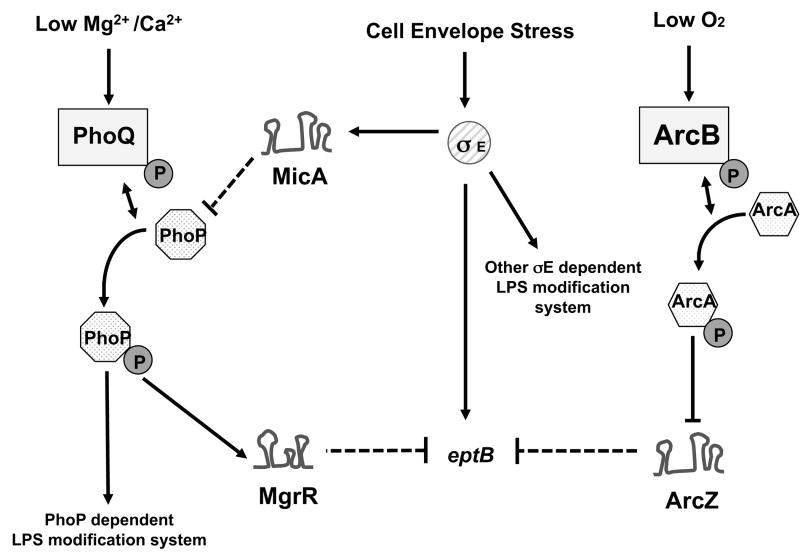
LPS is an important component of the bacterial cell surface and is a major factor in activating host immune systems during infection with Gram-negative bacteria. In the on-going battle between host and bacteria, the host deploys antimicrobial peptides; the bacteria, in turn, deploy enzymes that can modify the LPS, changing sensitivity to these peptides. Regulation of these enzymes at the right time and place is proving to be complex; the multiple inputs for regulation of eptB are summarized in Fig. 9. The PhoQ/PhoP two-component system, activated when concentrations of Mg2+ are low, inside a mammalian host, has been identified as an important component of this battle, leading to synthesis of gene products that carry out these protective LPS modifications. However, the regulatory circuits described here suggest further complexity. The PhoQ/PhoP-regulated mgrR gene encodes an sRNA that acts to down-regulate eptB, a gene encoding an LPS modifying enzyme that contributes to resistance to both antimicrobial peptides and elevated levels of Ca2+ (Fig. 4) (Moon & Gottesman, 2009). Thus, at the same time that activation of PhoQ/PhoP leads to increased LPS modifications, other LPS modifications are inhibited. Recent work on PmrR, a peptide that inhibits LpxT and is expressed under control of PmrA and PmrB in Salmonella, provides another instance where one set of LPS modifications is inhibited while another is induced, optimizing the ability of the bacteria to adjust to different environmental signals (Kato et al., 2012). The examination of eptB regulation carried out here uncovers multiple levels of regulation, presumably reflecting a need for the EptB-dependent modification under particular conditions, and a disadvantage to expressing it under other conditions. Our results suggest that the EptB-dependent modification is likely to be beneficial under conditions that induce periplasmic stress and activate the Sigma E system.
Figure 9. Model of multiple levels of regulation ofeptB.
Arrows and T-lines indicate positive and negative regulation, respectively. Solid lines indicate transcriptional regulation; dashed lines show post-transcriptional regulation by small RNAs. P in circle indicates phosphorylation. Rectangles and hexagons represent sensor kinase and response regulators of two component systems respectively; the sensor kinases can also dephosphorylate their cognate response regulators. MicA negatively regulates translation of phoP and phoQ (Coornaert et al., 2010).
Sigma E induction of eptB has been observed in both E. coli and Salmonella (Figueroa-Bossi et al., 2006, Rhodius et al., 2006). Our results confirm these findings, and demonstrate additivity of Sigma E induction with the effects of MgrR (Fig. 5). Despite promoter sequences that do not fully resemble a Sigma E consensus, our experiments confirm direct regulation by Sigma E at this site (Fig. 6 and Fig. 7). Under rapid growth conditions in the laboratory, the expression of eptB, presumably primarily due to Sigma 70, is fully repressed by MgrR (Fig. 5) and almost no EptB-dependent modification of LPS is detected (Fig. 2). The effect of a mutation at a conserved -65 motif on expression in the absence of extra Sigma E (Fig. 6C) suggests that the proposed Sigma 70 promoter for eptB may require an unidentified upstream regulator, absent in the in vitro system (Fig. 7). When the Sigma E system is induced, expression of eptB is significant even in the presence of MgrR (Fig. 5) and we would predict that EptB-dependent modification of LPS would take place under these conditions. Another level of regulation may reinforce these effects. The Sigma E-dependent sRNA MicA has been shown to down-regulate PhoPQ expression (Coornaert et al., 2010). Thus, there may also be some decrease in MgrR expression when the Sigma E regulon is activated, but with a delay for MicA synthesis and then dilution of pre-existing PhoP and PhoQ proteins. PhoP-dependent changes in Salmonella provide an effective permeability barrier at low divalent cation concentrations or for cationic peptides. However, at high concentrations of Mg2+ or Ca2+, “unmodified” LPS (achieved with a phoP mutant, leading to loss of other modifications but expression of EptB-dependent modifications) is a more effective barrier (Murata et al., 2007). In a phoP+ strain, high cations will repress MgrR expression, and allow eptB expression; we suggest that this condition may also induce Sigma E expression by perturbing the outer membrane and periplasm. We were unable to detect an effect of high Ca2+ on Sigma E induction (data not shown). Recent observations by S. Raina and coworkers further support a major role of Sigma E in regulating LPS structure, including the expected appearance of the EptB-dependent modification (Klein et al., 2011). In addition to the effect of Sigma E in inducing the EptB-dependent modification, they found LPS modifications affected by the Sigma E-regulated RybB sRNA, and assigned this to RybB repression of WaaR (Klein et al., 2011).
Yet another level of regulation is provided by the sRNA ArcZ. ArcZ is negatively regulated by the ArcB/ArcA two-component system; ArcA-P is formed under anaerobic growth conditions. Thus, ArcZ is made under aerobic growth conditions and synthesized at lower levels anaerobically (Mandin & Gottesman, 2010). The combined repressive effects of MgrR and ArcZ would be expected to lead to low levels of EptB aerobically, whenever Mg2+ and Ca2+ levels are relatively low, but may allow induction under microaerobic or anaerobic conditions when Mg2+ or Ca2+ levels are high. Exactly when these conditions will be encountered is not clear, but monitoring expression of eptB in vivo may provide some insight into the intersection of these complex regulatory systems.
It has been known for some time that sRNAs play major roles in regulation of outer membrane proteins. Our results, combined with those of others, suggest that the complex modification of LPS is also modulated by sRNAs, providing additional layers of regulation necessary for changing environments inside and outside hosts.
Experimental Procedures
Bacterial strains and plasmids
Strains and plasmids used in this study are listed in Table S4. All E. coli strains in this work are derived from MG1655. The recipient strain for standard cloning procedures was DH5α. Strains carrying lacZ fusions were constructed using the PM1205 system (Mandin & Gottesman, 2009) which contains the PBAD-cat sacB segment upstream of lacZ at the chromosomal lacZ site by the red recombination system using PCR products. Details were described in Mandin et al. (Mandin & Gottesman, 2009); primers are listed in Table S4 and described in Table S5.
Strains carrying a deletion of waaCF (deep rough strains) are resistant to infection with phage P1 (Sandulache et al., 1984). Therefore, in order to transduce the waaCF deletion mutation into the δeptB and δeptBδmgrR mutant strain backgrounds, a P1 lysate was prepared on a strain in which the chromosomal ΔwaaCF::tet was complemented by a plasmid. A plasmid containing the coding region of waaCF (pWaaCF) under the lac promoter was introduced into WBB06 (ΔwaaCF::tet) (Reynolds et al., 2005) to create KM186 and induced with 100 μM IPTG for 1 hour. The induced culture was infected with P1 vir and incubated for 3 hours at 37 °C, treated with chloroform and then the supernatant collected by centrifugation. This P1 lysate was used to transduce the waaCF deletion into strains KM176 and KM177 to generate strains KM191 and KM192, respectively.
For reasons that are not clear, we were unable to introduce the ΔwaaCF::tet marker by P1 transduction into the ΔmgrR eptB+ strain. Therefore, a chromosomal deletion of waaCF (ΔwaaCF::cm) was reconstructed in the mgrR::kn strain (KM129) and its wild-type parent (NM22540), using the λ Red recombination system (Yu et al., 2000). A PCR fragment was obtained by amplifying the chloramphenicol (cm) cassette of the strain TKC (D. Court, NCI, NIH) with primers that also carried homology to the sequences flanking waaCF, using the Expand High Fidelity PCR system. The resulting PCR products were recombined into the chromosome of derivatives of strains KM129 or NM22540, each carrying a mini-λ prophage in which the λ Red functions are repressed by a temperature-sensitive λ repressor (KM137 and KM161). Transformants were selected at high temperature for chloramphicol resistance (recombination of the ΔwaaCF::cm marker into the chromosome) and screening for loss of the tetracycline resistance marker (evidence for loss of the mini-lambda, which is excised at temperatures of 37° and above) (Court et al., 2003), in order to generate KM199 and KM225, respectively.
The plasmids for the in vitro transcription assay were prepared as follows: the promoter regions of either eptB or rybB were amplified by the Expand High Fidelity PCR system using dedicated primer sets (eptB-150ecoRF/eptB+94pstI or rybB-100ecoRF/rybB+70pstIR). The PCR fragments were digested with EcoRI and PstI and cloned into pSA508, which was pre-digested with EcoRI and PstI to generate pSA508-eptB and pSA508-rybB. pSA508-eptB contains from -150 bp upstream of +1 to +94 and pSA508-rybB contains from -100 to +70 of rybB. Each plasmid was transformed into DH5α and was verified by sequencing.
Media and Growth conditions
All strains were grown in LB. Antibiotic concentrations (in micrograms per milliliter) were as follows: ampicillin on plates, 50; ampicillin in liquid cultures, 100; kanamycin, 25; chloramphenicol, 25; tetracycline 25. Each plasmid was freshly transformed into the strain of interest by the TSS method (Chung et al., 1989), and then a colony was cultured in LB with the appropriate antibiotic and a final concentration of 100 μM of IPTG and incubated for 5 hours at 37 °C.
Total lipid and LPS extraction and analysis
For isolation of the total lipids, including deep-rough LPS, cells from the four strains (KM225, KM199, KM191, and KM192) were inoculated at OD600 = 0.03 in 200 mL of LB + 25 μg/mL chloramphenicol at 37 °C and shaken at 220 rpm. The cells were harvested when the OD600 = 1.7. The cells were pelleted, washed with phosphate-buffered saline (PBS), pelleted again, and stored at −80 °C as pellets until needed. To extract the LPS, the cells were resuspended in 20 mL of PBS, transferred to solvent-safe nalgene bottles, where 50 mL of methanol and 25 mL of chloroform were added to form a single-phase Bligh-Dyer mixture (Bligh & Dyer, 1959). The mixture was shaken well and stirred at room temperature to extract all lipids. After 1 h, another 25 mL each of chloroform and PBS were added to form a two-phase Bligh-Dyer mixture. After shaking well, the bottles were centrifuged for 20 min at 2500 × g at room temperature to cleanly separate the phases. The lower (chloroform) phase containing the lipids and deep-rough LPS was isolated and dried down on a rotary evaporator. The dried lipids were dissolved in chloroform:methanol (4:1), transferred to screw-cap tubes, dried down under nitrogen gas, and stored at −80 °C until needed for MS. The lipids and deep-rough LPS were prepared with 1% piperidine and subjected to direct infusion negative ion ESI-MS as previously described (Kong et al., 2011). An ABI QSTAR XL quadropole time-of-flight tandem mass spectrometer (ABI/MDS-Sciex, Toronto, ON, Canada), equipped with an electrospray ionization (ESI) source, was utilized to collect 60 scans in the negative ion mode from m/z 200–2000. The spectra contain peaks corresponding to all ionized polar lipids, including glycerophospholipids and undecaprenyl lipids; however, the LPS peaks corresponding to the [M-4H]4- and [M-2H]2- species are well separated from non-LPS peaks. Data acquisition and analysis were performed using Analyst QS software (ABI/MDS-Sciex).
Broth microdilution assay for susceptibility
Overnight cultures were diluted into LB and grown to OD600 = 0.6 at 37 °C. Wells of 96-well plates were filled with 100 μL of LB media. An additional 100 μL of LB media was added to the first well in each row. Aliquots of 2 μL of compounds of interest (50 mg/mL stock solutions) were added into the first wells, which contain 200 μL of LB media, and sequential 2-fold dilutions were performed along the rows using a multichannel pipette. The excess 100 μL from the last well of each column was discarded. Cells were diluted 1:100 into LB media to a final density of 106 cells/mL. A 100-μL aliquot of diluted cells was added into each well and incubated at 37 °C for 22 hours. After incubation, 50 μL of 1 mg/mL [4,5-dimethylthiazol-2-yl]-2,5-diphenyltetrazolium bromide solution (MTT, metabolic substrate, in sterile water, M2128, Sigma) was added in each well and incubated for 3 more hours at 37 °C. Viable cells can reduce MTT (yellow color) to MTT formazan (insoluble dark blue color). The Minimal inhibitory concentration (MIC) was determined as the lowest concentration of the compound that prevented visual cell growth. All experiments were done at least in duplicate with two independent experiments.
Note that the experiments of Reynolds et al. to test Ca2+ sensitivity were done as growth curves with cells already at OD 0.2 when Ca2+ was added (Reynolds et al., 2005). Under those conditions, the ΔwaaCF strains were able to grow, at a slower rate, while the eptB mutant cells ceased growth; in Fig. 4, cells were inoculated at 106 cells/ml, and although EptB activity may begin to be induced, it may not have been induced rapidly enough to allow visible growth in the wells.
RNA isolation and Northern Blot analysis
To examine the effect of Sigma E on the expression of eptB mRNA in both WT and mgrR deletion strains, IPTG inducible plasmids with or without Sigma E (pTrc99A or pTrc99A-sigmaE) were introduced into each strain and cultured in LB containing ampicillin at 37 °C. Cells were induced with IPTG for 1 hour at OD600 of 0.3 and were collected for RNA preparation.
For the effect of Ca2+, on RNA levels, cells were grown in LB at 37 °C with and without 50 mM CaCl2 and collected at different OD600s as indicated. Cells were washed with PBS buffer before RNA preparation.
Total RNA was extracted by the hot-phenol method as previously described (Massé et al., 2003) using 800 μl of culture mixed with 100 μl of lysis solution and 700 μl phenol/water. After precipitation with ethanol, RNA was resuspended in DEPC-water and its concentration was determined by measuring the OD at 260 nm. Analysis of each mRNA by Northern blot was performed with 15 μg total RNA separated on 1% agarose with a MOPS buffer. RNA was transferred from the gel to the Nylon membrane by capillary transfer overnight. Detection was performed with the corresponding biotinylated probes in Table S5 (“Biotinylated probes used for Northern blots”) and the quantification of the signal was performed with Multi Gauge software (Fuji).
5′ RACE
5′ RACE was performed by using the method described by Argaman et al. (Argaman et al., 2001). One microgram of RNA was ligated to the 5′ universal RNA adapter (5′-GAU AUG CGC GAA UUC CUG UAG AAC GAA CAC UAG AAG AAA-3′) and was reverse transcribed with Superscript III reverse transcriptase (Invitrogen) according to the manufacturer's instructions. The cDNA was then amplified by PCR using the RACE universal primer (RACE Universal F) and the eptB specific primer eptB-250R. The PCR products with or without TAP (tobacco acid pyrophosphatase) treatment were checked on a 1.8% agarose gel. The PCR product was sequenced with the mgrR specific primer, eptB-180lacZR. The PCR products were then TOPO cloned into the pCR2.1 (Invitrogen), and the resulting plasmids were transformed into Top10 cells. Plasmids containing the amplified cDNA from the tobacco acid pyrophosphatase-treated RNA were sequenced using the M13For (−20) primer supplied with the TOPO cloning kit (Invitrogen).
Beta-galactosidase assay
Fresh colonies of all strains were grown at 37 °C in an LB liquid medium containing appropriate antibiotics as needed. β-galactosidase assays were performed as described by Miller (Miller, 1992) using samples removed from the cultures during log phase (optical density at 600 nm [OD600], 0.4 to 0.5) and stationary phase (OD600, 3 to 4). All β-galactosidase assays were performed in at least triplicate.
In vitro transcription assay
Cells containing each plasmid, either pSA508-eptB or pSA508-rybB, were grown at 37 °C in LB containing ampicillin. Cells were collected and the plasmids were purified using the QAIGEN mini prep kit. The concentration of DNA was determined with a Nanodrop (Thermo Scientific). In vitro transcription assays were performed at 37 °C for 10 min in a total volume of 20 μl in the transcription buffer (50 mM Tris-HCl (pH 8.0), 10 mM MgCl2, 10 μg bovine serum albumin (BSA), 50 mM KCl, 100 μM ATP, 100 μM GTP, 100 μM CTP, 10 μM UTP and 2 μCi/reaction [α-32P]UTP) containing 1 nM plasmid templates and 30 nM RNA Polymerase core enzyme with either 180 nM Sigma factor E or 30 nM RNA Polymerase holo enzyme. The reactions were terminated by adding an equal volume of loading buffer (95% formamide, 20 mM EDTA, 0.05% bromphenol blue, and 0.05% xylene cyanol, pH 8.0). 20-μl aliquots of the reactions were electrophoresed in 6 % polyacrylamide/bisacrylamide (19:1) sequencing gel containing 7 M Urea. After the electrophoresis, the gel was dried on the 3MM paper and was exposed overnight. The transcript signals were analyzed by a LAS 4000 ImageReader from Fujifilm phosphor image analyzer. The RNAI transcripts present in the plasmids (106 and 108 nucleotides) were used as a positive control for Sigma 70-dependent promoters. This protocol is adapted from (Choy & Adhya, 1993, Potrykus et al., 2010).
Supplementary Material
Acknowledgments
We thank V. Rhodius for his thoughts on the eptB promoter, Dale Lewis for help with the in vitro transcription experiments, and K. Potrykus and M. Cashel for providing Sigma E protein. We thank M. S. Trent, D. Schu, S. Tong, N. De Lay and K. Ramamurthi for advice and comments on this paper. This work was supported in part by the Intramural Research Program of the NIH, National Cancer Institute, Center for Cancer Research and by NIH Grant GM-51310 to CRHR. The mass spectrometry facility in the Department of Biochemistry of the Duke University Medical Center is supported by the LIPID MAPS Large Scale Collaborative Grant number GM-069338 from NIH. The authors have no conflict of interest to declare. DAS and SG dedicate this paper to the memory of coauthor Christian R. H. Raetz, whose deep knowledge and interest played a key role in bringing this work to fruition.
References
- Argaman L, Hershberg R, Vogel J, Bejerano G, Wagner EGH, Margalit H, Altuvia S. Novel small RNA-encoding genes in the intergenic region of Escherichia coli. Curr Biol. 2001;11:941–950. doi: 10.1016/s0960-9822(01)00270-6. [DOI] [PubMed] [Google Scholar]
- Bligh EG, Dyer WJ. A rapid method of total lipid extraction and purification. Can J Biochem Physiol. 1959;37:911–917. doi: 10.1139/o59-099. [DOI] [PubMed] [Google Scholar]
- Choy HE, Adhya S. RNA polymerase idling and clearance in gal promoters: use of supercoiled minicircle DNA template made in vivo. Proc Natl Acad Sci U S A. 1993;90:472–476. doi: 10.1073/pnas.90.2.472. [DOI] [PMC free article] [PubMed] [Google Scholar]
- Chung CT, Niemela SL, Miller RH. One-step preparation of competent Escherichia coli: Transformation and storage of bacterial cells in the same solution. Proc Natl Acad Sci USA. 1989;86:2172–2175. doi: 10.1073/pnas.86.7.2172. [DOI] [PMC free article] [PubMed] [Google Scholar]
- Coornaert A, Lu A, Mandin P, Springer M, Gottesman S, Guillier M. MicA sRNA links the PhoP regulon to cell envelope stress. Mol Microbiol. 2010 doi: 10.1111/j.1365-2958.2010.07115.x. in press. [DOI] [PMC free article] [PubMed] [Google Scholar]
- Court DL, Swaminathan S, Yu D, Wilson H, Baker T, Bubunenko M, Sawitzke J, Sharan SK. Mini-lambda: a tractable system for chromosome and BAC engineering. Gene. 2003;315:63–69. doi: 10.1016/s0378-1119(03)00728-5. [DOI] [PubMed] [Google Scholar]
- Figueroa-Bossi N, Lemire S, Maloriol D, Balbontin R, Casadesus J, Bossi L. Loss of Hfq activates the σE-dependent envelope stress response in Salmonella enterica. Molec Microbiol. 2006;62:838–852. doi: 10.1111/j.1365-2958.2006.05413.x. [DOI] [PubMed] [Google Scholar]
- Groisman EA. The pleiotropic two-component regulatory system PhoP-PhoQ. J Bacteriol. 2001;183:1835–1842. doi: 10.1128/JB.183.6.1835-1842.2001. [DOI] [PMC free article] [PubMed] [Google Scholar]
- Herrera CM, Hankins JV, Trent MS. Activation of PmrA inhibits LpxT-dependent phosphorylation of lipid A promoting resistance to antimicrobial peptides. Mol Microbiol. 2010;76:1444–1460. doi: 10.1111/j.1365-2958.2010.07150.x. [DOI] [PMC free article] [PubMed] [Google Scholar]
- Ho TD, Ellermeier CD. Extra cytoplasmic function σ factor activation. Current Opin Microbiol. 2012;15:182–188. doi: 10.1016/j.mib.2012.01.001. [DOI] [PMC free article] [PubMed] [Google Scholar]
- Johansen J, Rasmussen AA, Overgaard M, Valentin-Hansen P. Conserved small non-coding RNAs that belong to the σE regulon: role in down-regulation of outer membrane proteins. J Mol Biol. 2006;364:1–8. doi: 10.1016/j.jmb.2006.09.004. [DOI] [PubMed] [Google Scholar]
- Kanipes MI, Lin S, Cotter RJ, Raetz C. Ca2+-induced phosphoethanolamine transfer to the outer 3-deoxy-D-manno-octulosonic acid moiety of Escherichia coli lipopolysaccharide. J Biol Chem. 2001;276:1156–1163. doi: 10.1074/jbc.M009019200. [DOI] [PubMed] [Google Scholar]
- Kato A, Chen HD, Latifi T, Groisman EA. Reciprocal control between a bacterium's regulatory system and the modification status of its lipopolysaccharide. Molec Cell. 2012;47:897–908. doi: 10.1016/j.molcel.2012.07.017. [DOI] [PMC free article] [PubMed] [Google Scholar]
- Kato A, Groisman EA. The PhoQ/PhoP regulatory network of Salmonella enterica. Adv Exp Med Biol. 2008;631:7–21. doi: 10.1007/978-0-387-78885-2_2. [DOI] [PubMed] [Google Scholar]
- Klein G, Lindner B, Brade H, Raina S. Molecular basis of lipopolysaccharide heterogeneity in Escherichia coli: Envelope stress responsive regulators control the incorporation of glycoforms with a third 3-deoxy-α-D-manno-oct-2-ulosonic acid and rhamnose. J Biol Chem. 2011;186:42787–42807. doi: 10.1074/jbc.M111.291799. [DOI] [PMC free article] [PubMed] [Google Scholar]
- Kong Q, Six DA, Roland KL, Liu Q, Gu L, Reynolds CM, Wang X, Raetz CR, Curtiss rR. Salmonella synthesizing 1-dephosphorylated lipopolysaccharide exhibits low endotoxic activity while retaining its immunogenicity. J Immunol. 2011;187:412–423. doi: 10.4049/jimmunol.1100339. [DOI] [PMC free article] [PubMed] [Google Scholar]
- Mandin P, Gottesman S. A genetic approach for finding small RNA regulators of genes of interest identifies RybC as regulating the DpiA/DpiB two-component system. Mol Microbiol. 2009;72:551–565. doi: 10.1111/j.1365-2958.2009.06665.x. [DOI] [PMC free article] [PubMed] [Google Scholar]
- Mandin P, Gottesman S. Integrating anaerobic/aerobic sensing and the general stress response through the ArcZ small RNA. EMBO J. 2010;29:3094–3107. doi: 10.1038/emboj.2010.179. [DOI] [PMC free article] [PubMed] [Google Scholar]
- Massé E, Escorcia FE, Gottesman S. Coupled degradation of a small regulatory RNA and its mRNA targets in Escherichia coli. Genes Dev. 2003;17:2374–2383. doi: 10.1101/gad.1127103. [DOI] [PMC free article] [PubMed] [Google Scholar]
- Miller JH. A Short Course in Bacterial Genetics. Cold Spring Harbor Laboratory Press; Cold Spring Harbor, NY: 1992. [Google Scholar]
- Moon K, Gottesman S. A PhoQ/P-regulated small RNA regulates sensitivity of Escherichia coli to antimicrobial peptides. Molec Microbiol. 2009;74:1314–1330. doi: 10.1111/j.1365-2958.2009.06944.x. [DOI] [PMC free article] [PubMed] [Google Scholar]
- Moon K, Gottesman S. Competition among Hfq-binding small RNAs in Escherichia coli. Molec Microbiol. 2011;82:1545–1562. doi: 10.1111/j.1365-2958.2011.07907.x. [DOI] [PMC free article] [PubMed] [Google Scholar]
- Murata T, Tseng W, Guina T, Miller SI, Nikaido H. PhoPQ-mediated regulation produces a more robust permeability barrier in the outer membrane of Salmonella enterica Serovar Typhimurium. J Bacteriol. 2007;189:7213–7222. doi: 10.1128/JB.00973-07. [DOI] [PMC free article] [PubMed] [Google Scholar]
- Papenfort K, Said N, Welsink T, Lucchini S, Hinton JC, Vogel J. Specific and pleiotropic patterns of mRNA regulation by ArcZ, a conserved, Hfq-dependent small RNA. Mol Microbiol. 2009;74:139–158. doi: 10.1111/j.1365-2958.2009.06857.x. [DOI] [PubMed] [Google Scholar]
- Potrykus K, Murphy H, Chen X, Epstein JA, Cashel M. Imprecise transcription termination within Escherichia coli greA leader gives rise to an array of short transcripts. Nucleic Acids Res. 2010;38:1636–1651. doi: 10.1093/nar/gkp1150. [DOI] [PMC free article] [PubMed] [Google Scholar]
- Raetz CRH, Reynolds CM, Trent MS, Bishop RE. Lipid A Modification systems of in Gram-negative bacteria. Annu Rev Biochem. 2007;76:295–329. doi: 10.1146/annurev.biochem.76.010307.145803. [DOI] [PMC free article] [PubMed] [Google Scholar]
- Reynolds CM, Kalb SR, Cotter RJ, Raetz CRH. A phosphoethanolamine transferase specific for the outer 3-Deoxy-D-manno-octulosonic acid residue of Escherichia coli lipopolysaccharide. J Biol Chem. 2005;280:21202–21211. doi: 10.1074/jbc.M500964200. [DOI] [PubMed] [Google Scholar]
- Rhodius VA, Suh WC, Nonaka G, West J, Gross CA. Conserved and variable functions of the σE stress response in related genomes. PLoS Biol. 2006;4:e2. doi: 10.1371/journal.pbio.0040002. [DOI] [PMC free article] [PubMed] [Google Scholar]
- Rouviere P, De Las Penas A, Mescas J, Zen Lu C, Rudd KE, Gross CA. rpoE, the gene encoding the second heat-shock sigma factor, σE, in Escherichia coli. EMBO J. 1995;14:1032–1042. doi: 10.1002/j.1460-2075.1995.tb07084.x. [DOI] [PMC free article] [PubMed] [Google Scholar]
- Sandulache R, Prehm P, Kamp D. Cell wall receptors for bacteriophage Mu G(+) J Bacteriol. 1984;160:299–303. doi: 10.1128/jb.160.1.299-303.1984. [DOI] [PMC free article] [PubMed] [Google Scholar]
- Thompson KM, V, Rhodius A, Gottesman S. σE regulates and is regulated by a small RNA in Escherichia coli. J Bacteriol. 2007;189:4243–4256. doi: 10.1128/JB.00020-07. [DOI] [PMC free article] [PubMed] [Google Scholar]
- Touze T, Tran AX, Hankins JV, Mengin-Lecreuix D, Trent MS. Periplasmic phosphorylation of lipid A is linked to the synthesis of undecaprenyl phosphate. Mol Microbiol. 2008;67:264–277. doi: 10.1111/j.1365-2958.2007.06044.x. [DOI] [PMC free article] [PubMed] [Google Scholar]
- Trent MS. Biosynthesis, transport, and modification of lipid A. Biochem Cell Biol. 2004;82:71–86. doi: 10.1139/o03-070. [DOI] [PubMed] [Google Scholar]
- Udekwu KI, Wagner EG. Sigma E controls biogenesis of the antisense RNA MicA. Nucleic Acids Res. 2007;35:1279–1288. doi: 10.1093/nar/gkl1154. [DOI] [PMC free article] [PubMed] [Google Scholar]
- Vescovi E, Ayala Y, Di Cera E, Groisman E. Characterization of the bacterial sensor protein PhoQ. Evidence for distinct binding sites for Mg2+ and Ca2+ J Biol Chem. 1997;272:1440–1443. doi: 10.1074/jbc.272.3.1440. [DOI] [PubMed] [Google Scholar]
- Wade JT, Roa DC, Grainger DC, Hurd D, Busby SJW, Struhl K, Nudler E. Extensive functional overlap between σ factors in Escherichia coli. Nat Struct Mol Biol. 2006;13:806–814. doi: 10.1038/nsmb1130. [DOI] [PubMed] [Google Scholar]
- Yu D, Ellis HM, Lee EC, Jenkins NA, Copeland NG, Court DL. An efficient recombination system for chromosome engineering in Escherichia coli. Proc Natl Acad Sci USA. 2000;97:5978–5983. doi: 10.1073/pnas.100127597. [DOI] [PMC free article] [PubMed] [Google Scholar]
Associated Data
This section collects any data citations, data availability statements, or supplementary materials included in this article.


