Abstract
We report a 3D microfluidic device with 32 detection channels and 64 sheath flow channels and embedded microball lens array for high throughput multicolor fluorescence detection. A throughput of 358 400 cells/s has been accomplished. This device is realized by utilizing solid immersion micro ball lens arrays for high sensitivity and parallel fluorescence detection. High refractive index micro ball lenses (n = 2.1) are embedded underneath PDMS channels close to cell detection zones in channels. This design permits patterning high N.A. micro ball lenses in a compact fashion for parallel fluorescence detection on a small footprint device. This device also utilizes 3D microfluidic fabrication to address fluid routing issues in two-dimensional parallel sheath focusing and allows simultaneous pumping of 32 sample channels and 64 sheath flow channels with only two inlets.
INTRODUCTION
Flow cytometry is the standard single cell analysis tool for broad applications in biomedical research and clinical diagnostics.1 It has been shown to be able to identify stem cells and tumor cells from dissociated tissue biopsies,2 cell content in blood and other body fluids.3, 4 In conventional flow cytometer, fluorescently labelled cell samples are focused by sheath flows into a single stream and interrogated by one or few laser beams in the detection zone. Information such as cell size, granule structure, and specific protein content can be obtained. The analysis speed of commercial flow cytometers are in general 20 000 ∼ 70 000 cells/s. Such throughput is sufficient for analysing most biological samples. However, for rare cell analysis, such as hematopoietic stem cells, endothelial progenitor cells or circulating tumor cells, the throughput of conventional flow cytometers may not be sufficient.
Microfluidics has the potential to overcome the throughput limitation by taking the advantage of parallel analysis. Many microfluidic flow cytometers have been demonstrated in the past decade, including both label (fluorescence, magnetic) and label-free types (dielectrophoresis, acoustics, inertia, and imaging).5, 6, 7, 8, 9, 10, 11, 12, 13, 14, 15, 16, 17, 18, 19, 20, 21, 22, 23, 24, 25, 26 Label-free flow cytometers can provide high throughput since parallelization is easier compared to fluorescence based approaches. However, label-free approaches are in general lack of specificity for cells that do not have significant difference in size, shape, elasticity, and dielectric properties. On the other hand, fluorescence based analysis can provide multi-parameter analysis function and molecular specificity. Parallel fluorescence detection in multiple channels, however, is not straightforward. The challenges come from multiple aspects, including cell-focusing, fluid routing, and optical excitation and detection across channels.
To provide cell-focusing functions in microchannels, many approaches have been proposed. Simonnet and Groisman demonstrated a flow cytometer with 3D hydrodynamic flow focusing using 3 fluid inlets in a single microfluidic channel for bacteria detection at a throughput of 17 000 cells/s.22 Similarly, Lin et al. used one single perpendicularly-introduced sheath flow to encircle the sample flow for focusing beads and cells for counting.17 Huang et al. utilized a simple curved channel to generate secondary flows to achieve 3D hydrodynamic focusing in a monolayer PDMS channel.18, 19 Di Carlo et al. showed that by utilizing a high aspect ratio channel and inertia forces, sheathless 3D focusing with adjustable particle-particle spacing can be achieved.14, 27, 28 The particle size and elasticity sensitive inertia effects also provided cell separation functions.29, 30 A flow cytometer integrated with chevron-shaped grooves for hydrodynamic focusing was also explored by Ligler et al.11, 12, 23 Fluid routing and interfacing with external instruments in parallel channels could be another challenging issue, especially for sheath flow based focusing. Providing sheath flows to parallel microfluidic channels without facing fluid channel interconnect issue may need multilayer three-dimensional microfluidic devices with interlayer connection vias.
Several groups have achieved parallel optical detection across channels. Mckenna et al. demonstrated a multicolor microfluidic flow cytometer with 384 channels in parallel using a confocal spinning lens for high-content screening at a throughput 1070 cells/s.20, 21 However, lack of flow focusing of cell samples results in high false rates. To achieve high sensitivity detection in parallel microfluidic channels, microlens arrays have been proposed to overcome the trade-off between detection sensitivity and field-of-view.31, 32, 33, 34, 35, 36 Most microlens arrays, however, have small N.A., typically between 0.1 and 0.3 due to the limitations in fabrication techniques and materials.37, 38, 39, 40, 41, 42, 43, 44, 45, 46, 47, 48 High N.A. microlens array can be achieved using Fresnel zone plates. N.A. values as high as 1.31 has been accomplished.49 Since Fresnel zone plates are fabricated on a planar surface, it also provides a simple interface for integration with microfluidic components, unlike other refractive optics based lenses that typically have curved surfaces.50, 51 Schonbrun et al. have demonstrated a high N.A. Fresnel zone plate integrated in a microfluidic channel with 2D hydrodynamic focusing for high sensitivity fluorescence detection and particle counting in a channel.52 Using a two-dimensional Fresnel lens array, Schonbrun et al. have also achieved high throughput and parallel droplet detection across 64 channels at a throughput of 200 000 droplets/s. However, high throughput and parallel fluorescence detection have not been achieved in this device due to the lack of cell focusing function. Large chromatic aberration of Fresnel lens due to its diffraction optics nature also makes multicolour fluorescence detection complicated.
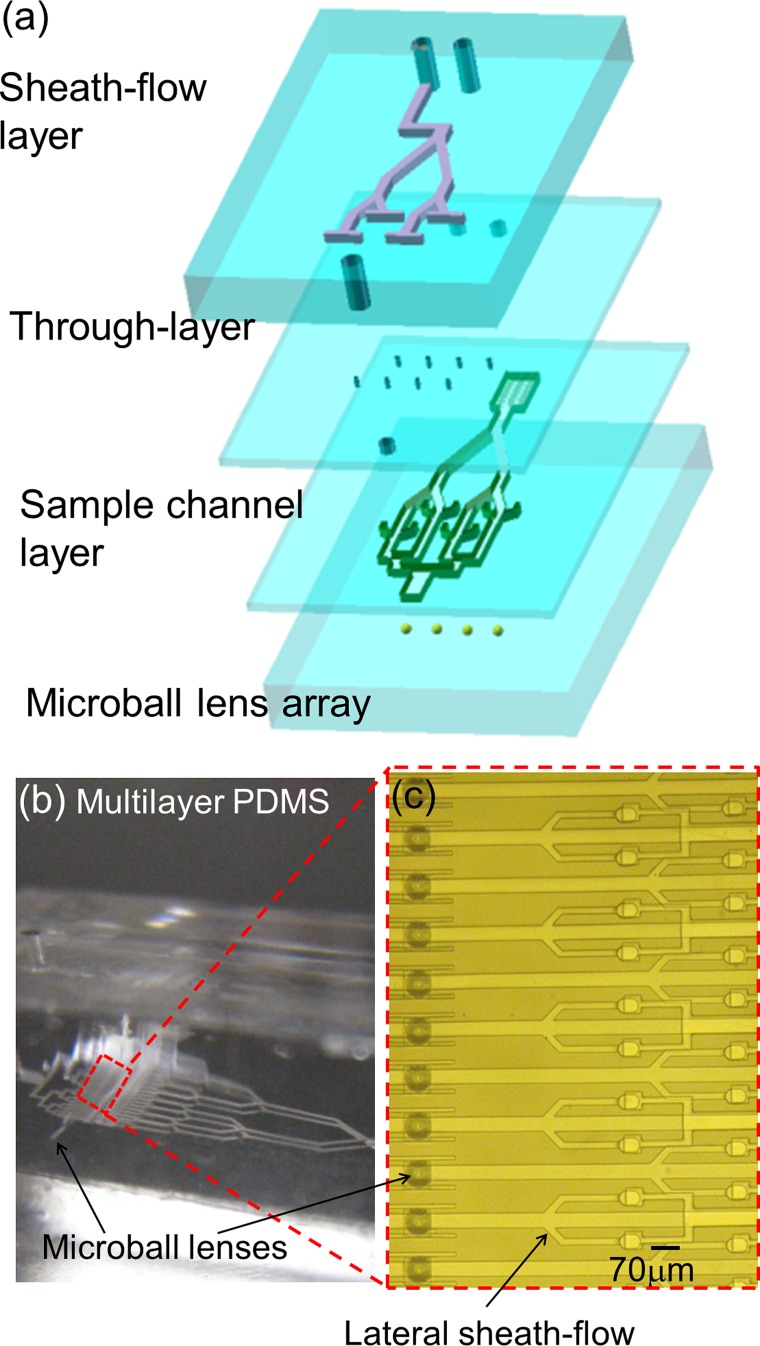
Here, we demonstrate an integrated, high throughput, multicolor, microfluidic fluorescence based cell counter with 32 parallel sample channels and 64 sheath flow channels. A three-dimensional multilayer PDMS based microfluidic device with interconnection vias between layers has been fabricated to solve the fluid routing issue for parallel sheath flow focusing. This device requires only 2 inlets to supply fluid to 32 sample channels and 64 sheath flow channels (Figure 1). To provide high sensitivity fluorescence detection to each detection channel, high N.A. solid immersion micro ball lenses were embedded right underearth the surface of each detection channel. This refractive optics based lens array provides smaller chromatic aberration than Fresnel lenses and is ideal for multicolor detection. The embedded configuration also provides a flat surface for bonding with subsequent layers of microfluidic structures and does not perturb the fluid flow in the channel.
Figure 1.
(a) Schemetic of 3D parallel microfluidic device with an embedded microball lens array. (b) and (c) Pictures of the device consisting of 32 parallel sample channels, 64 sheath flow channels, and 32 micro ball lenses deployed in a linear array.
DEVICE FABRICATION AND OPTICAL SETUP
Fabrication of embedded micro ball lens array
The device fabrication process is shown in Figure 2. A standard photolithography process was used to fabricate a SU-8 post array on a silicon wafer. Each square post is 70 μm in width and 70 μm in depth. This SU-8 mold was used to cast PDMS microwells following standard soft lithography protocols.53 Commercially available, titanium and barium doped glass microspheres with high refractive index of 2.1 and diameter of 75 ± 2 μm (XL Sci-tech Inc., USA) were used. Dry glass microspheres were spread on the surface of the well array and swept into the wells. These glass microspheres self-assembled into the PDMS microwells. The size of microwell and ball lens guarantee there is only one ball in each well. Using high density of dry microspheres and repeated filling processes, 100% filling of the wells by micro ball lenses can be achieved. Deionized water rinsing and nitrogen air blowing were used to remove microspheres not assembled into wells. The assembled array was then baked at 100 °C for 5 min to dry the water trapped in wells. Uncured PDMS was poured on the array and sandwiched between two flat solid poly(methyl methacrylate) (PMMA) substrates and baked until all PDMS is fully cured. A microball lens array embedded underneath a flat PDMS surface is obtained after the PMMA substrates are removed. A 100 × 100 microball lens array with lens pitch of 90 μm has been successfully fabricated using this approach as shown in Figure 2c. Figure 2d presents the SEM image showing the cross-section of microball lens array embedded in a PDMS substrate.
Figure 2.
(a) Process flow for fabricating microball lens arrays embedded in PDMS. (b) An optical image showing part of a 100 × 100 microball lens array. (c) A SEM image showing the cross-section of microball lenses embedded right underneath the PDMS surface.
Fabrication of multilayer 3D microfluidic channels with interlayer vias
The fabrication of 3D PDMS microfluidic channels followed the method developed by Zhang et al.54 and Kung et al.55 A piece of bulk PDMS (about 5 mm thick) treated with trichloro(1Hm,1H,2H,2H-perfluorooctyl)silane was used as a stamp to peel off a PDMS thin film patterned by a SU-8 mold. The deformable PDMS stamp and the SU-8 mold can pattern a PDMS thin film with through layer vias. The thickness of each film is 30 μm, corresponding to the thickness of the SU8 mold. This PDMS thin film was then aligned under a stereomicroscope and bonded with the microball lens array embedded in a PDMS substrate through oxygen plasma treatment. The PDMS stamp was then peeled off from this PDMS assembly. By repeating the steps mentioned above, multiple PDMS thin film with through layer vias could be stacked to form a 3D microfluidic network (Figure 3a) to solve the channel interconnect issue for parallel sheath flow focusing. Using this approach, we successfully fabricated a 3D microfluidic device with 32 sample channels, 64 sheath flow channels, 64 through layer vias, and 32 microball lenses embedded under each sample channel in the detection zone as shown in Figures 3b, 3c. Only two inlets were used in our device: one for supplying cell and particle aqueous solutions to the 32 sample channels, and the other one for providing sheath flows in the 64 channels to achieve parallel cell focusing in the 32 sample channels.
Figure 3.
(a) Schematic of multiple PDMS thin film layers stacked in our 3D microfluidic device. (b) and (c) Pictures of a device consisting of 32 parallel sample channels, 64 sheath-flow channels, and 32 microball lenses.
Optical characterization of PDMS embedded microball lens array
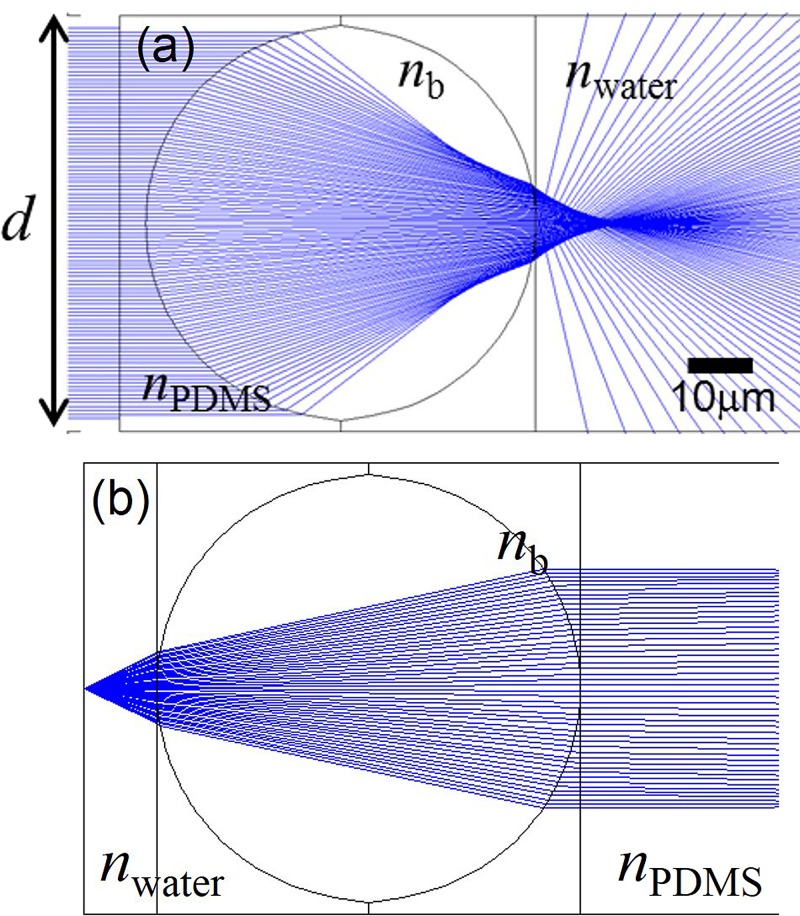
Ball lenses, in general, have spherical aberration and short back focal length (BFL) that need to be considered in designing the detection optical system and microfluidic integration. Spherical aberration makes it non-ideal for imaging applications since images will be strongly distorted. For applications in light collection or coupling, there is more tolerance. Ball lenses are commonly used in coupling collimated light into optical fibers. The spherical aberration property may offer unique advantages in exciting fluorescence of cells that are only hydrodynamically focused in lateral direction but not in the vertical direction as in our device. Light rays propagating through the edge of ball lens get refracted more and focused before the focal point. This result in a more elongated high intensity region along the vertical axis compared to a tight spot by a spherical-aberration-free lens. This aids in the detection of cells that flow through the detection region at different heights. BFL is defined as the distance from the focal point to the vertex of the ball lens. For a ball lens (refractive index 2.1) with 75 μm in diameter and immersed in PDMS (refractive index 1.4), its BFL is only 18.75 μm. Figure 4 is the ray tracing simulation (Zemax) showing parallel light rays propagating through the microball lens embedded in PDMS and focused in water. For light rays illuminate near the middle of the ball (within d = 42 μm), small spherical aberration is observed. It provides a collection angle of 52° in water. This light collection efficiency is equivalent to an objective lens with a N.A. of 0.58.
Figure 4.
Ray tracing simulation of (a) parallel light rays and (b) light rays from a point source propagating through a microball lens embedded in PDMS and focused in water. Light rays propagating through the edge of the ball lens undergoes spherical aberration and results in a photonic jet effect. Light rays illuminate at the middle of the ball lens get tightly focused to the focal point. It provides a 52∘ collection angle with small spherical aberration.
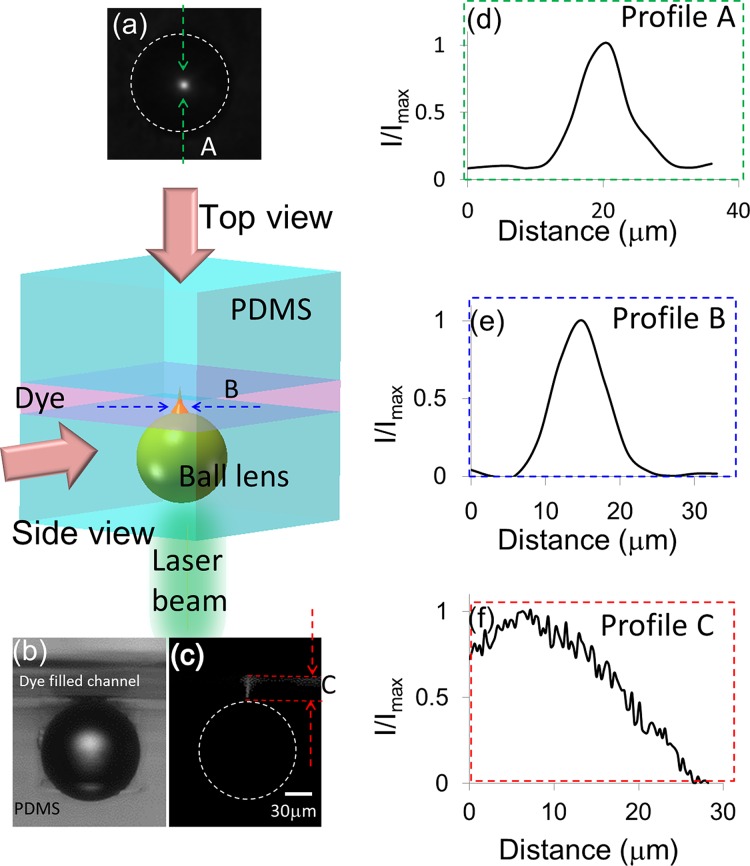
Figure 5 presents the experimental results of the fluorescence excitation region by a PDMS embedded micro ball lens. A 30 μm high microfluidic channel is bonded on top of the microball lens embedded PDMS substrate. This channel is filled with 2 mM resorufin fluorescence dye. A collimated laser beam with a wavelength at 532 nm was focused by the microball lens to excite the fluorescent dye in the channel. Figure 5 shows the fluorescent intensity profiles taken from topview (Figures 5d, 5e) and sideview (Figure 5f) of the channel, respectively. From Figures 5d, 5e, the fluorescence spot size in the focal point is measured to be 5 μm (full width half maximum). Figure 5f shows the intensity profile measured along the light axis after the ball lens. The peak intensity is located at 8 μm on top of the ball lens, which is shorter than the simulated 13 μm. This could be due to a thin layer of PDMS residue between the channel and the ball lens. The elongated excitation beam penetrates 27 μm deep into the channel. The variation of fluorescence excitation intensity is less than 50% within 20 μm after the ball lens.
Figure 5.
A light beam propagates through a PDMS embedded 75 μm ball lens and gets focused to excite fluorescence dye in a 30 μm high channel. The fluorescence images are taken by a 10× objective lens on a fluorescence microscope to calibrate the excitation range after the lens. (a) Topview of the fluorescence image captured at the focal point. (b) The bright field and the (c) fluorescent sideview images of a ball lens. A column-shape of fluorescence excitation is observed after the ball lens. (d) The intensity profiles extracted from the topview fluorescence image in (a). (e) The intensity profile extracted from a sideview fluorescence image in (c). It shows the smallest spot size is 5 μm. The intensity distribution along the center propagation axis after the ball lens is plotted in (f). It shows the column-shape excitation beam can penetrate 27 μm deep into the channel.
Optical system for large area fluorescence detection
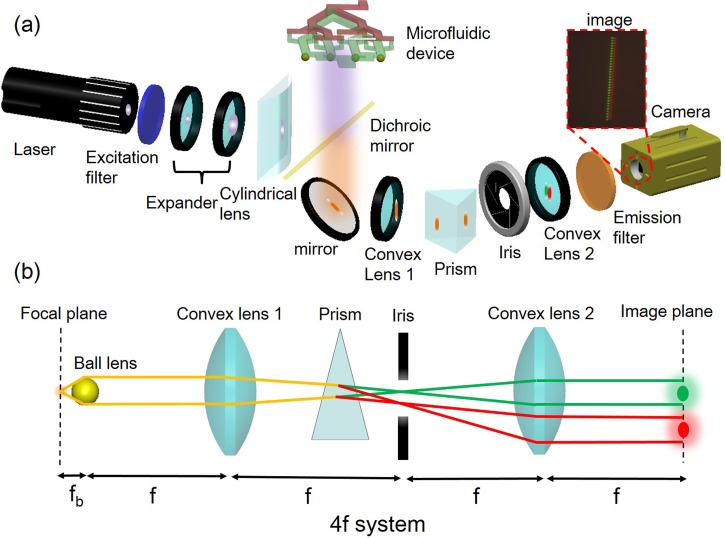
Figure 6a shows the optical system used for exciting and collecting the fluorescence signals from cells passing through the detection zones on the device. A collimated 445 nm high power laser diode (1 W) was used for fluorescence excitation. The beam was expanded, focused by a cylindrical lens and reflected by a dichroic mirror to form a line-shape pattern to illuminate the linear microball lens array on the chip. The light collected by each ball lens is further focused into its corresponding channel for fluorescence excitation of cells and particles passing through each channel. The emission fluorescence is collected by the same microball lens and imaged onto a high speed CMOS camera (Vision Research, phantom v7.2c) through a telescope optics consisting of a pair of low N.A. (0.18) convex lenses to provide a 1:1 mapping of the ball lens array image onto the CMOS detector. A custom made small-angel PDMS prism is inserted in the light pathway to split the images of different colors on the detection plane. When a cell passes through the detection zone at one of the channels, the emitted fluorescence is captured by the corresponding microball lens and imaged onto the detection plane through a 4f optical system as Figure 6b. If this cell emits one fluorescent color, only one spot, either red or green, is detected on the image plane in the corresponding channel. If this cell emits two fluorescent colors, two spots, both red and green, are detected in that corresponding channel. Since the entire microball lens array is imaged simultaneously onto the high speed image sensor array, this optical system can achieve continuous and multicolor detection of all 32 channels in parallel.
Figure 6.
(a) Schematic of the custom constructed optical system for parallel fluorescence detection in our device. A high power laser diode provides fluorescence excitation on cells through a micro ball lens array. Multicolor fluorescence emission from cells are collected by the same microlens array and imaged on to a high speed CMOS camera through telescope optics. Optical images of different colors are split on the detection image plane by a custom built prism to achieve continuous, simultaneous, multicolor detection of cells passing through all 32 channels. (b) Schematic of the ray tracing shows how multicolor fluorescence signals are collected by a microball lens, color split by a small angle prism, and imaged on to the image plane.
EXPERIMENTAL RESULTS
Multicolor detection test using fluorescence dyes
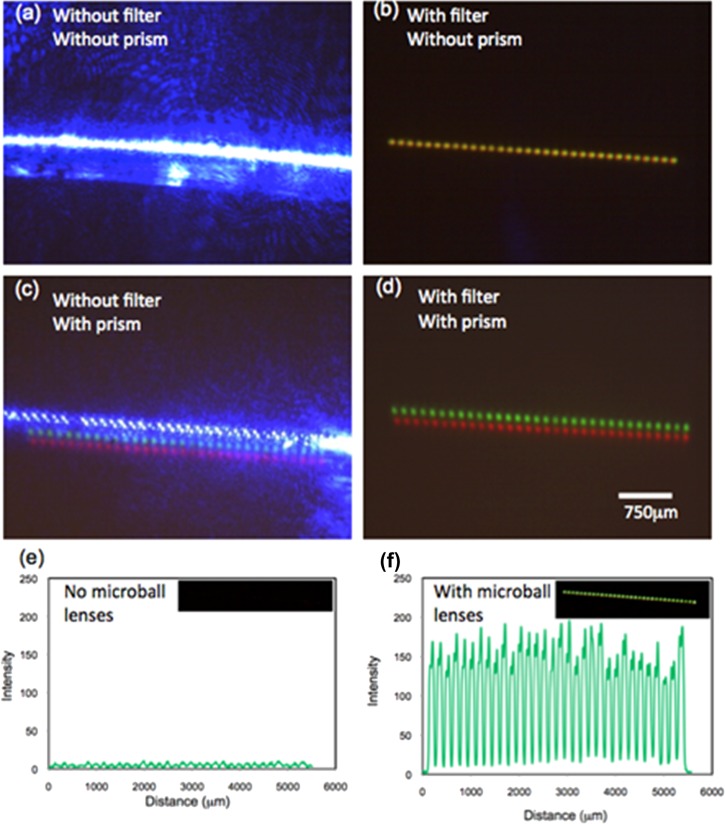
To test the multicolor detection function in our fluorescence detection system, a fluorescence dye, Lucifer yellow (Sigma Inc.) that has broad emission spectrum in the visible light range was pumped into our device. A dual-band (FITC/TRITC) emission filter (Chroma 59004) with transmission windows at 500–535 nm (green) and 570–620 nm (red) was used to filter out excitation light (wavelength 445 nm). Figure 7 shows the fluorescence images captured on the camera. Without adding an emission filter, both the excitation and emission light images are picked up by the camera (Figure 7a). When an emission filter is added, the blue excitation light is removed and only the green and red signals are picked up. However, due to the small chromatic aberration of microball lenses, the green and red images from the same ball lens overlap. This results in an array of yellow dots on the image plane (Figure 7b). By adding a custom made small angle (10°) PDMS prism on the optical pathway, images of different colors are split on the detection plane. Figure 7c shows the image of split blue, green, and red dots array with a prism but not an emission filter on the light pathway. Figure 7d shows the split green and red dots array from the 32 fluorescence dye filled channels with both an emission filter and a prism added. Each light spot covered ∼ 20 pixels on the CMOS camera and each square pixel has an area of 22 μm2.
Figure 7.
Example of parallel, multicolor fluorescence detection in 32 channels. (a) Image without an emission filter and a prism added in the optical pathway. The blue, green, and red signals from the ball lens array overlap on the image plane. (b) An emission filter is added to remove the blue excitation light from the laser. An array of yellow dots is observed since the green and red fluorescence signals from the same ball lens overlap. (c) A prism is added to split images of different colors on the detection plane. (d) An emission filter and a prism are added. Green and red fluorescence signals from 32 channels are simultaneously picked up. (e) Comparison of the signal to noise ratio improvement without and with a microball lens array. An 18 times improvement has been achieved with microball lenses.
Comparison of the improvement of signal to noise ratio (SNR) with and without a microball lens array is shown in Figure 7e. In average, the SNR is enhanced from 1.33 to 22.22, that an improvement of 18 times has been achieved.
Multicolor detection of fluorescence beads
Two types of fluorescence beads, 10 μm green and 8 μm red polystyrene particles (Thermo Scientific Inc.), were used to test the multicolor fluorescence detection function of our device. Two types of samples were prepared: (1) green beads with a concentration of 2 × 10⁷ beads/ml, and (2) green and red beads mixed at a 1:1 ratio with a total concentration of 2 × 10⁷ bead/ml. During the experiment, a sample solution is introduced into the device through the sample inlet. A mechanical filter structure was built in the upstream of the device to remove large particle aggregates. The filtered beads flowed through a 5-stage cascade of 1 × 2 channel splitter into 32 parallel channels. Deionized water was used to provide 2D sheath focusing in the sample stream through the 64 parallel sheath flow channels. The sample stream and the sheath fluid were driven by two independent syringe pumps at flow rates of 30 ml/h and 60 ml/h, respectively, and the particle speed is 504 mm/s. The frame rate of high speed camera was set at 50 000 fps.
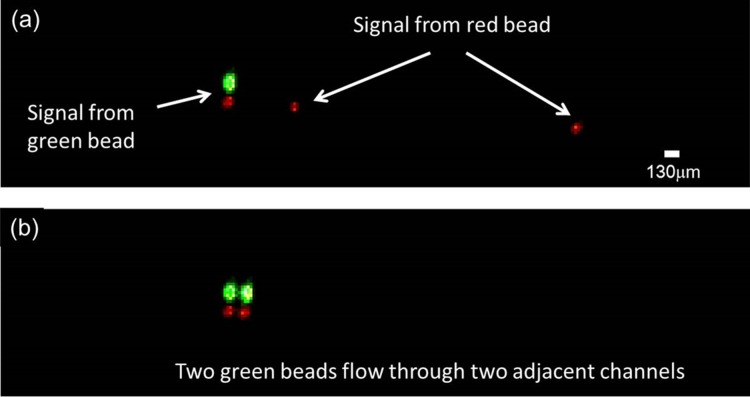
Figure 8 shows two representative fluorescence images of microbeads flowing through detection channels captured by the high-speed camera. Red signals were detected when red fluorescent beads passed through the detection zones as shown in Figure 8a. On the other hand, because of the long fluorescence emission tail of the green beads used in our experiment, a strong green and a weak red signal are detected simultaneously when a green particle passed through. Such spectrum overlap is common in multicolor fluorescence detection system. In our experiment, it did not affect our identification of the green and red beads used. However, for detecting a particle with two fluorescence dyes, this could be an issue and color compensation is required during analysis. Figure 8b presents the fluorescence image of two green beads flowing through two adjacent channels simultaneously.
Figure 8.
(a) A representative fluorescence image of red and green beads passing through the detection zone. Green beads with long fluorescence emission tail in spectrum showed both green and red signals in the corresponding channels, while red beads show only red signals. (b) A fluorescence image showing two green beads flowing through two adjacent channels with little fluorescence signal crosstalk between channels.
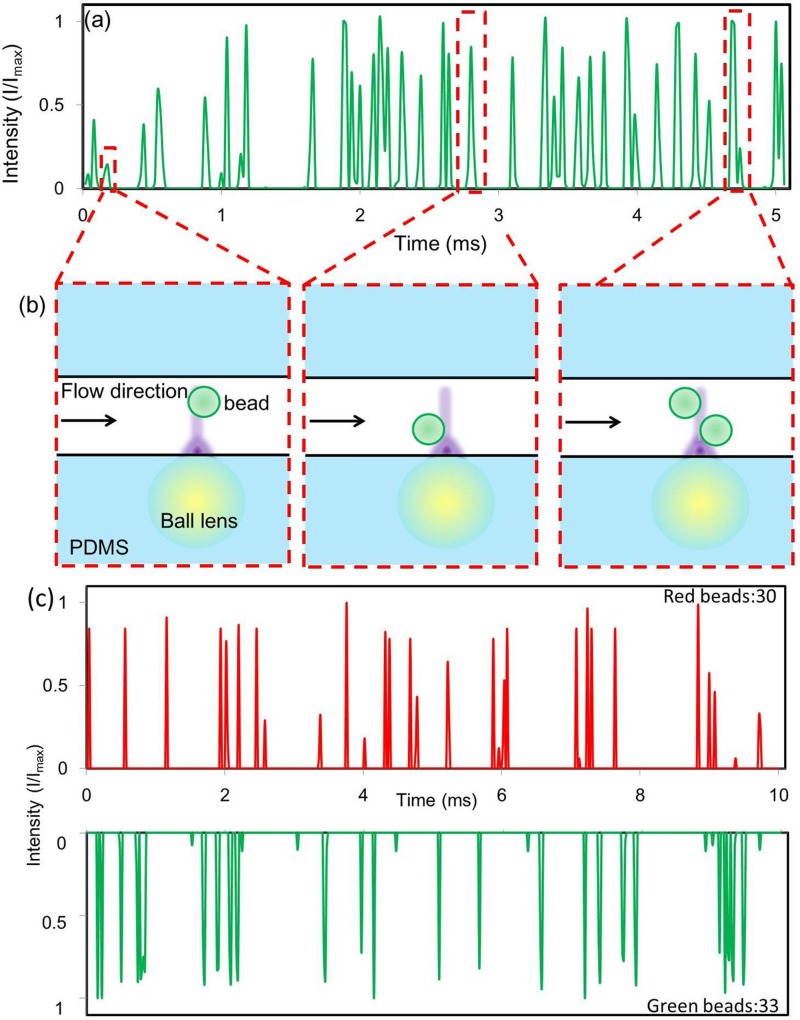
Figure 9a shows the fluorescence signals of sample 1 captured in one channel on the camera. The signal intensity in the figure was obtained by integrating the fluorescence signals over the pixels corresponding to that channel on the image plane. Within a 5 ms duration in Figure 9a, there were 38 peaks detected, which corresponds to a throughput of 7600 bead/s per channel.
Figure 9.
(a) The results of bead counting using sample 1: green beads with concentration of 2 × 10⁷ beads/ml (b) Three different bead locations can cause different peak intensity profiles in (a). The high camera frame rate and the small excitation spot (∼5 μm) allow our flow cytometer to distinguish closely positioned beads. (c) The results of bead counting using sample 2: green and red beads mixed at a 1:1 ratio with a total concentration of 2 × 10⁷ bead/ml.
Since beads were only focused in the lateral direction, their vertical positions in the detection zone can vary. Particles at different heights in the channel receive different excitation light intensity and their emitted fluorescence signals are collected at different efficiency. As a result, the fluorescence intensities detected on the image sensor can vary for beads passing through the detection zone at different heights. The column-shape optical beam formed by a ball lens helps remedise such non-uniform effect since it provides relatively more uniform excitation light intensity in the vertical direction. The ultimate solution, however, is to achieve 3D hydrodynamic focusing of beads in the detection channel. In our current device, we encounter difficulty in achieving 3D sheath flow focusing due to the short BFL of our ball lens. It does not allow us to add one extra fluid layer for the third dimension focusing.
Figure 9b illustrates three different beads' locations and their corresponding fluorescent signals in Figure 9a. A particle passing through the focal point of a microball lens without other beads nearby shows a single isolated peak with high intensity. If a particle in not near the focal point, the detected intensity drops. If two beads are closely positioned, their peaks overlap. Since the focused spot size is ∼5 μm, smaller than the bead size, and the camera frame rate is high, the detection system can distinguish closely positioned particles.
Figure 9c shows the detection results of sample 2 with a 1:1 mixing ratio of green and red fluorescence beads. The result shows a close to 1:1 ratio between the red and green particles, matching well with the sample ratio we prepared.
Multicolor detection of live mammalian cells
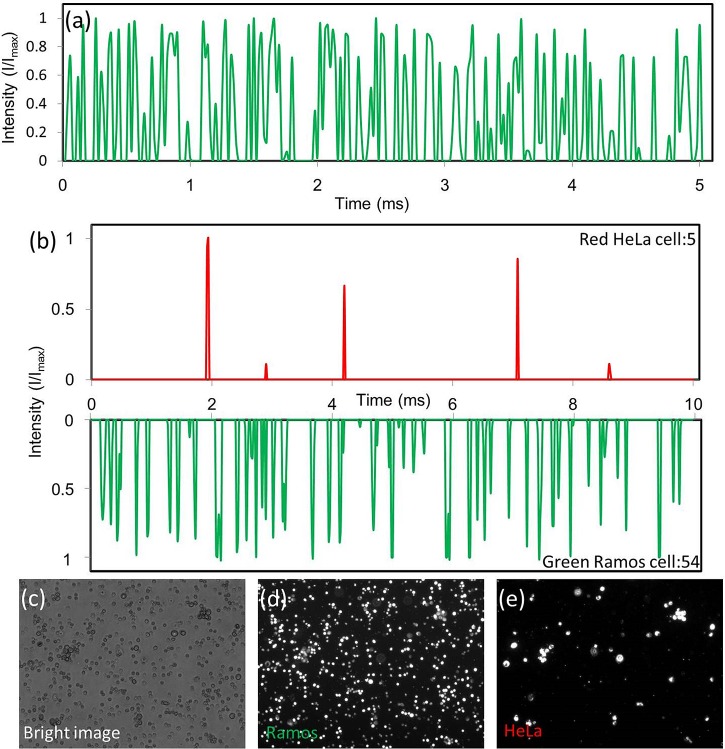
To demonstrate our system's ability in detecting live mammalian cells at high throughput, Ramos cells stained with Vybrant® CFDA-SE (Life technologies, V12883) and suspended in phosphate buffered saline (PBS) were prepared at a concentration of 4 × 10⁷ cell/ml. To obtain high throughput, we pumped the sample and the sheath flow at a volume flow rate of 40 ml/h and 80 ml/h, respectively, and the particle speed is 600 mm/s. The camera frame rate was set at 50 000 fps. Figure 10a shows the detected 64 peaks in one channel within a period of 5 ms. Furthermore, we counted the signal peaks of all 32 channels in a period of 5 ms and obtained a throughput of 358 400 cell/s.
Figure 10.
(a) A high throughput detection of Ramos cells at 12 800 cells/sec per channel was achieved. (b) Multicolor detection of a mixture with red HeLa cells and green Ramos cells mixed at a 1:10 ratio. The results show good agreement with the original ratio of cells we prepared. Microscopic images of cell mixtures collected at the flow cytometer outlet and taken at different modes, from (c) to (e), the bright field, the green fluorescence with a FITC filter, and the red fluorescence with a TRITC filter.
To demonstrate the multicolor detection function, a mixture of fluorescence labeled Ramos and HeLa cells were prepared. This mixture contains CFDA-SE stained Ramos cells and Qtracker® Qdot 655 (Life technology, Q25021MP) stained HeLa cells that were mixed at a 1:10 ratio. A sample with a total concentration of 2 × 10⁷ cells/ml was prepared in PBS solution. The PBS solution is also used as sheath fluid. The flow rate of the cell sample and the sheath fluid were controlled at 30 ml/h and 60 ml/h, respectively. Figure 10b shows the results from one of the 32 channels captured in 10 ms. There were 54 peaks in the green channel and 5 peaks in the red channel during the 10 ms period. The 10:1 detected ratio matches well with the ratio we prepared. In this experiment, a detection throughput of 5900 cells/s per channel or 188 800 cells/s per device was achieved. The cell sample after detection are collected and observed under a multicolor fluorescence microscope to confirm the result obtained in our flow cytometer. Figure 10 shows the bright field image, the fluorescence image with a FITC filter (green), and the fluorescence image with a TRITC filter (red). A 1:10 ratio of green Ramos cells to red HeLa cells matches well with the results from our fluorescence cell counter.
CONCLUSIONS
We have demonstrated a high speed, multicolor, parallel microfluidic fluorescence detector. Our device is realized by implanting a high N.A. micro ball lens array directly into a 3D microfluidic structure to achieve parallel sheath flow focusing and fluorescence detection in 32 channels. 3D microfluidics solves the fluid routing issue for parallel sheath flow focusing faced by general 2D microfluidic devices. The implanted microball lens array provides a flat surface for easy integration with subsequent layers of microfluidic structures and other component. It also allows patterning high-density array of small size, high N.A. microlenses with short focal length for parallel detection in a small footprint size device. We have applied this microball lens integrated 3D microfluidic device to achieve parallel fluorescence detection across 32 channels at a throughput of 358 400 cells/s on a chip.
ACKNOWLEDGMENTS
This work was supported by a ECCS 0747950, ECCS-1232279, and DBI DBI1256178. This work was also supported by National Science Council of Taiwan under Grant Nos. NSC 98-2221-E-002-093, NSC 99-2221-E-002-054-MY2, and NSC 100-2917-I-002-006.
References
- Gronthos S., Franklin D. M., Leddy H. A., Robey P. G., Storms R. W., and Gimble J. M., J. Cell Physiol. 189(1), 54 (2001). 10.1002/jcp.1138 [DOI] [PubMed] [Google Scholar]
- Yen A., Flow Cytometry: Advanced Research and Clinical Applications (CRC, 1989). [Google Scholar]
- Landay A., Ohlsson-Wilhelm B., and Giorgi J. V., AIDS (London) 4(6), 479 (1990). 10.1097/00002030-199006000-00001 [DOI] [PubMed] [Google Scholar]
- Siena S., Bregni M., Brando B., Belli N., Ravagnani F., Gandola L., Stern A. C., Lansdorp P. M., Bonadonna G., and Gianni A. M., Blood 77(2), 400 (1991). [PubMed] [Google Scholar]
- Hu X., Bessette P. H., Qian J., Meinhart C. D., Daugherty P. S., and Soh H. T., Proc. Natl. Acad. Sci. U.S.A. 102(44), 15757 (2005). 10.1073/pnas.0507719102 [DOI] [PMC free article] [PubMed] [Google Scholar]
- Shi J., Huang H., Stratton Z., Huang Y., and Huang T. J., Lab Chip 9(23), 3354 (2009). 10.1039/b915113c [DOI] [PubMed] [Google Scholar]
- Yang S.-Y., Lien K.-Y., Huang K.-J., Lei H.-Y., and Lee G.-B., Biosen. Bioelectron. 24(4), 855 (2008). 10.1016/j.bios.2008.07.019 [DOI] [PubMed] [Google Scholar]
- Goda K., Ayazi A., Gossett D. R., Sadasivam J., Lonappan C. K., Sollier E., Fard A. M., Hur S. C., Adam J., and Murray C., Proc. Natl. Acad. Sci. U.S.A. 109(29), 11630 (2012). 10.1073/pnas.1204718109 [DOI] [PMC free article] [PubMed] [Google Scholar]
- Cho S. H., Godin J. M., Chen C. H., Qiao W., Lee H., and Lo Y. H., Biomicrofiuidics 4(4), 043001(2010). 10.1063/1.3511706 [DOI] [PMC free article] [PubMed] [Google Scholar]
- Ateya D. A., Erickson J. S., Howell P. B., Hilliard L. R., Golden J. P., and Ligler F. S., Anal. Bioanal. Chem. 391(5), 1485 (2008). 10.1007/s00216-007-1827-5 [DOI] [PMC free article] [PubMed] [Google Scholar]
- Golden J. P., Kim J. S., Erickson J. S., Hilliard L. R., Howell P. B., Anderson G. P., Nasir M., and Ligler F. S., Lab Chip 9(13), 1942 (2009). 10.1039/b822442k [DOI] [PMC free article] [PubMed] [Google Scholar]
- Hashemi N., Erickson J. S., Golden J. P., Jackson K. M., and Ligler F. S., Biosens. Bioelectron. 26(11), 4263 (2011). 10.1016/j.bios.2011.03.042 [DOI] [PubMed] [Google Scholar]
- Huh D., Gu W., Kamotani Y., Grotberg J. B., and Takayama S., Physiol. Meas. 26(3), R73 (2005). 10.1088/0967-3334/26/3/R02 [DOI] [PubMed] [Google Scholar]
- Hur S. C., Tse H. T. K., and Di Carlo D., Lab Chip 10(3), 274 (2010). 10.1039/b919495a [DOI] [PubMed] [Google Scholar]
- Kummrow A., Theisen J., Frankowski M., Tuchscheerer A., Yildirim H., Brattke K., Schmidt M., and Neukammer J., Lab Chip 9(7), 972 (2009). 10.1039/b808336c [DOI] [PubMed] [Google Scholar]
- Lee H. C., Hou H. H., Yang R. J., Lin C. H., and Fu L. M., Microfluid. Nanofluid. 11(4), 469 (2011). 10.1007/s10404-011-0812-7 [DOI] [Google Scholar]
- Lin S. C., Yen P. W., Peng C. C., and Tung Y. C., Lab Chip 12, 3135 (2012). 10.1039/c2lc40246g [DOI] [PubMed] [Google Scholar]
- Mao X., Lin S. C., Dong C., and Huang T. J., Lab Chip 9(11), 1583 (2009). 10.1039/b820138b [DOI] [PubMed] [Google Scholar]
- Mao X., Nawaz A. A., Lin S. C., Lapsley M. I., Zhao Y., McCoy J. P., El-Deiry W. S., and Huang T. J., Biomicrofluidics 6(2), 024113 (2012). 10.1063/1.3701566 [DOI] [PMC free article] [PubMed] [Google Scholar]
- McKenna B. K., Evans J. G., Cheung M. C., and Ehrlich D. J., Nat. Methods 8(5), 401 (2011). 10.1038/nmeth.1595 [DOI] [PMC free article] [PubMed] [Google Scholar]
- Mckenna B. K., Selim A., Bringhurst F. R., and Ehrlich D. J., Lab Chip 9(2), 305 (2009) 10.1039/b811889b. [DOI] [PubMed] [Google Scholar]
- Simonnet C. and Groisman A., Anal. Chem. 78(16), 5653 (2006). 10.1021/ac060340o [DOI] [PubMed] [Google Scholar]
- Thangawng A. L., Kim J. S., Golden J. P., Anderson G. P., Robertson K. L., Low V., and Ligler F. S., Anal. Bioanal. Chem. 398(5), 1871 (2010). 10.1007/s00216-010-4019-7 [DOI] [PMC free article] [PubMed] [Google Scholar]
- Seo K., Brackett R., and Frank J., Int. J. Food Microbiol. 44(1), 115 (1998). 10.1016/S0168-1605(98)00129-9 [DOI] [PubMed] [Google Scholar]
- Clayton A., Navabi H., Adams M., Mason M. D., Hobot J. A., Newman G. R., and Jasani B., J. Immunol. Methods 247(1), 163 (2001). 10.1016/S0022-1759(00)00321-5 [DOI] [PubMed] [Google Scholar]
- Wang L., Flanagan L. A., Jeon N. L., Monuki E., and Lee A. P., Lab Chip 7(9), 1114 (2007). 10.1039/b705386j [DOI] [PMC free article] [PubMed] [Google Scholar]
- Lee W., Amini H., Stone H. A., and Di Carlo D., Proc. Natl. Acad. Sci. U.S.A 107(52), 22413 (2010). 10.1073/pnas.1010297107 [DOI] [PMC free article] [PubMed] [Google Scholar]
- Chung A. J., Gossett D. R., and Di Carlo D., Small 9(5), 685 (2012). 10.1002/smll.201202413 [DOI] [PubMed] [Google Scholar]
- Mach A. J., Kim J. H., Arshi A., Hur S. C., and Di Carlo D., Lap Chip 11(17), 2827 (2011). 10.1039/c1lc20330d [DOI] [PubMed] [Google Scholar]
- Hur S. C., Mach A. J., and Di Carlo D., Biomicrofluidics 5(2), 022206 (2011). 10.1063/1.3576780 [DOI] [PMC free article] [PubMed] [Google Scholar]
- Volkel R., Eisner M., and Weible K., Microelectron. Eng. 67–68, 461 (2003) 10.1016/S0167-9317(03)00102-3. [DOI] [Google Scholar]
- Lohmann A., Appl. Opt. 28(23), 4996 (1989). 10.1364/AO.28.004996 [DOI] [PubMed] [Google Scholar]
- Lee L. and Szema R., Science 310(5751), 1148 (2005). 10.1126/science.1115248 [DOI] [PubMed] [Google Scholar]
- Schonbrun E., Abate A., Steinvurzel P., Weitz D., and Crozier K., Lab Chip 10(7), 852 (2010). 10.1039/b923554j [DOI] [PubMed] [Google Scholar]
- Fan Y., Sheen H., and Chiou P., presented at the 2012 IEEE 25th International Conference on Micro Electro Mechanical Systems (MEMS), Paris, France, 2012.
- Orth A. and Crozier K., Opt. Express 20(12), 13522 (2012). 10.1364/OE.20.013522 [DOI] [PubMed] [Google Scholar]
- Pantelis P. and McCartney D., Pure Appl. Opt. 3, 103 (1994). 10.1088/0963-9659/3/2/002 [DOI] [Google Scholar]
- Lin C .P., Yang H., and Chao C. K., J. Micromech. Microeng. 13, 775 (2003). 10.1088/0960-1317/13/5/333 [DOI] [Google Scholar]
- Kouchiyama A., Ichimura I., Kishima K., Nakao T., Yamamoto K., Hashimoto G., Iida A., and Osato K., Jpn. J. Appl. Phys., Part 1 41, 1825 (2002). 10.1143/JJAP.41.1825 [DOI] [Google Scholar]
- Zimmer K., Hirsch D., and Bigl F., Appl. Surf. Sci. 96–98, 425 (1996) 10.1016/0169-4332(95)00498-X. [DOI] [Google Scholar]
- Wu M., Park C., and Whitesides G., Langmuir 18(24), 9312 (2002). 10.1021/la015735b [DOI] [Google Scholar]
- Ishii Y., Koike S., Arai Y., and Ando Y., Jpn. J. Appl. Phys., Part 1 39(3B), 1490 (2000). 10.1143/JJAP.39.1490 [DOI] [Google Scholar]
- Ong N., Koh Y., and Fu Y., Microelectron. Eng. 60(3–4), 365 (2002). 10.1016/S0167-9317(01)00695-5 [DOI] [Google Scholar]
- Huang P. H., Huang T. C., Sun Y. T., and Yang S. Y., Opt. Express 16(5), 3041 (2008). 10.1364/OE.16.003041 [DOI] [PubMed] [Google Scholar]
- Bardinal V., Daran E., Leichle T., Vergnenegre C., Levallois C., Camps T., Conedera V., Doucet J., Carcenac F., and Ottevaere H., Opt. Express 15(11), 6900 (2007). 10.1364/OE.15.006900 [DOI] [PubMed] [Google Scholar]
- Jiang L. T., Huang T. C., Chiu C. R., Chang C. Y., and Yang S. Y., Opt. Express 15(19), 12088 (2007). 10.1364/OE.15.012088 [DOI] [PubMed] [Google Scholar]
- Pan L. W., Shen X., and Lin L., J Microelectromech. Syst. 13(6), 1063 (2004). 10.1109/JMEMS.2004.838363 [DOI] [Google Scholar]
- Nguyen N.-T., Biomicrofluidics 4, 031501 (2010). 10.1063/1.3460392 [DOI] [PMC free article] [PubMed] [Google Scholar]
- Schonbrun E., Rinzler C., and Crozier K., Appl. Phys. Lett. 92, 071112 (2008). 10.1063/1.2837538 [DOI] [Google Scholar]
- Schonbrun E., Wong J., and Crozier K. B., Phys. Rev. E. 79(4), 042401 (2009). 10.1103/PhysRevE.79.042401 [DOI] [PubMed] [Google Scholar]
- Schonbrun E., Ye W. N., and Crozier K. B., Opt. Lett. 34(14), 2228 (2009). 10.1364/OL.34.002228 [DOI] [PubMed] [Google Scholar]
- Schonbrun E., Steinvurzel P. E., and Crozier K. B., Opt. Express 19(2), 1385 (2011). 10.1364/OE.19.001385 [DOI] [PubMed] [Google Scholar]
- Xia Y., Kim E., Zhao X. M., Rogers J. A., Prentiss M., and Whitesides G. M., Science 273(5273), 347 (1996). 10.1126/science.273.5273.347 [DOI] [PubMed] [Google Scholar]
- Zhang M., Wu J., Wang L., Xiao K., and Wen W., Lab Chip 10(9), 1199 (2010). 10.1039/b923101c [DOI] [PubMed] [Google Scholar]
- Kung Y. C., Huang K. W., Yang Y., Fan Y. J., and Chiou P. Y., presented at the 26th International Conference on Micro Electro Mechanical Systems (MEMS), Taipei, Taiwan: (2013).


