

Abstract
Systemic sclerosis (SSc) and systemic lupus erythematosus (SLE) are two archetypal systemic autoimmune diseases which have been shown to share multiple genetic susceptibility loci. In order to gain insight into the genetic basis of these diseases, we performed a pan-meta-analysis of two genome-wide association studies (GWASs) together with a replication stage including additional SSc and SLE cohorts. This increased the sample size to a total of 21 109 (6835 cases and 14 274 controls). We selected for replication 19 SNPs from the GWAS data. We were able to validate KIAA0319L (P = 3.31 × 10⁻¹¹, OR = 1.49) as novel susceptibility loci for SSc and SLE. Furthermore, we also determined that the previously described SLE susceptibility loci PXK (P = 3.27 × 10⁻¹¹, OR = 1.20) and JAZF1 (P = 1.11 × 10⁻⁸, OR = 1.13) are shared with SSc. Supporting these new discoveries, we observed that KIAA0319L was overexpressed in peripheral blood cells of SSc and SLE patients compared with healthy controls. With these, we add three (KIAA0319L, PXK and JAZF1) and one (KIAA0319L) new susceptibility loci for SSc and SLE, respectively, increasing significantly the knowledge of the genetic basis of autoimmunity.
INTRODUCTION
Most autoimmune disorders are genetically complex and clinically heterogeneous. Classification permits physicians to distinguish individual autoimmune criteria based on the typical clinical features. However, underlying these separate clinical features, there is a genetic continuum of susceptibility factors and molecular pathways leading to autoimmunity. This becomes clear when analyzing existing genetic data according to clinical subphenotypes, reducing the overall genetic heterogeneity in the analyses (1–8). This has been clearly demonstrated in rheumatoid arthritis (RA), in which separating anti-citrullinated protein antibody positive and negative cases resulted in a far more homogeneous genetic analysis revealing genetic subgroups (1,3–6). The aim of personalized medicine is thus to accomplish a degree of resolution that allows us to distinguish genetically and molecularly such groups and provide more targeted therapeutic interventions.
There is a growing body of evidence that all autoimmune disorders share to a varying degree their genetic susceptibility loci (9). It is clear that lack of statistical power due to limited sample size is a barrier to completely defining the genetic contribution to autoimmunity. As we increase our sample size, we can identify additional genes shared by some diseases but not shared by others. From the viewpoint that all autoimmune disorders are heterogeneous entities whose specific manifestations depend on the presence of several susceptibility genetic variants and environmental triggers, the combined analysis of different autoimmune disorders will greatly increase our statistical power to detect modest genetic effects shared among them. This approach has already been successfully used to detect the shared genetic susceptibility component of RA, celiac disease, psoriasis and Crohn's disease (10–12). In the present study, we meta-analyze the GWASs of two autoimmune disorders that have been demonstrated to share a relatively large portion of their genetic component and clinical features: systemic sclerosis (SSc) and systemic lupus erythematosus (SLE) (13, 14), identifying new loci for each disease. We would suggest a similar approach for other autoimmune diseases in the future.
RESULTS
The overall process followed during this study is illustrated in Figure 1 and described in detail in the Materials and methods section. Briefly, from the pan-meta-analysis of the SSc and SLE GWAS (15,16), we selected all SNPs which presented a GC-corrected P-value of <5 × 10⁻⁶. From these, we further selected for replication all SNPs which were associated with both diseases independently at nominal level. For a more detailed description of the selection criteria, see the Materials and methods section.
Figure 1.
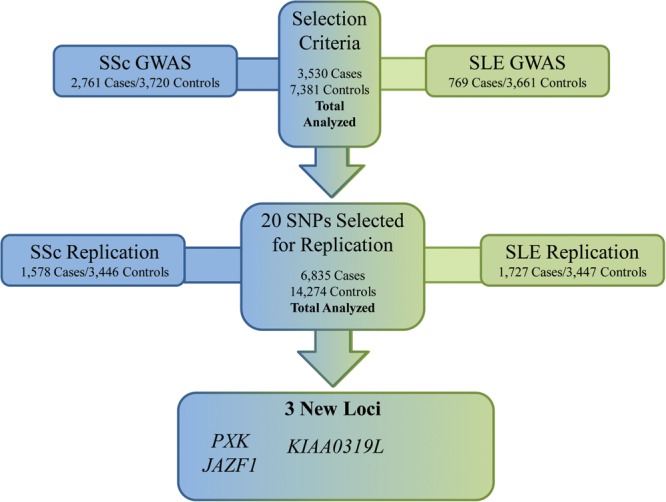
Workflow diagram showing the overall process followed during the present work.
According to these selection criteria, we investigated 19 SNPs whose statistics are shown in Table 1 and Figure 2. According to the significance criteria established (see Materials and methods section), we could confirm one new association shared by SSc (more specifically in the limited cutaneous subtype) and SLE: rs2275247 in KIAA0319L (combined P-value = 1.40 × 10⁻¹⁰, OR = 1.51; SSc P-value = 3.92 × 10⁻⁶; SLE P-value = 4.44 × 10⁻⁶) (Table 1). Furthermore, we were able to determine two new genetic susceptibility regions at genome-wide level of significance in the combined analysis of SSc which had been previously described only in SLE: PXK (rs2176082, combined P-value = 5.24 × 10⁻¹¹, OR = 1.21; SSc P-value = 4.44 × 10⁻⁷; SLE P-value = 1.12 × 10⁻⁵) and JAZF1 (combined P-value = 1.60 × 10⁻⁸, OR = 1.14; SSc P-value = 3.63 × 10⁻⁵; SLE P-value = 1.19 × 10⁻⁴) but with a modest association particularly for the SSc analysis alone. This suggests a minor role of these genetic variants in SSc compared with SLE (Table 1). It is noteworthy that the associations present in the KIAA0319L and PXK regions were still significant at GWAS level after including as covariates the first three principal components in a logistic regression model, while the association in the JAZF1 was slightly reduced below GWAS level after this (the P-value not corrected for principal components was 1.60 × 10⁻⁸ and after principal component correction was 5.52 × 10⁻⁸), which suggests minor population stratification for this SNP (Table 1).
Table 1.
Results of the GWAS analysis, replication analysis and combined analysis of the 19 SNPs selected for replication under different criteria (see Materials and methods)
| Chr. | SNP | Change | Locus | SSc Groupa | Combined |
GWAS |
Replication |
||||||||||||||||
|---|---|---|---|---|---|---|---|---|---|---|---|---|---|---|---|---|---|---|---|---|---|---|---|
| Combined |
SSc |
SLE |
Combined |
SSc |
SLE |
Combined |
SSc |
SLE |
|||||||||||||||
| Pb | Pc | OR | Pb | OR | Pb | OR | Pb | OR | Pb | OR | Pb | OR | Pb | OR | Pb | OR | Pb | OR | |||||
| 1 | rs2275247 | C/T | KIAA0319L | lcSSc | 1.40E−10 | 4.34E−10 | 1.51 | 3.92E−06 | 1.46 | 4.44E−06 | 1.58 | 7.62E−07 | 1.53 | 1.22E−04 | 1.47 | 9.76E−04 | 1.71 | 3.28E−05 | 1.49 | 1.06E−02 | 1.46 | 9.17E−04 | 1.52 |
| 2 | rs4907310 | T/C | ITPRIPL1 | dcSSc | 7.73E−04 | 2.65E−04 | 1.10 | 2.99E−03 | 1.15 | 4.89E−02 | 0.93 | 1.24E−07 | 1.25 | 3.81E−04 | 1.22 | 7.62E−05 | 0.79 | 5.90E−01 | 0.98 | 9.65E−01 | 1.00 | 5.63E−01 | 1.03 |
| 2 | rs12466487 | C/T | R3HDM1 | dcSSc | 3.73E−02 | 9.58E−01 | 1.08 | 1.76E−04 | 1.24 | 6.86E−01 | 1.02 | 5.42E−08 | 1.32 | 7.78E−04 | 1.25 | 7.92E−06 | 0.71 | 2.78E−03 | 0.85 | 8.98E−02 | 1.20 | 9.83E−06 | 1.31 |
| 2 | rs10498070 | C/A | DNPEP | lcSSc | 1.87E−07 | 8.92E−06 | 1.16 | 1.44E−02 | 1.10 | 6.98E−07 | 0.81 | 5.37E−07 | 1.23 | 7.27E−03 | 1.14 | 5.74E−07 | 0.70 | 2.46E−02 | 1.10 | 6.39E−01 | 1.03 | 1.40E−02 | 0.88 |
| 3 | rs2176082 | A/G | PXK | ACA | 5.24E−11 | 1.68E−09 | 1.21 | 4.44E−07 | 1.27 | 1.12E−05 | 1.18 | 1.16E−08 | 1.27 | 6.09 E−06 | 1.30 | 4.11E−04 | 1.24 | 2.79E−04 | 1.16 | 1.74E−02 | 1.21 | 4.76E−03 | 1.15 |
| 4 | rs6814708 | C/T | SORCS2 | ACA | 1.81E−05 | 9.01E−04 | 0.89 | 6.80E−04 | 0.86 | 5.26E−03 | 1.10 | 1.29E−07 | 0.81 | 3.13E−03 | 0.85 | 5.53E−06 | 1.30 | 3.65E−01 | 0.97 | 8.56E−02 | 0.88 | 9.87E−01 | 1.00 |
| 5 | rs285912 | G/C | KCNN2 | ACA | 1.52E−05 | 9.93E−04 | 0.88 | 1.33E−04 | 0.83 | 1.19E−02 | 1.10 | 1.49E−07 | 0.80 | 7.10E−04 | 0.82 | 5.10E−05 | 1.28 | 3.30E−01 | 0.96 | 6.62E−02 | 0.86 | 9.52E−01 | 1.00 |
| 6 | rs2145748 | A/G | CDC5L | lcSSc | 6.50E−03 | 5.85E−03 | 0.92 | 2.27E−02 | 0.91 | 1.13E−01 | 1.07 | 4.52E−07 | 0.82 | 6.82E−04 | 0.84 | 1.30E−04 | 1.28 | 2.27E−01 | 1.05 | 4.28E−01 | 1.06 | 3.62E−01 | 0.96 |
| 6 | rs3827644 | C/G | ATG5 | SSc | 4.95E−07 | 1.86E−06 | 1.15 | 4.16E−03 | 1.12 | 1.28E−05 | 1.21 | 7.72E−07 | 1.20 | 5.51E−03 | 1.13 | 1.73E−06 | 1.38 | 4.61E−02 | 1.09 | 3.37E−01 | 1.07 | 7.62E−02 | 1.10 |
| 7 | rs4725072 | A/C | ICA1 | SSc | 1.55E−05 | 6.04E−05 | 1.22 | 1.85E−03 | 1.22 | 2.49E−03 | 1.24 | 2.78E−05 | 1.31 | 2.25E−03 | 1.27 | 2.88E−03 | 1.41 | 5.65E−02 | 1.14 | 2.74E−01 | 1.12 | 1.13E−01 | 1.15 |
| 7 | rs1635852 | T/C | JAZF1 | SSc | 1.60E−08 | 5.52E−08 | 1.14 | 3.63E−05 | 1.13 | 1.19E−04 | 1.14 | 2.08E−05 | 0.88 | 1.71E−03 | 0.89 | 2.73E−03 | 1.18 | 2.27E−04 | 1.13 | 6.52E−03 | 1.15 | 1.10E−02 | 1.12 |
| 7 | rs1133906 | T/C | SAMD9L | lcSSc | 2.27E−07 | 2.96E−06 | 1.21 | 2.81E−03 | 1.17 | 1.41E−05 | 1.25 | 7.43E−08 | 1.31 | 5.23E−04 | 1.25 | 1.54E−05 | 1.43 | 4.75E−02 | 1.11 | 7.70E−01 | 1.03 | 2.60E−02 | 1.15 |
| 9 | rs1002841 | C/T | SEC61B | ACA | 9.76E−03 | 1.98E−02 | 1.08 | 9.99E−02 | 1.08 | 4.62E−02 | 0.93 | 2.45E−07 | 1.24 | 8.97E−03 | 1.16 | 1.53E−06 | 0.74 | 1.56E−01 | 0.95 | 4.58E−01 | 0.95 | 2.29E−01 | 1.06 |
| 9 | rs7038399 | A/G | AKAP2 | dcSSc | 1.72E−04 | 2.49E−03 | 0.83 | 1.80E−03 | 0.77 | 1.70E−02 | 0.86 | 3.81E−08 | 0.65 | 1.15E−04 | 0.66 | 6.51E−05 | 0.64 | 8.47E−01 | 1.01 | 8.04E−01 | 1.04 | 9.25E−01 | 1.01 |
| 10 | rs10903528 | A/G | ADARB2 | ATA | 1.63E−05 | 7.09E−04 | 1.22 | 3.91E−04 | 1.32 | 5.47E−03 | 0.85 | 5.35E−07 | 1.40 | 3.89E−05 | 1.48 | 2.61E−03 | 0.75 | 2.21E−01 | 1.08 | 6.87E−01 | 1.06 | 2.44E−01 | 0.92 |
| 11 | rs1355223 | A/G | EHF | lcSSc | 3.72E−06 | 3.26E−05 | 1.12 | 8.91E−05 | 1.15 | 8.70E−03 | 1.10 | 3.87E−07 | 1.19 | 2.42E−04 | 1.17 | 3.88E−04 | 1.22 | 1.51E−01 | 1.05 | 1.05E−01 | 1.10 | 5.52E−01 | 1.03 |
| 12 | rs10161149 | T/C | NAV3 | dcSSc | 2.11E−04 | 7.41E−05 | 1.24 | 2.87E−03 | 1.31 | 1.78E−02 | 1.19 | 3.05E−07 | 1.51 | 1.29E−02 | 1.30 | 4.17E−07 | 1.86 | 6.38E−01 | 1.04 | 9.98E−02 | 1.32 | 7.21E−01 | 0.97 |
| 15 | rs2925256 | T/C | UBE3A | ATA | 6.62E−03 | 7.00E−03 | 1.29 | 1.39E−02 | 1.45 | 1.05E−01 | 1.21 | 9.90E−07 | 1.88 | 1.98E−05 | 2.12 | 6.11E−03 | 1.65 | 6.06E−01 | 0.93 | 1.37E−01 | 0.63 | 9.28E−01 | 1.01 |
| 15 | rs9920771 | T/C | NEO1 | ATA | 1.09E−04 | 1.28E−04 | 0.75 | 1.99E−02 | 0.70 | 1.45E−03 | 1.31 | 4.28E−09 | 0.49 | 3.47E−03 | 0.54 | 1.49E−07 | 2.12 | 6.07E−01 | 0.95 | 9.95E−01 | 1.00 | 5.67E−01 | 1.06 |
The loci associated at GWAS level in the pan-meta-analysis are marked in bold.
aAll SSc and SSc-SLE combined P-values are referred to the specified SSc phenotype.
bThe SSc–SLE combined P-values are calculated according to the inverse variance method, while the SSc or SLE analyses are performed according to the Mantel–Haenszel test for pooling ORs (see the Materials and methods section for more details).
cP-values corrected for the first three principal components.
Figure 2.
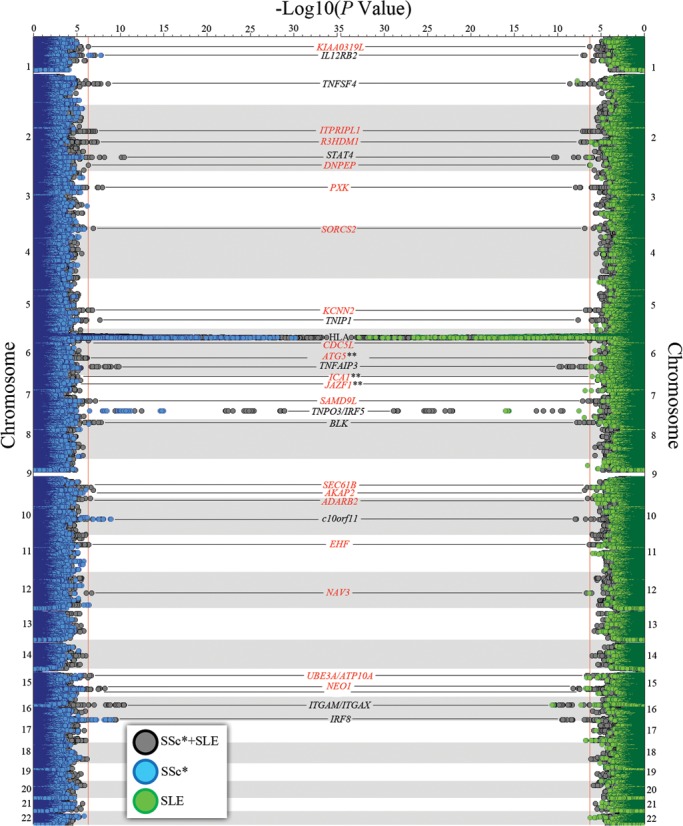
Twin Manhattan plot representing the results of the SSc (left side, blue), SLE (right side, green) and combined GWAS analysis (both sides, grey). Selected loci for replication in independent cohorts are marked in red. *SSc plotting represents either the total disease or any of its considered subphenotypes, i.e. ACA positive, ATA positive, lcSSc and dcSSc. **ICA1 and JAZF1 SNPs were selected according to selection criteria three (see Materials and methods), and not because of reaching the significance threshold in the GWAS stage.
In whole blood gene expression data, we observed that KIAA0319L was significantly overexpressed in SLE patients compared with unaffected controls [P = 5.36 × 10⁻⁵, false discovery rate (FDR) = 2.94 × 10⁻³] with a fold change of 1.9, while in SSc, there was a trend towards overexpression compared with healthy individuals (P = 9.05 × 10⁻³, FDR = 0.14) with a fold change of 1.3. No significant expression differences were observed for PXK and JAZF1 in either SSc or SLE compared with controls (Table 2).
Table 2.
Expression data of the successfully replicated loci from Table 1, whether at GWAS level or suggestive level of association
| Chr. | Gene | SSc versus controls |
SLE versus controls |
||||
|---|---|---|---|---|---|---|---|
| Parametric P | FDR | Fold change | Parametric P | FDR | Fold change | ||
| 1 | KIAA0319L | 9.05E−03 | 1.43E−01 | 1.328 | 5.36E−05 | 2.94E−03 | 1.937 |
| 3 | PXK | NDa | NDa | NDa | NDa | NDa | NDa |
| 7 | JAZF1 | 9.04E−01 | 9.60E−01 | 0.990 | 3.90E−01 | 6.17E−01 | 0.870 |
Significantly overexpressed genes are marked in bold.
aPXK was not sufficiently expressed in whole blood samples and did not pass the filtering criteria.
Finally, we wanted to address how the biological processes are differentially distributed and shared between SSc and SLE. For this, we assigned each SNP with a P-value of <0.05 and 5 × 10⁻⁶ to a gene (allowing a 20 kb window surrounding it). With this we were able to determine whether any particular biological process was overrepresented among these two sets of GWAS association (P < 0.05 and P < 5 × 10⁻⁶). As observed in Table 3, the biological processes most significantly overrepresented among the SSc and SLE associated genes were those belonging to the immune system (27 processes for SSc, being the best P-value = 2.05 × 10⁻¹³; and 8 processes for SLE being the best P = 2.14 × 10⁻⁸). Among these immune system processes involved in SSc and SLE, the topmost one was cellular response to interferon-gamma (GO term 0071346). Another set of processes apparently shared by SSc and SLE were those related to the nervous system, while signaling, molting and cell adhesion were exclusively overrepresented among the SSc associated genes (Table 3).
Table 3.
Significantly overrepresented groups of biological processes among the genes associated with either SSc or SLE and whether they are shared between them or not
| Disease | SNP selectiona | Group | Top biological process | Shared | Significant processes | GO term | Best P-valueb |
|---|---|---|---|---|---|---|---|
| SSc | 5.00E−06 | Immune system | Cellular response to interferon-gamma | Yes | 27 | GO:0071346 | 2.05E−13 |
| SSc | 5.00E−06 | Signaling | Cytokine-mediated signaling pathway | No | 8 | GO:0019221 | 4.57E−11 |
| SSc | 0.05 | Nervous system | Transmission of nerve impulse | No | 3 | GO:0019226 | 9.71E−10 |
| SSc | 5.00E−06 | Molting | Exogen | No | 7 | GO:0042638 | 2.61E−09 |
| SSc | 0.05 | Cell adhesion | Cell adhesion | No | 4 | GO:0007155 | 3.29E−09 |
| SLE | 5.00E−06 | Immune system | Cellular response to interferon-gamma | Yes | 8 | GO:0071346 | 2.14E−08 |
| SLE | 0.05 | Nervous system | Nervous system development | No | 4 | GO:0007399 | 1.34E−07 |
Significantly overrepresented biological processes are marked in bold.
aThreshold P-value for SNP selection from the GWAS data for the biological process analyses.
bThe P-value for the FDR-corrected hypergeometric test for the most associated biological process for this group (see the Materials and methods section for more details).
DISCUSSION
Utilizing a GWAS pan-meta-analysis strategy, we were able to identify a total of three new autoimmunity susceptibility loci, all of which are new for SSc and one of which is new for SLE. These new genetic susceptibility loci were undetected in the previous SSc and SLE GWASs due to the lack of statistical power.
The clearest example of this is rs2275247 in KIAA0319L, with a minor allele frequency of 3.43% in our GWAS cohorts, which would have gone undetected as Supplementary Material, Table S1, predicts. However, due to the combined analysis, we were able to capture this association in our meta-analysis. KIAA0319L was previously associated with learning and cognition disabilities (17). Interestingly, the protein contains among its evolutionary conserved domains a polycystic kidney disease domain, which is an immunoglobulin family-like domain of unclear function (18). Furthermore, KIAA0319L was significantly overexpressed in peripheral blood cells from SLE patients compared with those of healthy controls, also showed that a similar trend was observed in SSc (Table 2). Another possible lead pointing to the role of KIAA0319L in autoimmunity can be found in the expression profile of this gene in the bioGPS public database (http://biogps.org/#goto=welcome); although this gene is expressed ubiquitously, it has a particularly high expression in immune cells such as macrophages, natural killer cells and other hematopoietic cells in the mouse (Supplementary Material, Fig. S1) and CD33+ myeloid cells and CD14+ monocytes in humans (Supplementary Material, Fig. S2). Meanwhile, PXK and JAZF1 were previously described as SLE genetic risk factors (15,19). The role of these three genes in SLE pathogenesis remains largely unknown, it is also unclear whether their pathogenic mechanism is the same or different in SSc. However, PXK has been described to be involved in the trafficking of the epidermal growth factor receptor, which poses an attractive role in both SSc and SLE (20). Furthermore, PXK has been described to be associated only with autoantibody production in SLE in a small cohort (21), analogously to what we have observed in SSc in this study (Table 1). As of JAZF1, it has been associated with skeletal frame size and height, relating it to bone morphogenesis and collagen deposit (22,23), a key process in disorders affecting skin such as SSc and SLE.
In GWAS data, we could classify the genetic associations into three groups: Tier 1 for the GWAS-level associations (P < 5 × 10⁻⁸), Tier 2 for suggestive associations (P < 5 × 10⁻⁶) and Tier 3 (all the remaining associations until 0.05). In the analysis of biological processes performed in this study (Table 3, Supplementary Material, Table S2), we used two sets of genes: first the Tier 1 and Tier 2 associations (stronger associations in general with better P-values and ORs) and the Tier 3 associations, in which, should there be any true genetic association, it would be weaker. When using all SNPs (translated to nearby genes) from Tiers 1 and 2 in this analysis, we observed that many biological processes gathered under the immune system label are important for both SSc and SLE, which is to be expected. Still in the Tier 1 and 2 associations, we see that signaling processes (cytokine mediated) and molting (to process by which the external layers of complex living beings is renewed) are also important to SSc. In fact, we have already seen this in SSc genetic studies which have described genes involved in morphogenesis and fibrosis to play a role in this disease (2,16,24). Conversely, when we perform the biological process analysis including the Tier 3 genes, we observe that genes involved in the nervous system are important to both SSc and SLE (although different specific biological processes, Supplementary Material, Table S2) and cell adhesion is important to SSc. These biological processes being involved in SSc and SLE make sense based on the current knowledge (25–33), but so far we have failed to find the specific genetic markers which could induce the neurological complications of SLE or SSc or cell adhesion in SSc.
Often, the association of a genetic variant with a trait is referred to by some gene in the same region, picked by its proximity or functional attractiveness considering the studied trait. Nevertheless, we also wanted to asses whether any of the described associations with SSc or SLE were in the same region and represented the same signal attributed by different genes. For this, we performed a GRAIL analysis (34), taking into account all described genetic associations with a P-value of <5 × 10⁻⁴ in the bibliography with any of the diseases. As seen in Figure 3, all of the associated regions are represented by the previously described genes in those regions, with one notable exception: in the genetic region represented by the association of rs12540874, the association was attributed to GRB10 in SSc (2) and to IKZF1 in SLE (15). Indeed, the signals were different in the studies by Gorlova et al. and Harley et al., but according to the GRAIL analysis the most plausible associated gene based on the current knowledge is IKZF1 (having connections with 12 other genes in the analysis) rather than GRB10 (0 connections according to the literature on the other genes).
Figure 3.
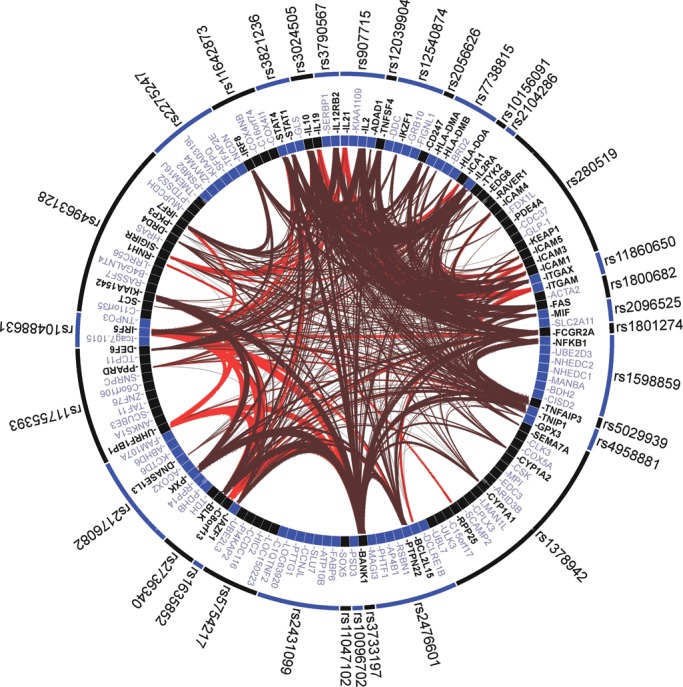
GRAIL analysis of all the described susceptibility loci for SSc and/or SLE with P < 5 × 10⁻⁴. The release 18 of the human genome and the PubMed text as of 2012 were used for the GRAIL analysis.
Due to the increased statistical power derived from the merging of two GWASs in SSc and SLE and the addition of large replication cohorts, we were able to establish one new functionally attractive susceptibility locus for SSc and SLE (KIAA0319L) and two new susceptibility loci for SSc (PXK and JAZF1) at GWAS level. This study, together with several others, adds evidence for the genetic continuum that underlies SSc, SLE and most autoimmune disorders.
MATERIALS AND METHODS
Study cohorts
The GWAS cohorts analyzed in this study were composed of a total of 3530 cases and 7381 healthy controls. Of these, 2761 cases and 3720 healthy controls belonged to a previous SSc GWAS conducted on cohorts from Spain, Germany, The Netherlands and USA (16). The rest of the cases and controls belonged to a previously published SLE GWAS conducted in the USA, SLEGEN cohort composed of 769 SLE patients and 3661 healthy controls (15) (Supplementary Material, Tables S3 and S4).
We selected independent SSc and SLE replication cohorts in order to confirm the results observed in the previous meta-GWAS stage. The SSc replication cohort was composed of 432 cases and 380 controls from Spain, 691 cases and 241 controls from Italy and 455 cases and 2826 controls from the UK, while the SLE replication cohort was composed of 375 cases and 380 controls from Spain, 335 cases and 240 controls from Italy and 1017 cases and 2826 controls from the UK (Supplementary Material, Table S3). Supplementary Material, Table S4, shows key features of the SSc cohorts analyzed. All the samples in the replication cohorts were recruited from hospitals and clinics of each country after approval by the corresponding ethics committees. Genotype data from the UK replication controls were obtained from the WTCCC data repositories, for which we were granted access.
All cases either met the American College of Rheumatology preliminary criteria for the classification of SSc (35) or had at least three of the five CREST (calcinosis, Raynaud's phenomenon, esophageal dysmotility, sclerodactyly, telangiectasias) features and were classified according to their skin involvement and their auto-antibody production status (36,37). All SLE patients in the current study fulfilled the revised criteria for classification of SLE from the American College of Rheumatology (38). All individuals enrolled in the present study provided written informed consents.
Data quality control
GWAS data were filtered as previously described (16) using as a limits a 90% success call rate per SNP and individual, a deviation from the Hardy–Weinberg equilibrium of a P-value <0.0001 and a minor allele frequency <1%. The first 10 principal components were estimated and individuals who deviated more than three standard deviations from the centroid of their population in the first two principal components were excluded as outliers. The replication cohorts were filtered in the same way. The data for PCA adjustment in the logistic regression were obtained from Immunochip and GWAS data of our replication cohorts, except for the 455 SSc UK cases.
Genotyping
The GWAS genotyping of the SSc cases and controls was performed as follows: the Spanish SSc cases and controls together with Dutch and German SSc cases were genotyped at the Department of Medical Genetics of the University Medical Center Utrecht (The Netherlands) using the commercial release Illumina Human CNV370K BeadChip. Genotype data for Dutch and German controls were obtained from the Illumina Human 550KBeadChip available from a previous study. The SSc case group from the USA was genotyped at the Boas Center for Genomics and Human Genetics, Feinstein Institute for Medical Research, North Shore Long Island Jewish Health System using the Illumina Human 610-Quad BeadChip. CGEMS and Illumina iControl DBcontrols were genotyped on the Illumina Hap550KBeadChip. SNPs selected for the replication phase were genotyped in the replication cohorts using Applied Biosystems' TaqMan SNP assays on ABI Prism 7900 HT real-time thermocyclers.
Study design
Considering the size of our cohort for both study phases, simultaneously we calculated the statistical power for the different scenarios according to Skol et al. (39). Supplementary Material, Table S1, shows the statistical power to detect different effect sizes. On average, we had 86% statistical power to detect an OR of 1.20 with a minor allele frequency of 0.20.
Taking this into consideration, for the GWAS analysis three different criteria were followed to select SNPs for replication and maximization of our success in signal detection:
In order to detect common signals for SSc and SLE which caused either risk or protection in both diseases, we selected SNPs that showed a P-value of the SSc and SLE meta-analysis <5 × 10⁻⁷and showed a nominally significant association with both diseases at a P-value of <0.05, as well as no significant heterogeneity in the SSc cohorts meta-analysis (Q > 0.05) (Supplementary Material, Table S5).
To detect common signals for SSc and SLE which caused either risk or protection in one of the diseases and the opposite effect in the other, we selected SNPs that showed a P-value of the SSc and SLE meta-analysis (using for SLE in this case 1/OR instead of the OR) <5 × 10⁻⁷ and were associated with both a P-value of < 0.05 in both diseases, and without significant heterogeneity in the SSc cohorts meta-analysis (Q > 0.05) (Supplementary Material, Table S6).
To further detect any susceptibility variants previously reported for one of the diseases but not reported for the other, we selected any SNP with an overall P-value of <5 × 10⁻⁵ and associated separately in SSc and SLE (at a P-value of <0.05) which had been previously described as a genetic risk factor for either disease (Supplementary Material, Table S7).
In any of these cases when performing the pan-meta-analysis of SSc and SLE, we also considered the most frequent SSc subphenotypes (classified as stated above): anti-centromere antibody (ACA) positive subgroup, anti-topoisomerase I antibody (ATA) positive subgroup, limited cutaneous subtype (lcSSc) and diffuse cutaneous subtype (dcSSc) (36,37). Supplementary Material, Figure S3, shows from which subphenotype of SSc each of the selected SNPs was derived from for the replication step.
After the replication stage was completed, we considered a signal to be statistically significant if the combined (SSc and SLE, GWAS and replication cohorts) meta-analysis P-value was <5 × 10⁻⁸, and if the meta-analysis P-value (GWAS and replication cohorts) for each disease and stage was also significant.
Statistical analysis
Meta-analysis of the SSc GWAS data was performed with the Cochran–Mantel–Haenszel test correcting for the genomic inflation factor lambda (GC correction) (Supplementary Material, Fig. S4). Analysis of the SLE GWAS data was performed by a simple χ2 2 × 2 test correcting the P-values for the genomic inflation factor lambda (GC correction) (Supplementary Material, Fig. S4). The pan-meta-analysis of the SSc and SLE GWAS data was performed using the inverse variance method calculating the resulting ORs. When the replication cohorts were included in the analysis, they were also analyzed using the inverse variance method. The analysis of the GWAS and replication cohorts together was also performed by means of logistic regression analysis using the first three principal components as covariates in order to rule out any population stratification effect. When different associations were found in the same locus, the underlying association hit was determined by means of conditional logistic regression analysis. All statistical analyses were performed using Plink version 1.07 (40) (http://pngu.mgh.harvard.edu/~purcell/plink/) and HelixTree SNP Variation Suite 7 (http://www.goldenhelix.com/).
Biological process analysis
We performed the biological process analysis of the SSc and SLE GWAS data according to Zhang et al. (41). For this, we performed two analyses on each disease, one selecting all SNPs with a P-value <0.05 and the other selecting all SNPs with a P-value <5 × 10⁻⁶. In both the cases, the test to determine whether a biological process (GO term) was overrepresented among GWAS associations was performed by means of a hypergeometric test with a cutoff P-value of 5 × 10⁻⁶. All P-values in these analyses were multiple testing corrected according to Hochberg and Benjamini (42).
Gene expression Data
We had access to whole blood gene expression data from 74 SSc patients, 17 SLE patients and 21 healthy controls (43); which were not included in the GWAS cohorts. None of the patients were treated with immunosuppressive agents (exception prednisone ≤5 mg or hydroxychloroquine). Blood samples for transcript studies were drawn directly into PAXgene tubes (PreAnalytiX, Franklin Lakes, NJ, USA). Total RNA was isolated according to the manufacturer's protocol using the PAXgene RNA kit (PreAnalytiX). The RNA quality and yield were assessed using a 2100 Bioanalyzer (Agilent, Palo Alto, CA, USA) and an ND-1000 Spectrophotometer (NanoDrop Technologies, Wilmington, DE, USA). Two hundred nanograms of total RNA were amplified and purified using the Illumina TotalPrep RNA Amplification kit (Applied Biosystems/Ambion, Austin, TX, USA) in accordance with the manufacturer's instructions. The amplified complementary RNA was hybridized on Illumina Human Ref-8 BeadChips, and the data were extracted with the Illumina Beadstudio software suite (Illumina, San Diego, CA, USA). A transcript was defined as differentially expressed when the significance level for comparison was P ≤ 0.05 and the FDR was ≤0.10 using a random-variance t-test.
SUPPLEMENTARY MATERIAL
FUNDING
This work was supported by the following grants: J.M. was funded by GEN-FER from the Spanish Society of Rheumatology, SAF2009-11110 and SAF2012-34435 from the Ministerio de Economia y Competitividad, CTS-4977 from Junta de Andalucía (Spain), Redes Temáticas de Investigación Cooperativa Sanitaria Program, RD08/0075 (RIER) from Instituto de Salud Carlos III (ISCIII, Spain), Fondo Europeo de Desarrollo Regional (FEDER) and the grant NIH NIAID 1U01AI09090-01. T.R.D.J.R. was funded by the VIDI laureate from the Dutch Association of Research (NWO) and Dutch Arthritis Foundation (National Reumafonds) and is an ERC starting grant Laureate 2011. J.M. and T.R.D.J.R. were sponsored by the Orphan Disease Program grant from the European League Against Rheumatism (EULAR). B.P.C.K. is supported by the Dutch Diabetes Research Foundation (grant 2008.40.001) and the Dutch Arthritis Foundation (Reumafonds, grant NR 09-1-408). S.A. and M.D.M. were supported by NIH/NIAMS Scleroderma Family Registry and DNA Repository (N01-AR-0-2251), NIH/NIAMS-RO1- AR055258, and NIH/NIAMS Center of Research Translation in Scleroderma (1P50AR054144), the Department of Defense Congressionally Directed Medical Research Programs (W81XWH-07-01-0111), and K23-AR-061436. M.E.A.R. was funded by the Instituto de Salud Carlos III partially through FEDER funds of the European Union (PS09/00129), la Consejería de Salud de Andalucía (PI0012), la Fundación Ramón Areces and the Swedish Research Council. M.E.A.R. is the Chairman of the BIOLUPUS network funded by the European Science Foundation. T.W. is funded by the grant KFO 250, TP03, WI 1031/6-1.
Supplementary Material
ACKNOWLEDGEMENTS
We thank Sofia Vargas, Sonia Garcia and Gema Robledo for their excellent technical assistance, and all the patients and healthy controls for kindly accepting their essential collaboration. We also thank the following organizations: the EULAR Scleroderma Trials and Research (EUSTAR), the German Network of Systemic Sclerosis and Banco Nacional de ADN (University of Salamanca, Spain).
REFERENCES
- 1.Terao C., Ohmura K., Ikari K., Kochi Y., Maruya E., Katayama M., Yurugi K., Shimada K., Murasawa A., Honjo S., et al. ACPA-negative RA consists of two genetically distinct subsets based on RF positivity in Japanese. PLoS One. 2012;7:e40067. doi: 10.1371/journal.pone.0040067. [DOI] [PMC free article] [PubMed] [Google Scholar]
- 2.Gorlova O., Martin J.E., Rueda B., Koeleman B.P., Ying J., Teruel M., Diaz-Gallo L.M., Broen J.C., Vonk M.C., Simeon C.P., et al. Identification of novel genetic markers associated with clinical phenotypes of systemic sclerosis through a genome-wide association strategy. PLoS Genet. 2011;7:e1002178. doi: 10.1371/journal.pgen.1002178. [DOI] [PMC free article] [PubMed] [Google Scholar]
- 3.Lundberg K., Bengtsson C., Kharlamova N., Reed E., Jiang X., Kallberg H., Pollak-Dorocic I., Israelsson L., Kessel C., Padyukov L., et al. Genetic and environmental determinants for disease risk in subsets of rheumatoid arthritis defined by the anticitrullinated protein/peptide antibody fine specificity profile. Ann. Rheum. Dis. 2012;72:652–658. doi: 10.1136/annrheumdis-2012-201484. [DOI] [PubMed] [Google Scholar]
- 4.Mackie S.L., Taylor J.C., Martin S.G., Wordsworth P., Steer S., Wilson A.G., Worthington J., Emery P., Barrett J.H., Morgan A.W. A spectrum of susceptibility to rheumatoid arthritis within HLA-DRB1: stratification by autoantibody status in a large UK population. Genes Immun. 2012;13:120–128. doi: 10.1038/gene.2011.60. [DOI] [PubMed] [Google Scholar]
- 5.de Vries R.R., van der Woude D., Houwing J.J., Toes R.E. Genetics of ACPA-positive rheumatoid arthritis: the beginning of the end? Ann. Rheum. Dis. 2011;70:i51–54. doi: 10.1136/ard.2010.138040. [DOI] [PubMed] [Google Scholar]
- 6.Padyukov L., Seielstad M., Ong R.T., Ding B., Ronnelid J., Seddighzadeh M., Alfredsson L., Klareskog L. A genome-wide association study suggests contrasting associations in ACPA-positive versus ACPA-negative rheumatoid arthritis. Ann. Rheum. Dis. 2011;70:259–265. doi: 10.1136/ard.2009.126821. [DOI] [PMC free article] [PubMed] [Google Scholar]
- 7.Sanchez E., Nadig A., Richardson B.C., Freedman B.I., Kaufman K.M., Kelly J.A., Niewold T.B., Kamen D.L., Gilkeson G.S., Ziegler J.T., et al. Phenotypic associations of genetic susceptibility loci in systemic lupus erythematosus. Ann. Rheum. Dis. 2011;70:1752–1757. doi: 10.1136/ard.2011.154104. [DOI] [PMC free article] [PubMed] [Google Scholar]
- 8.Chung S.A., Taylor K.E., Graham R.R., Nititham J., Lee A.T., Ortmann W.A., Jacob C.O., Alarcon-Riquelme M.E., Tsao B.P., Harley J.B., et al. Differential genetic associations for systemic lupus erythematosus based on anti-dsDNA autoantibody production. PLoS Genet. 2011;7:e1001323. doi: 10.1371/journal.pgen.1001323. [DOI] [PMC free article] [PubMed] [Google Scholar]
- 9.Cho J.H., Gregersen P.K. Genomics and the multifactorial nature of human autoimmune disease. N. Engl. J. Med. 2011;365:1612–1623. doi: 10.1056/NEJMra1100030. [DOI] [PubMed] [Google Scholar]
- 10.Festen E.A., Goyette P., Green T., Boucher G., Beauchamp C., Trynka G., Dubois P.C., Lagace C., Stokkers P.C., Hommes D.W., et al. A meta-analysis of genome-wide association scans identifies IL18RAP, PTPN2, TAGAP, and PUS10 as shared risk loci for Crohn's disease and celiac disease. PLoS Genet. 2011;7:e1001283. doi: 10.1371/journal.pgen.1001283. [DOI] [PMC free article] [PubMed] [Google Scholar]
- 11.Zhernakova A., Stahl E.A., Trynka G., Raychaudhuri S., Festen E.A., Franke L., Westra H.J., Fehrmann R.S., Kurreeman F.A., Thomson B., et al. Meta-analysis of genome-wide association studies in celiac disease and rheumatoid arthritis identifies fourteen non-HLA shared loci. PLoS Genet. 2011;7:e1002004. doi: 10.1371/journal.pgen.1002004. [DOI] [PMC free article] [PubMed] [Google Scholar]
- 12.Ellinghaus D., Ellinghaus E., Nair R.P., Stuart P.E., Esko T., Metspalu A., Debrus S., Raelson J.V., Tejasvi T., Belouchi M., et al. Combined analysis of genome-wide association studies for Crohn disease and psoriasis identifies seven shared susceptibility loci. Am. J. Hum. Genet. 2012;90:636–647. doi: 10.1016/j.ajhg.2012.02.020. [DOI] [PMC free article] [PubMed] [Google Scholar]
- 13.Martin J.E., Bossini-Castillo L., Martin J. Unraveling the genetic component of systemic sclerosis. Hum. Genet. 2012;131:1023–1037. doi: 10.1007/s00439-011-1137-z. [DOI] [PubMed] [Google Scholar]
- 14.Delgado-Vega A., Sanchez E., Lofgren S., Castillejo-Lopez C., Alarcon-Riquelme M.E. Recent findings on genetics of systemic autoimmune diseases. Curr. Opin. Immunol. 2010;22:698–705. doi: 10.1016/j.coi.2010.09.002. [DOI] [PMC free article] [PubMed] [Google Scholar]
- 15.Harley J.B., Alarcon-Riquelme M.E., Criswell L.A., Jacob C.O., Kimberly R.P., Moser K.L., Tsao B.P., Vyse T.J., Langefeld C.D., Nath S.K., et al. Genome-wide association scan in women with systemic lupus erythematosus identifies susceptibility variants in ITGAM, PXK, KIAA1542 and other loci. Nat. Genet. 2008;40:204–210. doi: 10.1038/ng.81. [DOI] [PMC free article] [PubMed] [Google Scholar]
- 16.Radstake T.R., Gorlova O., Rueda B., Martin J.E., Alizadeh B.Z., Palomino-Morales R., Coenen M.J., Vonk M.C., Voskuyl A.E., Schuerwegh A.J., et al. Genome-wide association study of systemic sclerosis identifies CD247 as a new susceptibility locus. Nat Genet. 2010;42:426–429. doi: 10.1038/ng.565. [DOI] [PMC free article] [PubMed] [Google Scholar]
- 17.Poelmans G., Buitelaar J.K., Pauls D.L., Franke B. A theoretical molecular network for dyslexia: integrating available genetic findings. Mol Psychiatry. 2011;16:365–382. doi: 10.1038/mp.2010.105. [DOI] [PubMed] [Google Scholar]
- 18.Bycroft M., Bateman A., Clarke J., Hamill S.J., Sandford R., Thomas R.L., Chothia C. The structure of a PKD domain from polycystin-1: implications for polycystic kidney disease. EMBO J. 1999;18:297–305. doi: 10.1093/emboj/18.2.297. [DOI] [PMC free article] [PubMed] [Google Scholar]
- 19.Gateva V., Sandling J.K., Hom G., Taylor K.E., Chung S.A., Sun X., Ortmann W., Kosoy R., Ferreira R.C., Nordmark G., et al. A large-scale replication study identifies TNIP1, PRDM1, JAZF1, UHRF1BP1 and IL10 as risk loci for systemic lupus erythematosus. Nat. Genet. 2009;41:1228–1233. doi: 10.1038/ng.468. [DOI] [PMC free article] [PubMed] [Google Scholar]
- 20.Takeuchi H., Takeuchi T., Gao J., Cantley L.C., Hirata M. Characterization of PXK as a protein involved in epidermal growth factor receptor trafficking. Mol. Cell. Biol. 2010;30:1689–1702. doi: 10.1128/MCB.01105-09. [DOI] [PMC free article] [PubMed] [Google Scholar]
- 21.Yu B., Wu Q., Chen Y., Li P., Shao Y., Zhang J., Zhong Q., Peng X., Yang H., Hu X., et al. Polymorphisms of PXK are associated with autoantibody production, but not disease risk, of systemic lupus erythematosus in Chinese mainland population. Lupus. 2011;20:23–27. doi: 10.1177/0961203310378671. [DOI] [PubMed] [Google Scholar]
- 22.Soranzo N., Rivadeneira F., Chinappen-Horsley U., Malkina I., Richards J.B., Hammond N., Stolk L., Nica A., Inouye M., Hofman A., et al. Meta-analysis of genome-wide scans for human adult stature identifies novel loci and associations with measures of skeletal frame size. PLoS Genet. 2009;5:e1000445. doi: 10.1371/journal.pgen.1000445. [DOI] [PMC free article] [PubMed] [Google Scholar]
- 23.Johansson A., Marroni F., Hayward C., Franklin C.S., Kirichenko A.V., Jonasson I., Hicks A.A., Vitart V., Isaacs A., Axenovich T., et al. Common variants in the JAZF1 gene associated with height identified by linkage and genome-wide association analysis. Hum. Mol. Genet. 2009;18:373–380. doi: 10.1093/hmg/ddn350. [DOI] [PMC free article] [PubMed] [Google Scholar]
- 24.Martin J.E., Broen J.C., Carmona F.D., Teruel M., Simeon C.P., Vonk M.C., van 't Slot R., Rodriguez-Rodriguez L., Vicente E., Fonollosa V., et al. Identification of CSK as a systemic sclerosis genetic risk factor through genome wide association study follow-up. Hum. Mol. Genet. 2012;21:2825–2835. doi: 10.1093/hmg/dds099. [DOI] [PMC free article] [PubMed] [Google Scholar]
- 25.Skhirtladze C., Distler O., Dees C., Akhmetshina A., Busch N., Venalis P., Zwerina J., Spriewald B., Pileckyte M., Schett G., et al. Src kinases in systemic sclerosis: central roles in fibroblast activation and in skin fibrosis. Arthritis Rheum. 2008;58:1475–1484. doi: 10.1002/art.23436. [DOI] [PubMed] [Google Scholar]
- 26.Fietta P., Delsante G. Psychiatric and neuropsychological manifestations of systemic lupus erythematosus. Acta Biomed. 2011;82:97–114. [PubMed] [Google Scholar]
- 27.Bertsias G.K., Ioannidis J.P., Aringer M., Bollen E., Bombardieri S., Bruce I.N., Cervera R., Dalakas M., Doria A., Hanly J.G., et al. EULAR Recommendations for the management of systemic lupus erythematosus with neuropsychiatric manifestations: report of a task force of the EULAR standing committee for clinical affairs. Ann. Rheum. Dis. 2010;69:2074–2082. doi: 10.1136/ard.2010.130476. [DOI] [PubMed] [Google Scholar]
- 28.Baubet T., Ranque B., Taieb O., Berezne A., Bricou O., Mehallel S., Moroni C., Belin C., Pagnoux C., Moro M.R., et al. Mood and anxiety disorders in systemic sclerosis patients. Presse Med. 2011;40:e111–e119. doi: 10.1016/j.lpm.2010.09.019. [DOI] [PubMed] [Google Scholar]
- 29.Efthimiou P., Blanco M. Pathogenesis of neuropsychiatric systemic lupus erythematosus and potential biomarkers. Mod. Rheumatol. 2009;19:457–468. doi: 10.1007/s10165-009-0198-5. [DOI] [PubMed] [Google Scholar]
- 30.Sofat N., Malik O., Higgens C.S. Neurological involvement in patients with rheumatic disease. QJM. 2006;99:69–79. doi: 10.1093/qjmed/hcl005. [DOI] [PubMed] [Google Scholar]
- 31.Manetti M., Guiducci S., Romano E., Rosa I., Ceccarelli C., Mello T., Milia A.F., Conforti M.L., Ibba-Manneschi L., Matucci-Cerinic M. Differential expression of junctional adhesion molecules in different stages of systemic sclerosis. Arthritis Rheum. 2013;65:247–257. doi: 10.1002/art.37712. [DOI] [PubMed] [Google Scholar]
- 32.Yoshizaki A., Yanaba K., Iwata Y., Komura K., Ogawa A., Akiyama Y., Muroi E., Hara T., Ogawa F., Takenaka M., et al. Cell adhesion molecules regulate fibrotic process via Th1/Th2/Th17 cell balance in a bleomycin-induced scleroderma model. J. Immunol. 2010;185:2502–2515. doi: 10.4049/jimmunol.0901778. [DOI] [PMC free article] [PubMed] [Google Scholar]
- 33.Rabquer B.J., Hou Y., Del Galdo F., Kenneth Haines G., 3rd., Gerber M.L., Jimenez S.A., Seibold J.R., Koch A.E. The proadhesive phenotype of systemic sclerosis skin promotes myeloid cell adhesion via ICAM-1 and VCAM-1. Rheumatology (Oxford) 2009;48:734–740. doi: 10.1093/rheumatology/kep091. [DOI] [PMC free article] [PubMed] [Google Scholar]
- 34.Raychaudhuri S., Plenge R.M., Rossin E.J., Ng A.C., Purcell S.M., Sklar P., Scolnick E.M., Xavier R.J., Altshuler D., Daly M.J. Identifying relationships among genomic disease regions: predicting genes at pathogenic SNP associations and rare deletions. PLoS Genet. 2009;5:e1000534. doi: 10.1371/journal.pgen.1000534. [DOI] [PMC free article] [PubMed] [Google Scholar]
- 35.Preliminary criteria for the classification of systemic sclerosis (scleroderma). subcommittee for scleroderma criteria of the American Rheumatism Association Diagnostic and Therapeutic Criteria Committee. Arthritis Rheum. 1980;23:581–590. doi: 10.1002/art.1780230510. [DOI] [PubMed] [Google Scholar]
- 36.LeRoy E.C., Black C., Fleischmajer R., Jablonska S., Krieg T., Medsger T.A., Jr., Rowell N., Wollheim F. Scleroderma (systemic sclerosis): classification, subsets and pathogenesis. J. Rheumatol. 1988;15:202–205. [PubMed] [Google Scholar]
- 37.LeRoy E.C., Medsger T.A., Jr. Criteria for the classification of early systemic sclerosis. J. Rheumatol. 2001;28:1573–1576. [PubMed] [Google Scholar]
- 38.Hochberg M.C. Updating the American College of Rheumatology revised criteria for the classification of systemic lupus erythematosus. Arthritis Rheum. 1997;40:1725. doi: 10.1002/art.1780400928. [DOI] [PubMed] [Google Scholar]
- 39.Skol A.D., Scott L.J., Abecasis G.R., Boehnke M. Joint analysis is more efficient than replication-based analysis for two-stage genome-wide association studies. Nat. Genet. 2006;38:209–213. doi: 10.1038/ng1706. [DOI] [PubMed] [Google Scholar]
- 40.Purcell S., Neale B., Todd-Brown K., Thomas L., Ferreira M.A., Bender D., Maller J., Sklar P., de Bakker P.I., Daly M.J., et al. PLINK: a tool set for whole-genome association and population-based linkage analyses. Am. J. Hum. Genet. 2007;81:559–575. doi: 10.1086/519795. [DOI] [PMC free article] [PubMed] [Google Scholar]
- 41.Zhang B., Kirov S., Snoddy J. Webgestalt: an integrated system for exploring gene sets in various biological contexts. Nucleic Acids Res. 2005;33:W741–W748. doi: 10.1093/nar/gki475. [DOI] [PMC free article] [PubMed] [Google Scholar]
- 42.Hochberg Y., Benjamini Y. More powerful procedures for multiple significance testing. Stat. Med. 1990;9:811–818. doi: 10.1002/sim.4780090710. [DOI] [PubMed] [Google Scholar]
- 43.Assassi S., Mayes M.D., Arnett F.C., Gourh P., Agarwal S.K., McNearney T.A., Chaussabel D., Oommen N., Fischbach M., Shah K.R., et al. Systemic sclerosis and lupus: points in an interferon-mediated continuum. Arthritis Rheum. 2010;62:589–598. doi: 10.1002/art.27224. [DOI] [PMC free article] [PubMed] [Google Scholar]
Associated Data
This section collects any data citations, data availability statements, or supplementary materials included in this article.