Abstract
In studying the molecular basis for the potent immune activity of previously described gamma and delta inulin particles and to assist in production of inulin adjuvants under Good Manufacturing Practice, we identified five new inulin isoforms, bringing the total to seven plus the amorphous form. These isoforms comprise the step-wise inulin developmental series amorphous → alpha-1 (AI-1) → alpha-2 (AI-2) → gamma (GI) → delta (DI) → zeta (ZI) → epsilon (EI) → omega (OI) in which each higher isoform can be made either by precipitating dissolved inulin or by direct conversion from its precursor, both cases using regularly increasing temperatures. At higher temperatures, the shorter inulin polymer chains are released from the particle and so the key difference between isoforms is that each higher isoform comprises longer polymer chains than its precursor. An increasing trend of degree of polymerization is confirmed by end-group analysis using 1H nuclear magnetic resonance spectroscopy. Inulin isoforms were characterized by the critical temperatures of abrupt phase-shifts (solubilizations or precipitations) in water suspensions. Such (aqueous) “melting” or “freezing” points are diagnostic and occur in strikingly periodic steps reflecting quantal increases in noncovalent bonding strength and increments in average polymer lengths. The (dry) melting points as measured by modulated differential scanning calorimetry similarly increase in regular steps. We conclude that the isoforms differ in repeated increments of a precisely repeating structural element. Each isoform has a different spectrum of biological activities and we show the higher inulin isoforms to be more potent alternative complement pathway activators.
Keywords: adjuvant, carbohydrate, inulin, isoform, vaccine
Introduction
Micro-particulate inulin (MPI) was originally developed (Cooper and Carter 1986a) as an anti-cancer therapeutic based on the premise that in vivo alternative pathway complement activation may have anti-tumor effects (Cooper and Masinello 1983; Cooper and Sim 1984; Cooper 1985). The first therapeutic isoform (gamma inulin (GI)) was followed by the more active delta inulin (DI), which is the clinically preferred option (Cooper and Petrovsky 2011). The biological significance of these newer, relatively insoluble inulin forms, in contrast to the more soluble alpha and beta isoforms, is their clinical utility as potent, safe and well-tolerated immune modulators, most notably as vaccine adjuvants (Cooper and Steele 1988; Cooper et al. 1991; Frazer et al. 1999; Silva et al. 2004; Lobigs et al. 2010; Cooper and Petrovsky 2011; Cristillo et al. 2011; Layton et al. 2011; Gordon et al. 2012; Honda-Okubo et al. 2012; Larena et al. 2013; Saade et al. 2013) but also with anti-cancer effects (Cooper and Carter 1986b; Cooper 1993; Korbelik and Cooper 2007). DI is also a useful reagent for exploring and regulating cellular immune functions in vitro and in vivo. Unusually, for a vaccine adjuvant, DI is exceptionally well tolerated, which may reflect its ability to enhance adaptive immune responses through a novel and as yet uncharacterized, noninflammatory immune pathway (Honda-Okubo et al. 2012).
Such useful immunological activities are related to the structure of the MPI particles, as they are not shared by soluble inulin forms. This distinguishes inulin adjuvants from certain other carbohydrates with immune adjuvant activity such as mannan, dextran and glucan, which have immunological activity in their soluble form (Petrovsky and Cooper 2011). Carbohydrates show widespread polymorphism in line with their huge structural diversity, for example, sorbitol (Nezzal et al. 2009), starch and amylose (Sarko and Wu 1978; Shamai et al. 2003; Perez and Bertoft 2010) all assume widely different polymorphic forms, which like most carbohydrates and particularly polysaccharides are semi-crystalline in nature. Inulin is a versatile polysaccharide (Barclay et al. 2010) with its own brand of polymorphism, which has been slow to be deciphered. Commercial plant-derived inulin preparations consist of neutral, inert polysaccharides of simple, known structure comprising a family of polydisperse, linear β-d-(2 → 1) poly(fructo-furanosyl) α-d-glucose chains. The chains may contain up to 100 or more furanose units linked to a single terminal glucose and have a relatively hydrophobic, polyoxyethylene-like backbone. It may be this unusual, nonionized secondary structure that allows inulin solutions to precipitate readily as tertiary particulate forms (MPI), which then acquire immunological activity.
We initially supposed that inulin isoforms of higher degree of polymerization (DP) would simply involve more inter-polymer noncovalent bonds as their DP increased, implying that MPI should form a continuous series with each additional fructose. Unexpectedly, we did not find such a continuous series but instead a spontaneous assembly in distinct steps, each producing a new, more heat-stable variant with specific properties relating to noncovalent bonding strength. This was first recognized with discovery of GI, which was sharply demarcated (Cooper and Steele 1991) and distinct from the poorly characterizable alpha inulin (AI). GI only formed from higher DP fractions isolated by gel exclusion chromatography (Cooper and Carter 1986a), so that the “higher” GI variant did indeed comprise longer polymer chains than AI, and DI had analogous higher DP properties (Cooper and Petrovsky 2011).
Thus, MPI takes a limited number of different forms (glycomic phenotypes) characterizable by substantial differences in strength of noncovalent interactions. Crucially, these discrete physical properties occur in regular steps and are acquired spontaneously. As we shall show, these can be true polymorphic forms of identical chemical composition but of different internal structure. Curiously, the same inulin phenotypes may be assumed by MPI of different but analogous make-up, specifically of different ranges of DP: These are termed isoforms and are the usual presentation of inulin polymorphic forms.
We report here seven polymorphs/isoforms of inulin as a first step in understanding their structure and hence biological function. The whole range of available DP is covered, revealing five new isoforms (alpha inulin-1, alpha inulin-2, zeta, epsilon and omega inulins) and giving the evidence for their discrete, step-wise nature. We can now see an apparently complete developmental series: Amorphous inulin → AI-1 → AI-2 → GI → DI → ZI → EI → OI, in which each isoform may be converted in to, or re-precipitated as, the next higher isoform accompanied by release of a lower DP fraction. We finally show that the new inulin isoforms may foreshadow a novel spectrum of biological activities.
Results
Isoform format
The usual format of an inulin isoform has the glycomic phenotype (observable characteristics) of that isoform but retains a glycotype (glycomic make-up) that can be converted into, or re-precipitate as, higher isoforms with solubilization of glycotypes that can only make lower isoforms. This format, therefore, includes the entire range of higher DP and is referred to here as a “plus-format” isoform. The soluble inulin released after precipitation of, or heat conversion to, that format similarly contains the entire range of lower DP and is referred to as a “sub-format” isoform.
Formation of isoforms: Direct and freeze–thaw precipitation
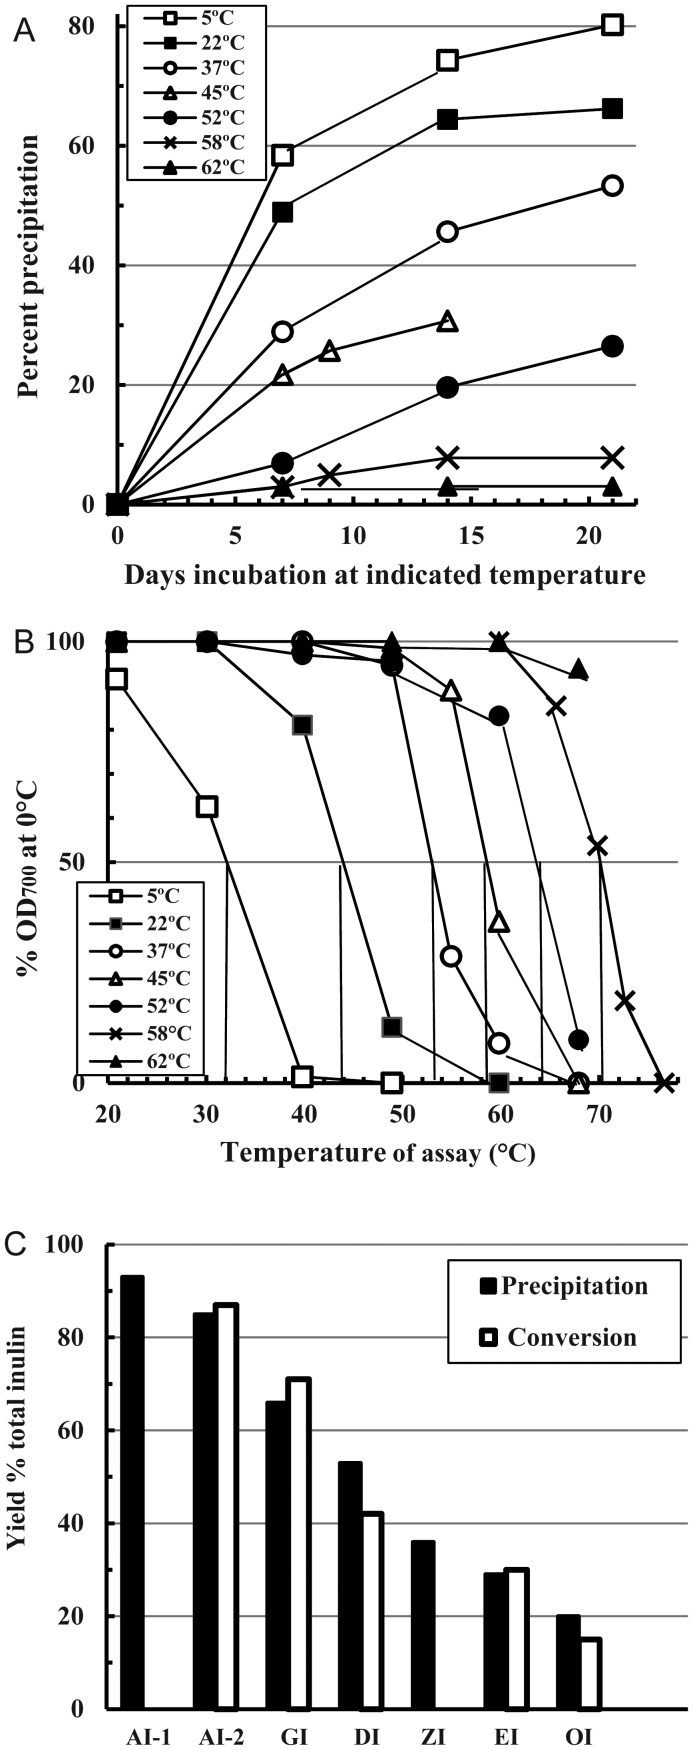
Each inulin isoform may be directly precipitated in characteristic plus-format by standing or stirring fresh hot inulin solutions of appropriate DP in particular temperatures ranges spanning up to 10°C, taking 2–4 weeks to reach a constant equilibrium. One such run (Figure 1A) shows rates of precipitation and yields at each temperature from the filtered raw material (FRM) solution (Methods), while Figure 1B shows the optical density measured at 700 nm (OD700)/temperature curves of each final inulin suspension. These curves are interpreted in Table I. Higher temperatures yielded higher isoforms together with larger amounts of inulin left in solution, so that each higher isoform was regularly obtained in lesser yield than its precursor. This was true for all isolation methods (Figure 1C); some yield of the 62°C product (OI, the same isoform as the 58°C product) is probably lost by hydrolysis. The supernatants (sub-formats) of this first precipitation were themselves re-precipitated at 5°C and the deposits each heat-converted (see next section) in to the highest isoform possible (Table I). This second deposit consistently only achieved a lower isoform than the first, monitoring 50% OD700 thermal transition points (Table I; full curves not shown). However, this lower-isoform deposit usually contained some 5–10% of the higher isoform, so that precipitation to constant supernatant refractive index (RI) does not necessarily precipitate that glycotype completely.
Fig. 1.
Direct precipitation of inulin solutions. Aliquots of a fresh hot solution of FRM (100 mg/mL) were stood at the indicated temperatures (A, B inset) for 3 weeks, after which the supernatant RI did not decrease further. (A) Precipitated yields calculated from supernatant RIs measured at intervals. (B) OD700 thermal transition curves of samples of the fresh, final, untreated suspensions diluted directly into 5 mL PBS (0.5 mg particulate inulin/mL). Tubes were progressively heated and the OD700 of each measured after equilibration at each indicated temperature. (C) Averages of yields of the isoforms AI-1, AI-2, GI, DI, ZI, EI and OI obtained from conversion or precipitation of the FRM.
Table I.
The summary of results from the experiment of Figure 1A and Ba
| Starting material | Properties of deposit | Temperature of precipitation (°C) |
||||||
|---|---|---|---|---|---|---|---|---|
| 5 | 20 | 37 | 45 | 52 | 58 | 62 | ||
| Original FRM | Yield (% FRM)b | 80 | 66 | 53 | 35 | 26 | 8 | 3 |
| T °Cc | 32 | 44 | 54 | 59 | 64 | 70.5 | >70 | |
| Major isoform type | AI-2 | GI | DI | ZI | EI | OI | OI | |
| Supernatantsd | Tc | – | 32 | 45 | 53 | 58 | ND | 65 |
| Major isoform type | – | AI-2 | GI | DI | ZI | ND | EI | |
aThe separated final supernatants of Figure 1A were freeze–thaw precipitated at 5°C, when the concentrated deposits were heat-converted as in Figure 2 to reveal their highest isoform potential (see footnote d).
bFrom Figure 1A.
d5°C deposit from supernatants after maximum conversion: Tc = 50% OD700 transition T°C of converted 5°C deposit.
The isoform that is actually precipitated at a given temperature is dictated by the majority DP able to do so (Table I). Thus, if the full range of DP is used such as in the original FRM, then say 22°C deposits GI, while if the higher DP material is first removed (sub-format inulin), then 22°C yields only AI. The converse repeats with all higher isoforms when dissolved and re-precipitated at lower temperatures (see “Reversibility of isoforms” section), where particular phenotypes form at temperatures much lower than needed for the FRM.
Precipitation is accelerated and hydrolysis minimized by freezing and then thawing at the temperatures of Figure 1 (3–5 days to constant supernatant RI). This immediately deposits a thick cloud of fine nuclei when full precipitation rapidly follows. Products and yields (data not shown) are similar to Figure 1 but the temperatures yielding a given isoform are higher, falling in the lower part of its conversion range (next Section). Direct precipitation at 22°C, say, produces GI, whereas freeze–thaw requires 37°C to produce GI. In the first minutes of warming, the proto-particles will be converted rapidly through the isoform series in to the isoform permitted by the end temperature while releasing lower DP inulin. However, as with direct precipitation, freeze–thaw does not completely remove the precipitated glycotype.
Formation of isoforms: Heat conversion
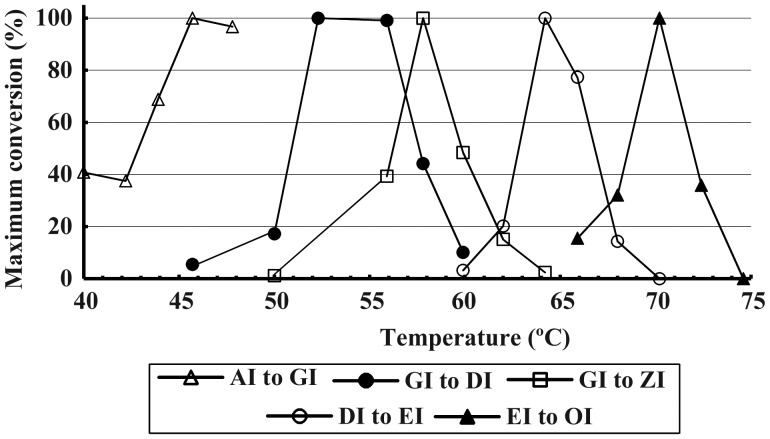
Each isoform can be made from its precursor by heat conversion in a specific temperature range (Figure 2, Table II). This resembles a snap re-crystallization from saturated solution at the higher temperature and is much faster than direct or freeze–thaw precipitation. As with those methods, conversion yields become progressively less (Figure 1C), while the released inulin can form only lower isoforms.
Fig. 2.
Optimum temperatures of conversion of inulin isoforms from their precursors in the series. Portions of lots of the isoforms AI, GI, DI or EI (50 mg/mL) were heated for 20 min at various temperatures, when samples were diluted to 0.5 mg/mL in 5 mL PBS for measurement of product OD700 after heating all for 10 min at 37°C for GI, 50°C for DI, 55°C for ZI, 60°C for EI or 68°C for OI.
Table II.
Significant temperatures for the plus-format isoforms
| Isoform | AI-1 | AI-2 | GI | DI | ZI | EI | OI |
|---|---|---|---|---|---|---|---|
| TcRI (extrapolation) °C ± SDa | 24.3 ± 1.1 | 34.0 ± 0.67 | 44.8 ± 0.72 | 52.8 ± 0.34 | 57.7 ± 0.6 | 64.2 ± 0.52 | 71.0 ± 0.47 |
| Conversion Tc °Cb | – | – | 45.0 | 53.0 | 58.0 | 64.5 | 70.0 |
| TcOD °Cc | 23.0 | 34.0 | 45.0 | 52.5 | 57.0 | 65.0 | 72.0 |
| Assay T°C (OD700) to distinguish from next lowerd | 20.0 | 28.0 | 41.0 | 49.0 | 55.0 | 60.0 | 68.0 |
| Convenient annealing T°C | ∼20 | ∼20 | ∼37 | ∼37 | ∼37 | ∼50 | ∼50 |
Kinetics of conversion
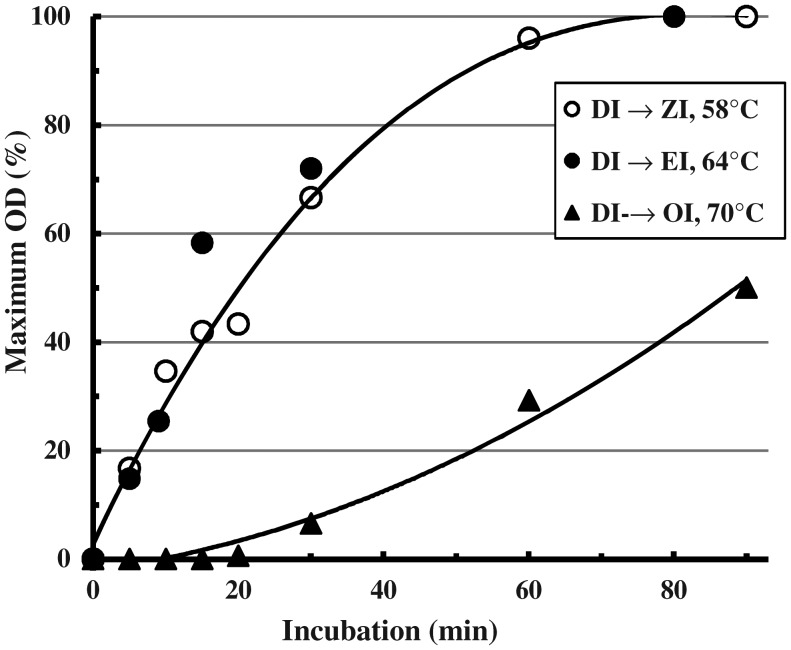
The rates of conversion of AI-2 to GI and of GI to DI at optimal temperatures were very similar (Cooper and Petrovsky 2011) with half-time 10–15 min and complete in 80–90 min. Direct conversion of AI-2 to DI was much slower. At their optimal temperatures (Figure 2) the higher isoforms have the same rates (DI to ZI and to EI, Figure 3), while DI to OI was much slower. Thus, in converting up the series, it is best to use one or two isoform steps at a time.
Fig. 3.
Rates of heat conversion among the higher isoforms. Replicate 1 mL lots of a DI preparation (100 mg/mL) in glass tubes were heated at 58°C, 64°C or 70°C for the indicated times then plunged in ice. When the tests were completed, equal aliquots were diluted identically in PBS and the OD700 measured after 10 min at 55°C, 60°C or 68°C, respectively, for assay of the isoforms ZI, EI or OI. Values are expressed as a percentage of the OD700 reached after 3 h incubation.
Characterization of isoforms: Critical temperature
As detailed next, each isoform is defined by its aqueous melting point (MP): the critical temperature (Tc) at which aqueous phase-shift (solution) commences; the Tc dominates all aspects of aqueous properties of the isoforms. As usual with organic chemicals, isoforms are in essence purified by re-precipitation or conversion plus hot-washing to constant Tc.
Extrapolation temperature
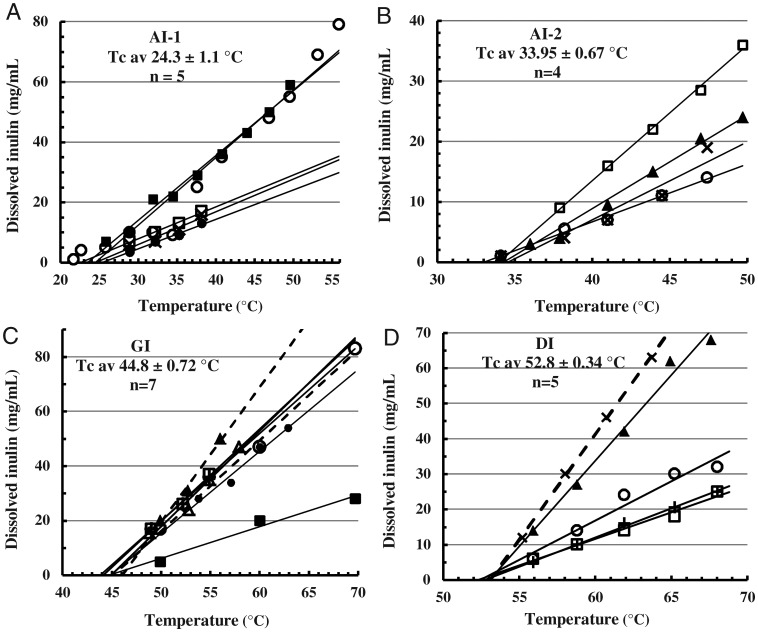
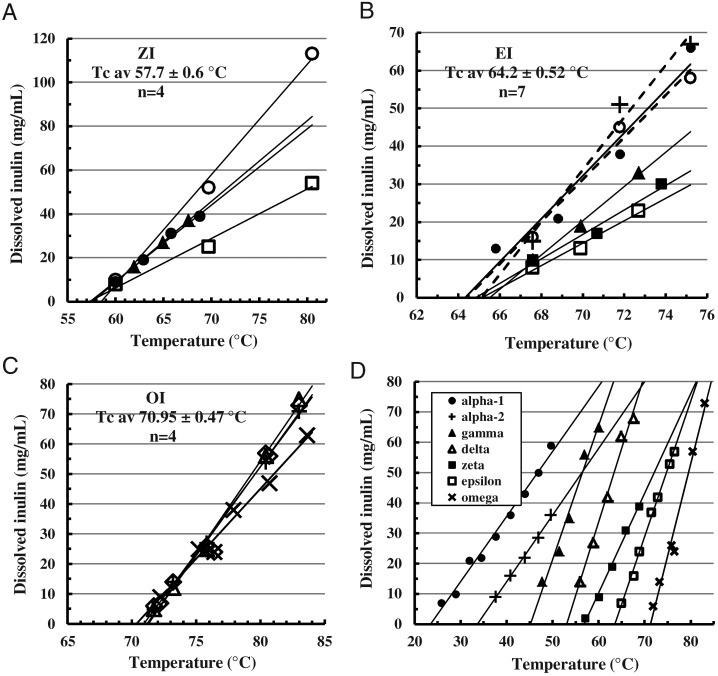
An accurate estimate of the Tc is as the extrapolation point of thermal solubility curves of >20 mg MPI/mL, measuring inulin dissolved by supernatant RI (TcRI, Figures 4 and 5). At each Tc the noncovalent bonding that maintains MPI structure becomes equal to thermal forces tending to disrupt it, so that dissolution only begins when the Tc is exceeded. On heating, equilibrium-saturated solutions are reached rapidly and the saturation concentrations increase linearly with temperature (Cooper and Petrovsky 2011); MPI concentration has little influence. Non-subjective linear trend-lines (MS Excel 2007™) are extrapolated to zero dissolved inulin to obtain the Tc. The Tc of different lots of a given isoform all cluster within 1°C, although the lines' slopes vary somewhat possibly due to small effects of concentration and particle size. Figure 5D selects typical lines near the mean of each isoform to illustrate their relation and spacing and confirm linearity. Table II lists the mean Tc of each isoform from this method.
Fig. 4.
Temperature solubility curves of inulin isoforms: Determination of the critical temperature (Tc). Several (n) lots of the different isoforms (A) AI-1, (B) AI-2, (C) GI and (D) DI had been precipitated or heat-converted and hot-washed from the FRM (Methods) to constant Tc and 50% OD700 transition points. Sealed Eppendorf centrifuge tubes containing 0.5 mL suspensions of these purified preparations were fully immersed in water baths at the indicated temperatures for 15 min and then centrifuged (4 min, 18,000 × g) to measure supernatant RI. The lines depicted are the linear trend-lines created by the application (MS Excel 2007™) extrapolated to zero supernatant content. Labels show isoform type and mean Tc ± standard deviation (SD). Laboratory identification labels for individual lots are omitted.
Fig. 5.
Temperature solubility curves and Tc values of inulin isoforms as for Figure 4. (A) ZI, (B) EI, (C) OI and (D) Comparison of solubility curves of all inulin isoforms selected from Figures 4 and 5A–C as typical for the isoform type.
Turbidimetric characterization of isoforms
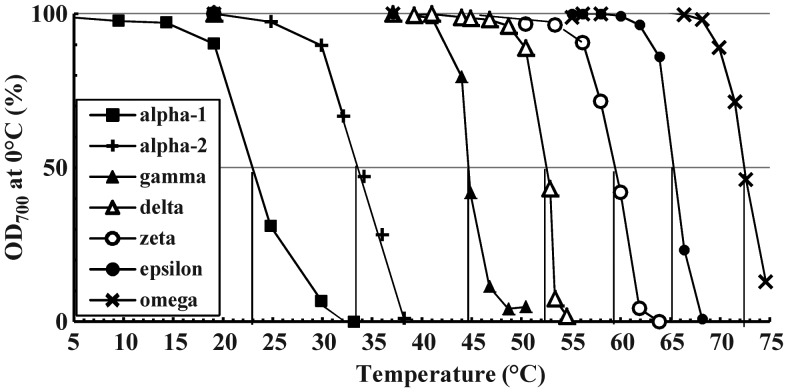
The 50% OD700 thermal transition points, measuring the temperatures at which the OD700 of <2 mg/mL MPI suspensions drops to 50% of a starting value (usually OD700 at 20°C), are an alternative measure of the Tc (TcOD). The GI and DI isoforms were originally identified this way (Cooper and Carter 1986a; Cooper and Steele 1991; Cooper and Petrovsky 2011). These parameters reflect an abrupt solubility phase-shift over a small and specific temperature range: They are (aqueous) MPs and equally diagnostic. All isoforms have the same type of OD700 transition curves (Figure 6, examples selected as for Figure 5D), and the 50% OD700 points cluster like the solubility extrapolation points (data not shown); mean values in Table II.
Fig. 6.
Comparison of OD700 thermal transition curves of typical preparations of all inulin isoforms, prepared as for Figure 4. Dilutions in PBS at 0.5 mg/mL were progressively heated and the OD700 of each measured after equilibration at each indicated temperature.
As exploited for GI and DI previously, these curves can differentiate various isoforms present in mixed preparations. There is a differentiation temperature between adjacent isoforms at which the OD700 of the lower isoform is <5%, and the next higher is >95%, of initial OD700 values (Table II). Comparison of the OD700 at these temperatures estimates the phenotype make-up of an unknown MPI lot.
Periodicity of the Tc values
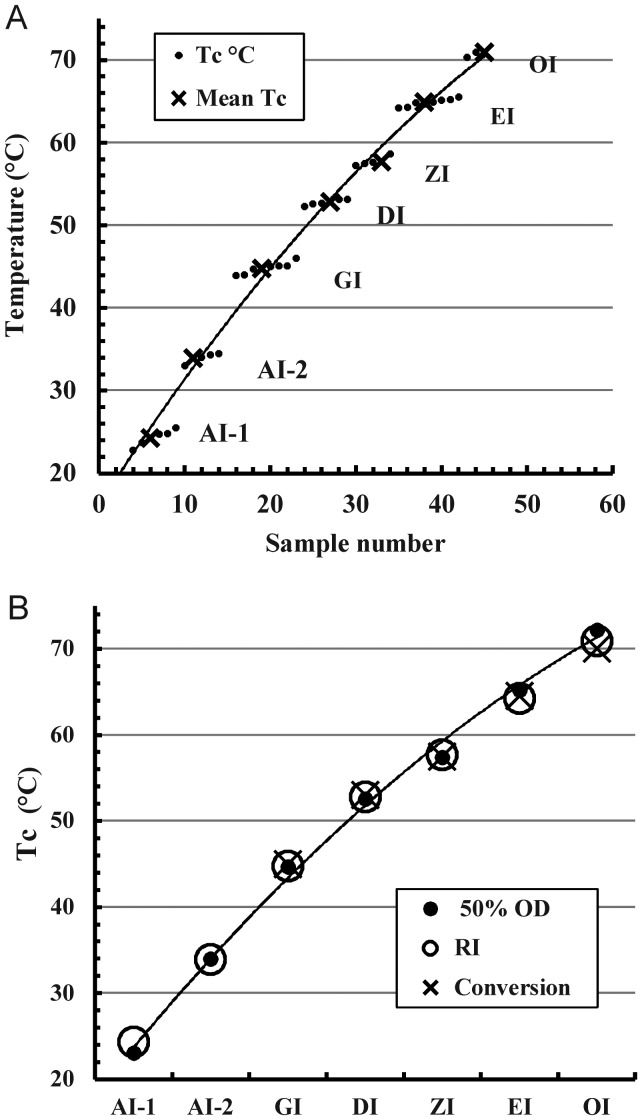
A recurring feature of the inulin isoforms is a periodically repeating property (Figure 7). This is especially noticeable in Figure 7A (the close clustering of the solubility extrapolation Tc points of a given isoform and their lack of overlap). The step-wise nature of the progression is emphasized. All the Tc data of an isoform (Tc means obtained from the solubility, 50% OD700 transition and conversion temperatures of Table II) are closely comparable (Figure 7B).
Fig. 7.
Relation between inulin isoform type and determinations of the Tc. (A) A plot of all solubility extrapolation Tc values of Figures 4 and 5 and the isoform averages in order of increasing value, illustrating the step-wise clustering effect and lack of overlap between clusters. (B) A plot of Tc values by solubility extrapolation (RI), 50% OD700 thermal transition points (50% OD700) and thermal conversion optima (Conversion) against isoform type. Polynomial trend lines are included.
Reversibility of isoforms
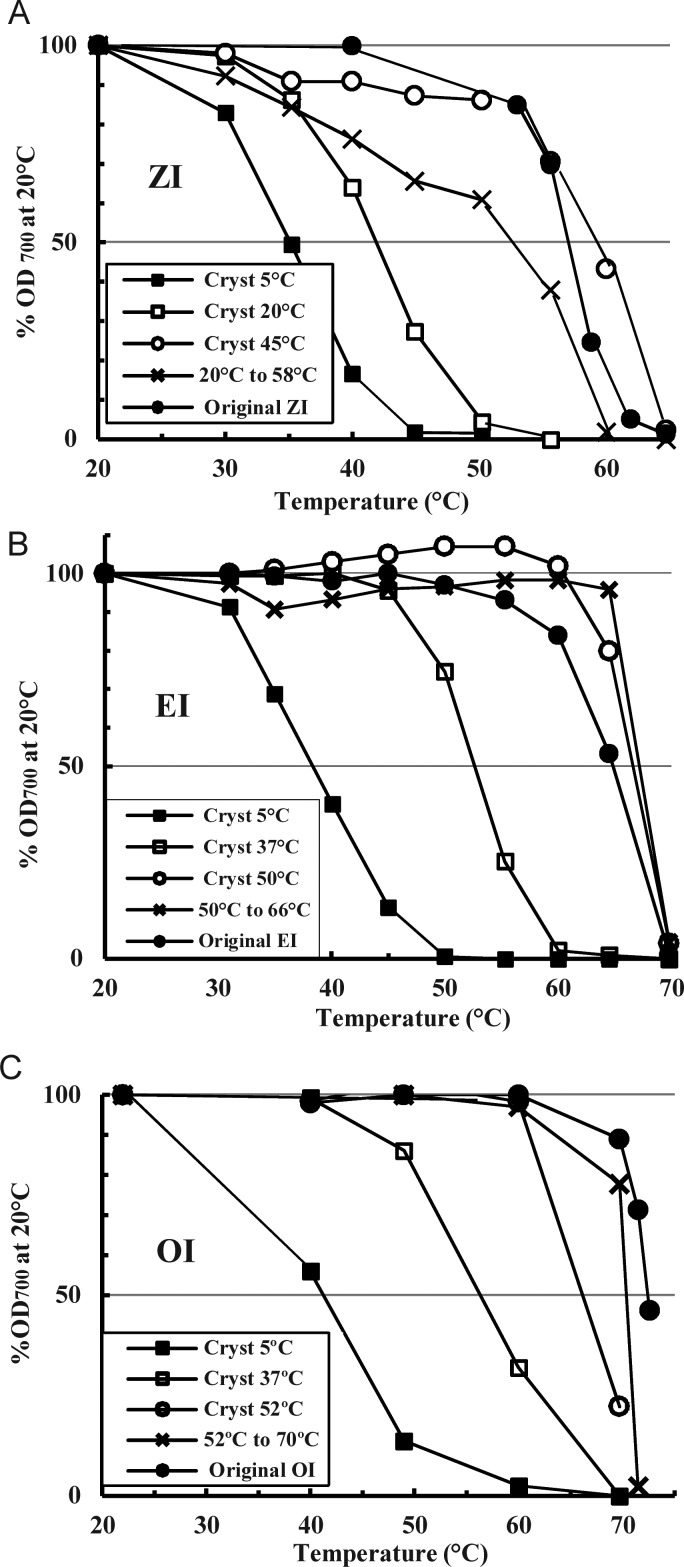
Both GI and DI were fully reversible and may be dissolved and re-made into all lower phenotypes with appropriate heating, finally re-forming the original isoform. The same is true for the higher isoforms (Figure 8): Dissolving ZI, EI and OI lots at 80–85°C and re-precipitating at lower temperatures produces phenotypes of lower isoforms like those typically obtained from the FRM at these temperatures (Figure 1). Re-conversion at higher temperatures of these lower phenotypes then returns the phenotype to that of the starting isoform, with an overall recovery yield of >50%. Since the glycotype (molecular make-up) of the lower phenotypes produced in this way is identical to that of the starting material and the original phenotype to which they can all be returned, these are all true polymorphic forms of each other.
Fig. 8.
Tests of the reversibility of inulin isoforms (A) ZI, (B) EI and (C) OI. Typical preparations of each isoform were dissolved at 83°C and portions of the solution precipitated at the indicated temperatures (inset) for 2 weeks. Dilutions in PBS at 0.5 mg particulate inulin/mL of the fresh, unfractionated final suspensions were progressively heated and the OD700 of each measured after equilibration at each indicated temperature. For each isoform, a portion of one final product was heated at the conversion temperature known to be optimal to produce the original isoform.
MPs by modulated differential scanning calorimetry
Differential scanning calorimetry uses a carefully ramped temperature profile to measure heat flow between sample and reference during endo- or exothermic processes such as phase transitions. Modulated differential scanning calorimetry (MDSC) sinusoidally modulates the profile to improve both resolution and sensitivity in identifying the small, poorly resolved melting transitions of the inulin isoforms. MDSC can also be used to help identify transitions by separation of reversing and non-reversing heat flows. However, inulin isoforms appear to behave like some other semi-crystalline materials (Mano et al. 2005; Wunderlich 2006), where nanophase separation between amorphous and crystalline regions can result in surface strain effects that increase the glass transition temperature such that it coincides with melting to appear as a single transition (data not shown), restricting this technique's utility in this instance.
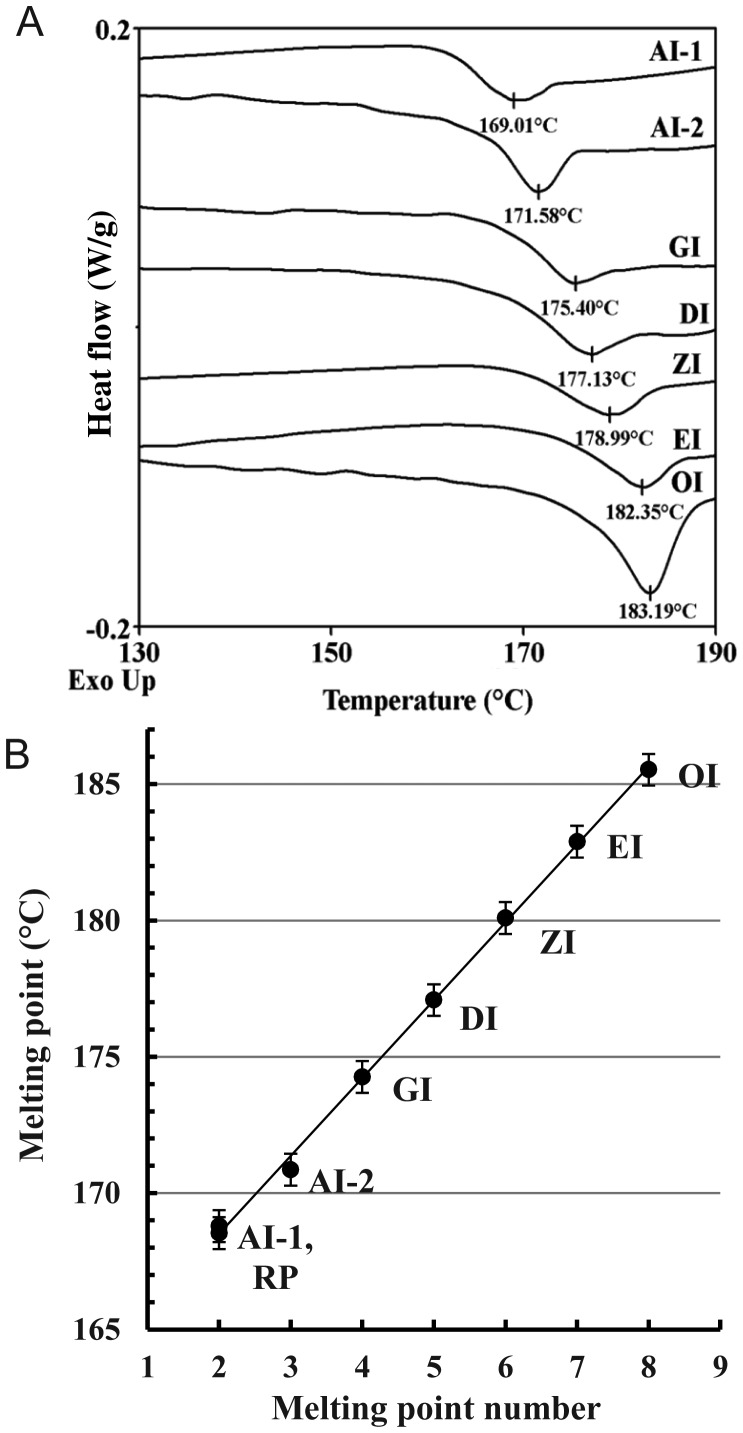
MDSC analysis of freeze-dried isoforms revealed specific MPs increasing up the isoform series, illustrated by representative MDSC total heat flow thermograms (Figure 9A). The restriction of an MP to a particular isoform was confirmed using different preparations of each, where replicate MPs within a single sample and between replicate samples of the same isoform were reproducible (Table III). Only one major MP was found for each preparation, with sometimes one or two higher but much smaller ones presumably indicating minor higher isoform contamination. The variance of the mean MP values was low except for OI. The intervals between MP values were small yet individual measurements did not overlap except for one OI reading. The untreated raw powder (RP), supplied as a large batch of dry material, had a >60% content of AI-1 as revealed by both Tc(OD) and Tc(RI) (data not shown) and its MP of MP2. It also has a lower peak (MP1) commonly attributed to the MP of inulin organized through the plasticizing effect of water (Ronkart et al. 2009, 2010). A plot of mean (dry) MP value against MP number (or isoform type) reveals a close linear relation (Figure 9B) unlike the nonlinear relation seen for the (wet) Tc values. However, the regularity of the increments is equally striking for both.
Fig. 9.
Results of MDSC analysis. (A) Typical thermograms of freeze-dried isoform samples showing endotherm minima (overlay diagram: Individual curves are shifted vertically). (B) Relation between MP and isoform number (data from Table III). Error bars are±the standard error of the mean of the high variance OI samples. RP refers to the untreated dry inulin powder as supplied.
Table III.
Relation of plus-format isoform type to MP measured by MDSC and to DPn measured by NMR
| Isoform type | MDSC data |
NMR data |
|||||
|---|---|---|---|---|---|---|---|
| NMPa | MP no. | MP °C ± SD | MPCV | NDPb | DPn | DPn CV | |
| RP meanc | 8/1 | 1 | 158.11 ± 0.949 | 0.6 | |||
| Range | 157.24−160.17 | ||||||
| RP meanc | 8/1 | 2 | 168.53 ± 0.599 | 0.355 | 3 | 29.8 | |
| Range | 167.83−169.70 | 29.7−29.9 | |||||
| AI-1 | 1/1 | 2 | 168.79 | 1 | 32.2 | 0.99 | |
| AI-2 mean | 7/3 | 3 | 170.86 ± 0.598 | 0.35 | 3 | 32.9 | 0.49−0.99 |
| Range | 169.73−171.46 | 31.6−33.6 | |||||
| GI mean | 4/1 | 4 | 174.282 ± 0.183 | 0.1 | 2 | 33.4 | 0.33−0.63 |
| Range | 174.56−174.99 | 33.3−33.5 | |||||
| DI mean | 11/4 | 5 | 177.08 ± 1.095 | 0.618 | 3 | 41.5 | 0.62−0.85 |
| Range | 175.56−178.55 | 38.3−44.6 | |||||
| ZI mean | 2/2 | 6 | 180.14 ± 1.626 | 0.903 | 3 | 49.0 | 0.38−0.63 |
| Range | 178.99−181.29 | 37.9−56.5 | |||||
| EI mean | 6/3 | 7 | 182.88 ± 0.363 | 0.199 | 4 | 52.9 | 0.22−0.86 |
| Range | 182.46−183.47 | 51.4−54.9 | |||||
| OI mean | 15/4 | 8 | 185.53 ± 2.255 | 1.21 | 3 | 62.93 | 0.39−1.13 |
| Range | 183.11−188.94 | 59.9−68.8 | |||||
aNMP, number of MSDC measurements/number of replicate isoform preparations analyzed by MSDC.
bNDP, number of replicate isoform samples analyzed by NMR.
cRP, untreated dry inulin powder as supplied.
Measurement of number average degree of polymerization
Because glucose at the reducing end of a fructose chain has three 1H resonances separated from those of fructose, 1H nuclear magnetic resonance (NMR) spectroscopy provides a reliable, convenient and efficient method to determine inulin number average degree of polymerization (DPn) by measuring fructose: glucose ratios (Methods); this assumes few glucose-free chains. Two 1H NMR spectra were obtained for each sample and each spectrum received three analyses to lessen any effect of inconsistent data manipulation, the average of these six measurements comprising the final DPn (Table III). These show that the DPn of the lowest isoforms (AI-1, AI-2 and GI) are consistent with the observed removal of some of the lowest DP material from the RP, and the DPn of the higher isoforms (DI, ZI, EI and OI) confirm a progressive but irregular increase in DPn. As explained in the “Discussion” section, no quantitative relation was expected.
Complement activation by inulin isoforms
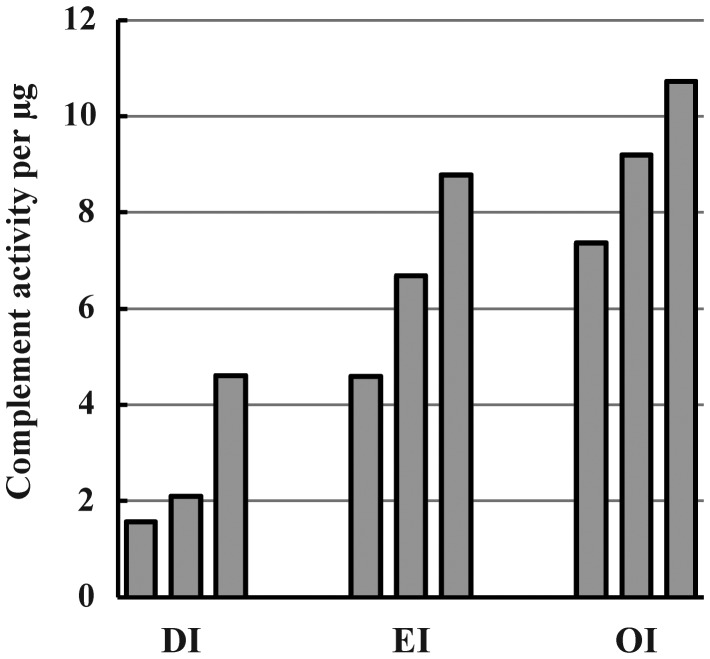
The immune activity per unit weight of the component isoform is clearly important in the design of MPI-based vaccine adjuvants. DI microparticles were significantly more active than pair-matched GI samples in both specific antibody enhancement and complement activation (Cooper and Petrovsky 2011), comparing samples of closely similar make-up (same batch GI heat-converted in to DI with little manipulation). Figure 10 compares three preparations of each of DI, EI and OI for complement activation, showing that all samples of EI and OI tested were at least as active as DI.
Fig. 10.
Specific complement activity of DI, EI and OI preparations. Three samples of each isoform were selected as having comparable particle sizes (majority of diameters between 1 and 2 µm by FACS analysis calibrated with standard polystyrene beads). They were compared by back-titration (measuring lysis of rabbit red blood cells) of residual human serum complement activity after standardized partial inulin activation, using a microplate adaptation of the tube assay previously described (Cooper and Petrovsky 2011): Six replicate wells per sample, mean CV similar to tube assay at ∼20%.
Discussion
The original inulin isoforms were found piecemeal. Beta inulin (BI) was defined by 80% ethanol precipitation from water (Phelps 1965) to distinguish it from the much less soluble undifferentiated AI spontaneously precipitating from water (McDonald, 1946). AI and BI had been previously described (Katz and Weidinger 1931) but confusingly in reverse order. We now find that fresh BI has solubility properties indicating an unstable mixture of un-annealed lower isoforms with variable amounts of inulin soluble at 0°C (data not shown). GI later emerged from early attempts to purify inulin (Cooper and Carter 1986a) and DI was an insoluble product of dissolving GI by slow rather than rapid heating (Cooper and Petrovsky 2011). EI and OI similarly arose from DI and EI, respectively. AI-1 was noticed in inulin precipitates stood 4–6 months at 5°C or room temperature (20–21°C) (RT), while AI-2 and ZI were identified last by systematic search in apparent gaps in the progression of isoform properties. Searches for more heat-stable intermediates or variants above OI were unsuccessful.
This overview of the complete isoform series of MPI allows definitive generalizations.
Each inulin isoform:
is part of a developmental series starting with amorphous inulin → AI-1 → AI-2 → GI → DI → ZI → EI → OI;
is characterized by an (aqueous) MP, i.e., an abrupt phase shift (solubilization) of water suspensions in a tight, specific temperature range. This implies highly ordered but different structures and the range spans a Tc unique to each isoform;
precipitates in major yield from water in a characteristic temperature range. As the product is an ordered structure, this is an ordered precipitation, for which the term crystallization is appropriate without prejudice as to degree (as mentioned, most carbohydrate polymorphs are semi-crystalline in nature and inulin can similarly form crystals; André, Mazeau et al. 1996; André, Putaux et al. 1996.) The inulin left in solution can only produce lower isoforms;
is thus concluded to have a higher mean DP than its precursor. We confirm this by assay of number-average DP;
can be “converted” from its precursor in a Tc range, analogous to a snap re-crystallization and releasing into solution inulin chains that only produce lower isoforms;
can also be precipitated by thawing a frozen inulin solution at characteristic temperatures that lie in the lower part of its conversion range;
is characterized by a Tc at which bulk solubilization begins and then proceeds linearly to give solutions saturated at each new temperature;
is assayed by methods (50% OD700 transition, optimal heat conversion and bulk solubilization temperatures) that all give the same Tc for a given isoform, which is identified as the Tc of that isoform;
has a higher Tc than its precursor, each incremental step being of similar but progressively smaller size;
is also characterized by an MP determined by MDSC that is higher than its precursor, each incremental step being of equal size;
is thus characterized by regularly increasing internal noncovalent bonding than its precursor and the overall bonding is of specific strength and
has increased immune activity as indicated by alternative complement pathway activation.
Intermediates stable to hot-washing are not found. The isoforms themselves occur spontaneously without particular dependence on preparation beyond temperature ranges as broad as 5°C despite thermal properties within ±1°C. Purification is essentially by raising the Tc to a constant value by removal of co-precipitated impurities.
Like GI (Cooper and Carter 1986a) and DI (Cooper and Petrovsky 2011), the higher isoforms may all be re-dissolved and their polymer chains of high bonding strength potential re-made into a range of phenotypes with lower bonding strengths. These are finally re-convertible in to the original higher phenotype in good yield. Thus, the lower bonding-strength phenotypes can be formed by polymer chains derived from high bonding-strength phenotypes but not vice versa. The key factor is the formation temperature, which determines the phenotype. Each phenotype has a specific energetic requirement that must be met before that structure can be formed, irrespective of the DP. Conversely, a similar energy level must be reached before that structure can be disassembled. In fact, quantal energetic increments dominate all aspects of the isoforms and simplify their interpretation.
Direct measurement of representative samples' DPn has here confirmed an increasing trend with ascent of the series but the increments were irregular. This was expected because, except for OI, each of these samples was a “plus-format” preparation, meaning that it had the potential to yield all higher isoforms on heat conversion with loss of lower DP inulin. It must, therefore, contain all higher DP inulin. The observed DPn of a plus-format preparation is, thus, a weighted average of this higher content that is likely to obscure the DPn of the minimal structure that determines its energetic properties, particularly for the lower isoforms.
Perhaps, the most unexpected aspect of the inulin isoform series is its step-wise periodicity. The regular relation between the aqueous Tc and isoform type is confirmed by an equally regular relation between isoform type and dry MPs from MDSC but the structural significance of these differences between isoforms has not yet been worked out. Inulin particles are expected to comprise layers of crystalline lamellae (André, Mazeau et al. 1996; André, Putaux et al. 1996; Cooper and Petrovsky 2011; Hébette et al. 2011), each composed of chains helically folded into rigid rods that are aligned in parallel arrays. The arrays form broad sheets with the rods perpendicular to the lamellar plane. Presumably the isoforms of inulin reflect variations on this motif and there is more than one possibility for this. The precise repetition and close analogies of properties argue strongly for repeated addition of a specific structural element as the series is ascended, for which the six-membered helix turn in the unit crystal cell proposed by André, Mazeau et al. (1996) is an attractive candidate. This aspect including X-ray diffraction studies will be further explored elsewhere (P.D.C., T.G.B., M.G.-M., A.G. and N.P., in preparation).
Although we have long used the Tc (“aqueous melting point”: Cooper and Carter 1986a; Cooper and Steele 1991; Cooper and Petrovsky 2011), it appears to have remained unconventional, and it was interesting to compare it with a more conventional but analogous measure of aggregate H-bonding strength such as dry MP by MDSC. We found the outcomes for the inulin isoform series qualitatively identical, while the quantitative differences between wet and dry values may relate to the monohydrate and hemi-hydrate forms of inulin (André, Mazeau et al. 1996). The Tc (aqueous) has several practical advantages. All manipulation of inulin samples is aqueous and the Tc (aqueous) provides a real-time quantitative measure for discovery, preparation, identity and purification of all the isoforms—quickly, accurately, cheaply and simply—relating directly to the material as it is being processed. The Tc (aqueous), once known, is the temperature actually used in processing.
The biological relevance of the inulin isoforms relates to the spectrum of their immune activities. At its simplest, particles of the highest isoforms are the least soluble and most stable at body temperatures but other factors are expected also to be important. We show here that the higher isoforms are the most potent alternative complement pathway activators. It will be interesting in due course to explore how the new isoforms described may differ in other biological activities.
This work highlights the complexity when using carbohydrates such as inulin as fine pharmaceuticals, given the many different isoforms/polymorphic forms and associated biological activities they are able to adopt. Notably, a thorough understanding of the inulin isoforms has been critical to relevant assay development to enable production of delta inulin vaccine adjuvant (Advax™) to Good Manufacturing Practice standards. Advax™ is currently in human (Gordon et al. 2012) and veterinary (Lobigs et al. 2010; Eckersley et al. 2011) clinical development across a broad range of vaccine applications.
Materials and methods
Materials
Chicory inulin (Raftiline HP) was supplied as a single large batch in powder form by BENEO-Orafti, Tienen, Belgium. This inulin was dissolved at 85°C to 100 mg/mL and purified in compliance with British/US Pharmacopoeia standards by ion-exchange and 200 nm filtration as described previously (Cooper and Carter 1986a; Cooper and Petrovsky 2011), to yield the FRM solution quoted. All solutions comprised WFI/bic (pH ∼8: 1 mM Na bicarbonate in Water for Injection; Baxter, Sydney, NSW, Australia) unless otherwise stated. Materials were sterile and handled aseptically. Inulin concentrations were measured by RI and taken as Brix measured by a Brix-Mettler Toledo “Quick-Brix” 90 hand refractometer calibrated by the supplied standard sucrose solution, restricting sample concentrations to <200 mg/mL.
Isoform preparation
The following are convenient, simplified conditions for preparing the isoforms, although most samples used temperatures that varied up to ±5°C from those specified illustrating the broad ranges that nevertheless allow their spontaneous formation. The FRM may be precipitated at 5°C or RT followed by heat-conversion up the isoform series using the Tc and annealing temperatures of Table II. Annealing at an appropriate temperature (Table II) should always follow a conversion step. Minimal conversion times were 90 min and annealing times 7 days, with intermittent mixing. Hot-washing was done by heating no higher than the Tc (Table II) and centrifuging repeatedly (10–30 min, 650 × g) with WFI/bic at RT to supernatant RI <2 mg/mL. AI-1: FRM solutions (100 mg/mL) were frozen in plastic vessels and thawed and then stirred or stood at 5°C for up to 6 months, checking for isoform type at monthly intervals. The precipitate was washed at RT. AI-2: Frozen FRM solutions (100 mg/mL) were thawed and stirred or stood at RT for 7 days, then converted at 34°C, annealed at RT and hot-washed. GI and DI were similarly converted and annealed (Table II) from the washed AI-2 suspensions then hot-washed, while ZI, EI and OI were similarly processed from the washed GI, DI and EI suspensions, respectively.
Temperature control
Inulin properties and handling depend on small temperature changes over the entire range 0–85°C so that close temperature control is critical. Thermometers were standardized against a National Association of Testing Authorities (Australia)-calibrated reference thermometer. Short-term (<8 h) heat treatments used rapidly stirred small water baths controlled to ±0.1°C (Braun Thermomix 1441, B. Braun Biotech International; Lab Companion RW-10250, Jeio Tech Co. Ltd, Seoul, Korea) and glass vessels allowing rapid heat transfer, while longer term treatments used either circulated rooms with recording devices (5°C, RT (20–21°C) and 37°C) or covered water baths both maintained to ±0.5°C. Inulin suspensions were dissolved quickly with rapid stirring on a magnetic stirrer/hotplate directly heating a Schott or Pyrex bottle (200 mL to 1 L) monitored by an immersed thermometer.
Isoform assay
Isoform assays by optical density were done as previously described (Cooper and Petrovsky 2011). Samples of isoform suspensions were diluted in phosphate buffered saline (PBS) to <2 mg/mL in glass tubes and the OD700 at RT measured. Tubes were then held for 10 min in a water bath maintained at the differentiation assay temperature designated in Table II for that isoform, and that OD700 when divided by the OD700 at RT is taken as the proportion of that plus-format isoform present.
Modulated differential scanning calorimetry
MDSC used a TA Instruments Australia model MDSC 2920 with an attached accessory providing cooling. All assays were done under high-purity nitrogen (70 mL/min); reference and sample pans were of equal mass ± 0.1 mg. The baseline was calibrated with an empty cell, for temperature and cell constant using indium and for specific heat capacity using sapphire. Heating profiles (Ronkart et al. 2007) involved initial equilibration (40°C, 5 min) and then heating to 200°C at 1.5°C/min. The heating ramp was modulated with an amplitude of 1.5°C and a period of 90 s. All assays used open pans and 5 mg solids dried over P2O5 for ≥5 days; multiple samples of each isoform except AI-1 and one to six replicates/sample gave the final averaged MP. MPs were taken as the peak minimum of the largest transition.
Determination of DPn
1H NMR spectra were recorded on a Bruker Avance III 600 at 600 MHz for 1H. One-dimensional spectra were collected using standard gradient-based pulse programs. The integral of the glucose anomeric peak at 5.44 ppm was set to 1 to calibrate a spectrum and the combined integral of all other resonances of inulin (= X) provided a measure of the average number of units in the chain using the formula: DPn = ((X − 6)/7) + 1 (Barclay et al. 2012). The 1H NMR data were obtained over 64 scans with a 30° flip angle (90° pulse = 8.4 µs), an acquisition time of 2.7 s, a relaxation delay of 2 s and 65K data points. Temperature was held at 20°C by an in-built heater calibrated with ethylene glycol. All experiments were done in D2O with inulin at 25 mg/mL and chemical shifts of parts per million (ppm) downfield from 3-(trimethylsilyl)propionic acid sodium salt (TPS). Calibration of inulin shifts to TPS was achieved in separate experiments using an acetic acid internal standard (acetic acid methyl group at 2.08 ppm; Gottlieb et al. 1997). Duplicate 1H NMR spectra were each analyzed three times to give an overall average for DPn that proved reproducible, with CV of replicate assays generally ∼0.5% (Table III).
Funding
This work was supported in part by Federal funds from the US Department of Health and Human Services (HHSN272200800039C) and the National Institutes of Health (NIH, U01AI061142). The content is solely the responsibility of the authors and does not necessarily represent the official views of the NIH. This work was also supported by The Australian Research Council through a Linkage grant (LP0882596) and a LIEF grant (LE0668489).
Conflict of interest
P.D.C. and N.P. are employees or consultants of Vaxine Pty Ltd.
Abbreviations
AI-1, alpha-1 inulin; AI-2, alpha-2 inulin; BI, beta inulin; CV, coefficient of variation = SD × 100/mean; DI, delta inulin; DP, degree of polymerization; DPn, number average degree of polymerization; EI, epsilon inulin; FRM, filtered raw material; GI, gamma inulin; MDSC, modulated differential scanning calorimetry; MP, melting point; MPI, micro-particulate inulin; ND, not determined; NMR, nuclear magnetic resonance; OD700, optical density measured at 700 nm; PBS, phosphate buffered saline; ppm, parts per million; RI; refractive index; RP, raw powder; RT, room temperature (20–21°C); SD, standard deviation; Tc, critical temperature; TPS, 3-(trimethylsilyl)propionic acid sodium salt; WFI/bic, 1 mM Na bicarbonate solution in Water for Injection.
Acknowledgements
We thank Dr. Doug Taupin for invaluable support throughout the course of these studies and Steve Shamis from TA Instruments Australia for conducting some final MDSC experiments when our instrument was no longer available. P.C. is an Emeritus Visiting Fellow of the Australian National University Medical School and of the John Curtin School of Medical Research, Australian National University, Canberra, Australia.
References
- André I, Mazeau K, Tvaroska I, Putaux J-L, Winter WT, Taravel F, Chanzy H. Molecular and crystal structures of inulin from electron diffraction data. Macromolecules. 1996;29:4626–4635. [Google Scholar]
- André I, Putaux J-L, Chanzy H, Taravel FR, Timmermans JW, de Wit D. Single crystals of inulin. Int J Biol Macromol. 1996;18:195–204. doi: 10.1016/0141-8130(95)01075-0. [DOI] [PubMed] [Google Scholar]
- Barclay T, Ginic-Markovic M, Cooper PD, Petrovsky N. Inulin—A versatile polysaccharide with multiple pharmaceutical and food chemical uses. J Excipients Food Chem. 2010;1:1–24. [Google Scholar]
- Barclay T, Ginic-Markovic M, Johnston MR, Cooper PD, Petrovsky N. Analysis of the hydrolysis of inulin using real time 1H NMR spectroscopy. Carbohydr Res. 2012;352:117–125. doi: 10.1016/j.carres.2012.03.001. [DOI] [PMC free article] [PubMed] [Google Scholar]
- Cooper PD. Complement and cancer: Activation of the alternative pathway as a theoretical base for immunotherapy. In: Ray PK, editor. Advances in Immunology and Cancer Therapy Vol 1. New York, NY: Springer; 1985. pp. 125–166. [DOI] [PubMed] [Google Scholar]
- Cooper PD. Solid-phase activators of the alternative pathway of complement and their use in vivo. In: Sim RB, editor. Activators and Inhibitors of Complement. Dordrecht, Netherlands: Kluwer Academic Publishers; 1993. pp. 69–106. [Google Scholar]
- Cooper PD, Carter M. Anticomplementary action of polymorphic ‘solubility forms’ of particulate inulin. Mol Immunol. 1986a;23:895–901. doi: 10.1016/0161-5890(86)90075-1. [DOI] [PubMed] [Google Scholar]
- Cooper PD, Carter M. The anti-melanoma activity of inulin in mice. Mol Immunol. 1986b;23:903–908. doi: 10.1016/0161-5890(86)90076-3. [DOI] [PubMed] [Google Scholar]
- Cooper PD, Masinello GR. Protein A treatment of cancer: Activation of a serum component with trans-species anti-B16 melanoma activity. Int J Cancer. 1983;32:737–744. doi: 10.1002/ijc.2910320614. [DOI] [PubMed] [Google Scholar]
- Cooper PD, Petrovsky N. Delta inulin: A novel, immunologically-active, stable packing structure comprising β-d-[2→1] poly(fructo-furanosyl) α-d-glucose polymers. Glycobiology. 2011;21:595–606. doi: 10.1093/glycob/cwq201. [DOI] [PMC free article] [PubMed] [Google Scholar]
- Cooper PD, Sim RB. Substances that can trigger activation of the alternative pathway of complement have anti-melanoma activity in mice. Int J Cancer. 1984;33:683–687. doi: 10.1002/ijc.2910330520. [DOI] [PubMed] [Google Scholar]
- Cooper PD, Steele EJ. The adjuvanticity of gamma inulin. Immunol Cell Biol. 1988;66:345–352. doi: 10.1038/icb.1988.45. [DOI] [PubMed] [Google Scholar]
- Cooper PD, Steele EJ. Algammulin, a new vaccine adjuvant comprising gamma inulin particles containing alum: Preparation and in vitro properties. Vaccine. 1991;9:351–357. doi: 10.1016/0264-410x(91)90063-c. [DOI] [PubMed] [Google Scholar]
- Cooper PD, Turner R, McGovern J. Algammulin (gamma inulin/alum hybrid adjuvant) has greater adjuvanticity than alum for hepatitis B surface antigen in mice. Immunol Lett. 1991;27:131–134. doi: 10.1016/0165-2478(91)90140-6. [DOI] [PubMed] [Google Scholar]
- Cristillo AD, Ferrari MG, Hudacik L, Lewis B, Galmin L, Bowen B, Thompson D, Petrovsky N, Markham P, Pal R. Induction of mucosal and systemic antibody and T-cell responses following prime-boost immunization with novel adjuvanted human immunodeficiency virus-1-vaccine formulations. J Gen Virol. 2011;92:128–140. doi: 10.1099/vir.0.023242-0. [DOI] [PMC free article] [PubMed] [Google Scholar]
- Eckersley AM, Petrovsky N, Kinne J, Wernery R, Wernery U. Improving the dromedary antibody response: The hunt for the ideal camel adjuvant. J Camel Pract Res. 2011;18:35–46. [Google Scholar]
- Frazer IH, Tindle RW, Fernando GJP, Malcolm K, Herd K, McFadyn S, Cooper PD, Ward B. Safety and immunogenicity of HPV16 E7/Algammulin. In: Tindle RW, editor. Vaccines for Human Papillomavirus Infection and Anogenital Disease. New York, NY: RG Landes; 1999. pp. 91–104. [Google Scholar]
- Gordon DL, Sajkov D, Woodman RJ, Honda-Okubo Y, Cox MMJ, Heinzel S, Petrovsky N. Randomized clinical trial of immunogenicity and safety of a recombinant H1N1/2009 pandemic influenza vaccine containing Advax™ polysaccharide adjuvant. Vaccine. 2012;30:5407–5416. doi: 10.1016/j.vaccine.2012.06.009. [DOI] [PMC free article] [PubMed] [Google Scholar]
- Gottlieb HE, Kotlyar V, Nudelman A. NMR chemical shifts of common laboratory solvents as trace impurities. J Org Chem. 1997;62:7512–7515. doi: 10.1021/jo971176v. [DOI] [PubMed] [Google Scholar]
- Hébette CL, Delcour JA, Koch MHJ, Booten K, Reynaers HL. Crystallization and melting of inulin crystals. A small angle X-ray scattering approach (SAXS) Polimery. 2011;56:645–651. [Google Scholar]
- Honda-Okubo Y, Saade F, Petrovsky N. Advax™, a polysaccharide adjuvant derived from delta inulin, provides improved influenza vaccine protection through broad-based enhancement of adaptive immune responses. Vaccine. 2012;30:5373–5381. doi: 10.1016/j.vaccine.2012.06.021. [DOI] [PMC free article] [PubMed] [Google Scholar]
- Katz JR, Weidinger A. Polymorphism of substances of high molecular weight. II. Amorphous and crystalline inulin. Recl Trav Chim Pays-Bas. 1931;50:1133–1137. Abstract only available. [Google Scholar]
- Korbelik M, Cooper PD. Potentiation of photodynamic therapy of cancer by complement: The effect of gamma-inulin. Br J Cancer. 2007;96:67–72. doi: 10.1038/sj.bjc.6603508. [DOI] [PMC free article] [PubMed] [Google Scholar]
- Larena M, Prow NA, Hall RA, Petrovsky N, Lobigs M. JE-ADVAX vaccine protection against Japanese encephalitis virus mediated by memory B cells in the absence of CD8+ T cells and pre-exposure neutralizing antibody. J Virol. 2013;87:4395–4402. doi: 10.1128/JVI.03144-12. [DOI] [PMC free article] [PubMed] [Google Scholar]
- Layton RC, Petrovsky N, Gigliotti AP, Pollock Z, Knight J, Donart N, Pyles J, Harrod KS, Gao P, Koster F. Delta inulin polysaccharide adjuvant enhances the ability of split- virion H5N1 vaccine to protect against lethal challenge in ferrets. Vaccine. 2011;29:6242–6251. doi: 10.1016/j.vaccine.2011.06.078. [DOI] [PMC free article] [PubMed] [Google Scholar]
- Lobigs M, Pavy M, Hall RA, Lobigs P, Cooper P, Komiya T, Toriniwa H, Petrovsky N. An inactivated Vero cell-grown Japanese encephalitis vaccine formulated with Advax, a novel inulin-based adjuvant, induces protective neutralizing antibody against homologous and heterologous flaviviruses. J Gen Virol. 2010;91:1407–1417. doi: 10.1099/vir.0.019190-0. [DOI] [PMC free article] [PubMed] [Google Scholar]
- Mano JF, Ribelles JLG, Alves NM, Sanchez MS. Glass transition dynamics and structural relaxation of PLLA studied by DSC: Influence of crystallinity. Polymer. 2005;46:8258–8265. [Google Scholar]
- McDonald EJ. The polyfructosans and difructose anhydrides. Adv Carbohyd Chem. 1946;2:253–277. [Google Scholar]
- Nezzal A, Aerts L, Verspaille M, Henderickx G, Redl A. Polymorphism of sorbitol. J Crystal Growth. 2009;311:3863–3870. [Google Scholar]
- Perez S, Bertoft E. The molecular structures of starch components and their contribution to the architecture of starch granules: A comprehensive review. Starch. 2010;62:389–420. [Google Scholar]
- Petrovsky N, Cooper PD. Carbohydrate-based immune adjuvants. Expert Rev Vaccines. 2011;10:523–537. doi: 10.1586/erv.11.30. [DOI] [PMC free article] [PubMed] [Google Scholar]
- Phelps CF. The physical properties of inulin solutions. Biochem J. 1965;95:41–47. doi: 10.1042/bj0950041. [DOI] [PMC free article] [PubMed] [Google Scholar]
- Ronkart SN, Deroanne C, Paquot M, Fougnies C, Blecker CS. Impact of the crystallisation pathway of inulin on its mono-hydrate to hemi-hydrate thermal transition. Food Chem. 2010;119:317–322. [Google Scholar]
- Ronkart SN, Deroanne C, Paquot M, Fougnies C, Lambrechts J-C, Blecker CS. Characterization of the physical state of spray-dried inulin. Food Biophys. 2007;2:83–92. [Google Scholar]
- Ronkart SN, Paquot M, Blecker CS, Fougnies C, Doran L, Lambrechts J-C, Norberg B, Deroanne C. Impact of the crystallinity on the physical properties of inulin during water sorption. Food Biophys. 2009;4:49–58. [Google Scholar]
- Saade F, Honda-Okubo Y, Trec S, Petrovsky N. A novel hepatitis B vaccine containing Advax, a polysaccharide adjuvant derived from delta inulin, induces robust humoral and cellular immunity with minimal reactogenicity in preclinical testing. Vaccine. 2013;31:1999–2007. doi: 10.1016/j.vaccine.2012.12.077. [DOI] [PMC free article] [PubMed] [Google Scholar]
- Sarko A, Wu H-C. The crystal structure of A-, B- and C-polymorphs of amylose and starch. Starch. 1978;30:73–78. [Google Scholar]
- Shamai K, Bianco-Peled H, Shimoni E. Polymorphism of resistant starch type III. Carbohydr Polymers. 2003;54:363–369. [Google Scholar]
- Silva DG, Cooper PD, Petrovsky N. Inulin-derived adjuvants efficiently promote both Th1 and Th2 immune responses. Immunol Cell Biol. 2004;82:611–616. doi: 10.1111/j.1440-1711.2004.01290.x. [DOI] [PubMed] [Google Scholar]
- Wunderlich B. The Application of MTDSC to Polymer Melting. In: Reading M, Hourston DJ, editors. Modulated Temperature Differential Scanning Calorimetry: Theoretical and Practical Applications in Polymer Characterisation. Dordrecht: Springer; 2006. pp. 217–320. [Google Scholar]


