

Abstract
Gene regulation in cells exposed to ionizing radiation (IR) occurs at the transcriptional and post-transcriptional levels. Recent studies have suggested that micro-RNA (miRNA) play a significant role in post-transcriptional gene regulation in irradiated cells. miRNA are RNA molecules 18–24 nucleotides in length that are involved in negatively regulating the stability or translation of target messenger RNA. Previous studies from our laboratory have shown that the expression of various miRNA is altered in IR-treated cells. In the present study we monitored genome-wide expression changes of miRNA transcriptome by massively parallel sequencing of human cells irradiated with X-rays. The baseline expression of 402 miRNA indicated a wide range of modulation without exposure to IR. Differences in the expression of many miRNA were observed in a time-dependent fashion following radiation treatment. The Short Time-series Expression Miner (STEM) clustering tool was used to characterize 190 miRNA to six statistically significant temporal expression profiles. miR-19b and miR-93 were induced and miR-222, miR-92a, and miR-941 were repressed after radiation treatment. miR-142-3p, miR-142-5p, miR-107, miR-106b, miR-191, miR-21, miR-26a, miR-182, miR-16, miR-146a, miR-22 and miR-30e exhibited two peaks of induction: one at 8 h and the other at 24 h post-irradiation. miR-378, miR-let-7a, miR-let-7g, miR-let-7f, miR-103b, miR-486-3p, miR-423-5p, miR-4448, miR-3607-5p, miR-20b, miR-130b, miR-155, miR-181, miR-30d and miR-378c were induced only at the 8-h time-point. This catalogue of the inventory of miRNA that are modulated as a response to radiation exposure will be useful for explaining the mechanisms of gene regulation under conditions of stress.
Keywords: micro-RNA, differential gene expression, next-generation sequencing, TK6 cells, radiation effects
INTRODUCTION
Ionizing radiation (IR) exposure results in either the direct deposition of energy or the formation of free radicals and reactive oxygen species generated from the radiolysis of water [1]. A wide range of biological effects are induced in cells exposed to IR [2]. The induction of DNA damage and repair, cell cycle perturbation, sister-chromatid exchanges, chromosome aberrations, transformations, mutations, apoptosis, bystander effects, alterations in nuclear and mitochondrial gene expression, disturbances in microRNA (miRNA) expression, and changes in DNA methylation have been reported [3–8]. However the underlying mechanism(s) responsible for these biological effects are not completely understood. The complexity of the response to IR is evidenced by the alterations in the expression of a large number of genes [9]. The modulation of radiation-induced genes depends upon the cell types, suggesting the activation of different pathways in different cells [10]. The mechanism(s) behind the large scale genome-wide responses in gene expression are not yet fully explored.
The regulation of gene expression could be achieved by a range of genetic and epigenetic processes. The epigenetic control of gene regulation is accomplished by methylation of histones or promoter regions via DNA methyltransferase [11, 12] or via miRNA [13, 14]. miRNAs are short segments of non-coding RNA that regulate gene expression by imprecise binding with complementary sequences, usually located on the 3' end of messenger RNA (mRNA) [15]. miRNA work as negative regulators by forming RNA-induced silencing complexes (RISC) and targeting mRNA, where they either inhibit translational elongation or direct destructive cleavage [16]. It is suggested that miRNA are responsible for regulating over one third of genetic expression within a cell [17]. One individual miRNA has the potential to mediate translation of several hundred different mRNA, and the expression of one gene can be regulated by numerous miRNA [18]. miRNA can function as tumor suppressors and oncogenes; miRNA with a role in cancer are designated oncogenic miRNA (oncomiR) [19]. miRNA have been shown to play a role in the regulation of cell proliferation, cell death and tumorigenesis. miRNA responses in cells exposed to IR have been reported in many publications [20, 21].
Recently our laboratory investigated the expression of several miRNAs in various cells treated with IR [14]. We found that the modulation of miRNA was dependent on cell type, radiation dose and dose rate [6, 22–24]. We also observed differential miRNA expression in directly irradiated vs non-irradiated bystander cells (Chaudhry and Omaruddin, in press). Our previous studies utilized a small number of miRNA for expression analysis. High-throughput methods such as next generation sequencing now allow simultaneous detection and analysis of thousands of miRNAs. In the present study we employed massively parallel sequencing (MPS) technology to catalogue the miRNAs that respond to IR treatment, in order to gain a genome-wide view of the miRNAome disturbances.
MATERIALS AND METHODS
Growth and maintenance of cells
The human lymphoblast cell line TK6 was kindly provided by Dr Howard Liber, Colorado State University, Fort Collins, CO, USA. These cells were grown exponentially in suspension in a T75 flask using Roswell Park Memorial Institute medium, RPMI 1640, supplemented with 10% fetal bovine serum (Invitrogen, Grand Island, NY, USA), Penicillin, and Streptomycin. The cell cultures were maintained at a density of 2–5 × 10⁵ cells/ml in a 37°C incubator with 5% CO2 and 100% humidity.
Ionizing radiation treatment
Irradiation of 5 × 10⁶ log phase cells was performed with a RAD Source 2000 X-ray Biological Irradiator (Alpharetta, GA, USA) available at the University of Vermont, at a dose rate of 1.7 Gy/min. A dose of 2 Gy was administered at room temperature. The treated cells were incubated at 37°C and harvested at 0, 4, 8, 12 and 24 h for isolating RNA.
RNA isolation
The cells for RNA isolation were counted with a hemocytometer, and approximately 5 × 10⁶ cells were pelleted by centrifugation at 1500 rpm for 5 min, then washed with 1 ml Dulbecco's phosphate-buffered saline (PBS) without MgCl2 and CaCl2 (Invitrogen, Carlsbad, CA, USA). Small RNA ( < 200 nucleotides) were isolated from cells using the mirVana™ miRNA isolation kit following the enrichment procedure for small RNA recovery (Applied Biosystems; Foster City, CA, USA). The quantity and quality of miRNA was measured on the BioPhotometer (Eppendorf, Westbury, NY, USA) and by running 2% agarose gels stained with ethidium bromide.
Small RNA library preparation, sequencing and data processing
After passing quality controls, 250 ng of isolated small RNAs was used in the Illumina TruSeq Small RNA Sample Preparation Kit to prepare libraries. All barcoded libraries for different time-point samples were combined in equimolar (10 nmol/l) amounts and diluted to 4 pmol/ l for cluster formation on a single flowcell lane. The pool of libraries was sequenced in one lane of a HiSeq 2000 system (Illumina Inc. San Diego, CA) to analyze differential expression patterns of miRNAs. Base-calling of DNA clusters was performed using Illumina processing pipeline software (version 1.5) and 36-nt sequences, with quality scores, were obtained in the SCARF text format of Illumina. UNIX functions were used to sort the sequences according to barcode, to remove the four barcoding nucleotides, and to convert sequence data to FASTQ format.
Data analysis
Paired-end data from an Illumina HiSeq run against mature human miRNAs from miRBase revision 17 [25–28] was done with Bowtie [29] (http://bowtie-bio.sourceforge.net/index.shtml). First, the paired-end reads were merged using SeqPrep (https://github.com/jstjohn/SeqPrep) and filtered for any contaminants from Illumina HiSeq adapters. Reads of known human miRNA lengths (16–27 bp) were then selected from the merged paired-end data. The remaining reads were then filtered to remove any matches to human ribosomal and transfer RNAs. These filtered reads were mapped using Bowtie to the mature human miRNAs using zero mismatches. The default options available with these software packages were used in the analyses. Counts data was generated from the alignment hits identified through Bowtie. According to human genome annotation, mapped reads were classified into non-coding RNA species e.g. miRNA, mtRNA, and rRNAs. We defined reads as miRNA if they mapped to the miRNA precursor. A time-series analysis of the miRNA expression data was performed using STEM (Short Time-series Expression Miner) http://www.cs.cmu.edu/~jernst/stem/ [30]. STEM was run using the ‘normalize data’ option, with all other settings set to the defaults.
RESULTS
Exponentially growing TK6 cells were treated with a 2 Gy dose of X-rays. The irradiated cells were collected for miRNA expression analysis 4, 8, 12 and 24 h after X-ray exposure. We used the Illumina Deep Sequencing platform to profile all known miRNAs in the radiation-treated cells. The sequence reads generated with the MPS platform were mapped back to a reference genome. Sequence reads that mapped back to the reference were then counted to assess the level of gene expression, the number of mapped reads being the measure of expression level for that miRNA. The sequence reads are not related to the in vivo miRNA copy numbers per cell because of an amplification step in the MPS procedure.
We first determined the baseline levels of miRNA that were expressed in TK6 cells without exposure to IR (Fig. 1). A total of 402 miRNA exhibited read counts on the Illumina system. Out of those 402 miRNAs, 320 (79.6%) had counts ranging from 1–100, 42 (10.5%) had counts ranging from 100–500, 12 (3%) had counts ranging from 500–1000, 24 (6%) had counts ranging from 1000–10 000, and 4 (1%) had counts ranging from 10 000–100 000. miRNA that showed > 100 read counts in TK6 cells are shown in Table 1.
Figure 1:
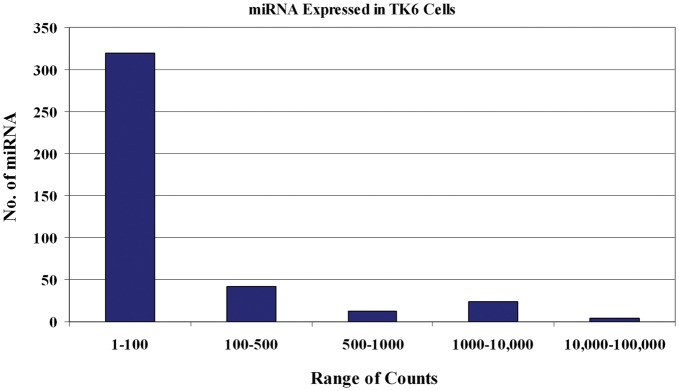
Baseline expression of miRNA in TK6 cells without exposure to ionizing radiation. Each bar represents the total number of miRNA and their relative abundance in these cells.
Table 1:
miRNA expressed in TK6 cells
| miRNA | Number of Counts |
|---|---|
| miR-92a | 101 634 |
| miR-191 | 84 828 |
| miR-181a | 17 235 |
| miR-16 | 11 367 |
| miR-155 | 8 446 |
| hsa-let-7f | 7 131 |
| miR-423-5p | 6 385 |
| miR-26a | 6 086 |
| let-7a | 5 049 |
| miR-146a | 5 009 |
| miR-25 | 4 768 |
| miR-182 | 4 384 |
| miR-21 | 4 247 |
| miR-21* | 4 065 |
| miR-27b | 3 828 |
| miR-142-5p | 3 424 |
| miR-181b | 3 380 |
| miR-423-3p | 2 612 |
| miR-378 | 2 194 |
| miR-363 | 1 898 |
| miR-186 | 1 519 |
| miR-22 | 1 478 |
| miR-148a | 1 473 |
| miR-103b | 1 312 |
| miR-941 | 1 178 |
| let-7c | 1 094 |
| miR-181a* | 1 051 |
| miR-345 | 1 037 |
| miR-99a | 948 |
| miR-720 | 905 |
| miR-93 | 896 |
| miR-19b | 883 |
| miR-30d | 773 |
| miR-92a-1* | 747 |
| miR-30e* | 711 |
| miR-130b | 649 |
| let-7i | 645 |
| miR-769-5p | 554 |
| miR-486-5p | 538 |
| let-7g | 503 |
| miR-17 | 434 |
| miR-181a-2* | 423 |
| miR-15b | 414 |
| miR-103a | 399 |
| miR-1260b | 397 |
| miR-484 | 354 |
| miR-142-3p | 345 |
| miR-125b | 331 |
| miR-671-3p | 329 |
| miR-183 | 322 |
| miR-27a | 310 |
| miR-20a | 308 |
| miR-320a | 305 |
| miR-30b | 291 |
| miR-106b* | 275 |
| miR-151-5p | 234 |
| miR-192 | 232 |
| miR-27b* | 225 |
| miR-744 | 225 |
| miR-221 | 222 |
| miR-29a | 217 |
| miR-19a | 216 |
| miR-128 | 215 |
| miR-3184 | 215 |
| miR-17* | 214 |
| miR-148a* | 192 |
| miR-339-3p | 190 |
| miR-26b | 177 |
| miR-1275 | 162 |
| miR-15a | 159 |
| miR-301a | 156 |
| miR-18a* | 138 |
| miR-30c-1* | 136 |
| miR-378c | 135 |
| miR-425 | 129 |
| miR-20b | 118 |
| miR-25* | 116 |
| miR-107 | 114 |
| miR-532-5p | 112 |
| miR-98 | 111 |
| miR-143 | 107 |
| miR-30d* | 103 |
miRNA modulation in irradiated TK6 cells collected in the time-course experiment was assessed by time-series analysis of the sequencing data using the STEM software [30]. The STEM clustering tool assigned each miRNA to the model profile that most closely matched its temporal expression profile. Six statistically significant profiles were generated (Fig. 2). Profiles 27 and 15 were characterized by STEM to form a cluster of similar profiles, and thus were shown with the same color. The numbers of expected and assigned miRNAs in each profile, along with the P-values, are summarized in Fig. 2. The statistically significant number of miRNAs assigned to a profile is based on a permutation test. miRNA with five or more read counts belonging to these profiles are shown in Tables 2–7. The physiological importance of miRNAs with sequence reads of five or less is unknown. To avoid including very long tables in the manuscript, we chose an arbitrary five sequence reads as a cutoff.
Figure 2:

miRNA expression analysis by STEM clustering. (a) Each miRNA was assigned to a model profile that most closely matched its temporal expression profile. Statistically significant profiles that are similar form a cluster of profiles, and are shown with the same color. The number in the top left hand corner of each profile box is the profile ID. (b) The profiles that have a statistically significant number of miRNA assigned based on a permutation test.
Table 2:
The expression analysis of various miRNA belonging to Profile 12 as assigned by the STEM clustering tool
| miRNA | 0 h | 4 h | 8 h | 12 h | 24 h |
|---|---|---|---|---|---|
| miR-128 | 0.00 | –15.00 | 1.00 | –14.00 | –1.00 |
| miR-374a* | 0.00 | –4.00 | 0.00 | –6.00 | –2.00 |
| miR-181d | 0.00 | –7.00 | 1.00 | –6.00 | 5.00 |
| miR-942 | 0.00 | –13.00 | –2.00 | –15.00 | –5.00 |
| miR-140-3p | 0.00 | –16.00 | 1.00 | –17.00 | –4.00 |
| miR-142-3p | 0.00 | –39.00 | 89.00 | –62.00 | 75.00 |
| miR-27a* | 0.00 | –3.00 | 0.00 | –7.00 | 0.00 |
| miR-222 | 0.00 | –44.00 | –25.00 | –94.00 | –6.00 |
| miR-361-3p | 0.00 | –4.00 | –1.00 | –5.00 | 0.00 |
| miR-107 | 0.00 | –22.00 | 10.00 | –42.00 | 3.00 |
| miR-106b | 0.00 | –9.00 | 7.00 | –9.00 | 7.00 |
The bold miRNA are referenced in the text.
miRNAs belonging to Profile 12 are shown in Table 2. These miRNAs typically exhibited two peaks of repression in TK6 cells exposed to X-rays: one at the 4-h time-point and the other at the 12-h time-point. These miRNAs were induced at the 8-h and 24-h time-points. The top 10 miRNAs showing the greatest expression level alterations are shown in Fig. 3a. miR-222 remained repressed throughout the 24-h time period and its lowest level of expression was seen at the 12-h time-point. miR-142-3p and miR-107 were induced at the 8- and 24-h time-points after irradiation of TK6 cells.
Figure 3:

The expression of various miRNA in TK6 cells treated with a 2 Gy dose of X-rays. The expression was monitored at 0 h, 4 h, 8 h, 12 h and 24 h. The top 10 miRNA the showing highest levels of expression alterations are shown for six model profiles generated by the STEM clustering tool. (a) Profile 12, (b) Profile 15, (c) Profile 24, (d) Profile 27, (e) Profile 28, and (f) Profile 42.
Profile 15 miRNAs are summarized in Table 3. These miRNAs were induced at 8 h following exposure to IR and were repressed at the 4-h, 12-h and 24-h time-points (Fig. 3b). The top 10 miRNAs showing the greatest expression level alterations are shown in Fig. 3b. miR-378 had the highest level of induction at the 8-h time-point. The upregulation of miR-let-7a, miR-let-7g, miR-103b and miR-486-3p was also noticeable at the 8-h time-point after irradiation. miRNAs belonging to Profile 24 are included in Table 4. These miRNAs were typically repressed at the 4-h, 12-h and 24-h time-points after treatment of TK6 cells with radiation. The top 10 miRNAs showing the greatest expression level alterations are shown in Fig. 3c. miR-92a exhibited the highest level of repression among all the miRNAs clustered in this profile. miR-92a remained repressed throughout the 24-h time period and its lowest level of expression was seen at the 12h and 24h time-points. miR-423-5p, miR-4448, miR-3607-5p, miR-20b, and miR-130b were downregulated at the 4-h, 12-h and 24-h time-points, but were upregulated at the 8-h time-point after irradiation of TK6 cells (Table 4, Fig. 3c). miR-941 remained repressed throughout the 24-h time period and its lowest level of expression was seen at the 12-h time-point.
Table 3:
The expression analysis of various miRNA belonging to Profile 15 as assigned by the STEM clustering tool
| miRNA | 0 h | 4 h | 8 h | 12 h | 24 h |
|---|---|---|---|---|---|
| miR-625 | 0.00 | –7.00 | 7.00 | –7.00 | –4.00 |
| miR-486-3p | 0.00 | 1.00 | 20.00 | –9.00 | –8.00 |
| miR-330-3p | 0.00 | –5.00 | 1.00 | –6.00 | –4.00 |
| miR-424* | 0.00 | 1.00 | 8.00 | 0.00 | 0.00 |
| let-7g | 0.00 | –21.00 | 43.00 | –29.00 | –13.00 |
| miR-1307 | 0.00 | –6.00 | 2.00 | –9.00 | –8.00 |
| let-7a | 0.00 | –116.00 | 79.00 | –304.00 | –277.00 |
| miR-486-5p | 0.00 | –5.00 | 6.00 | –4.00 | –1.00 |
| miR-378 | 0.00 | –45.00 | 399.00 | –179.00 | –82.00 |
| miR-484 | 0.00 | –15.00 | 9.00 | –37.00 | –38.00 |
| miR-92a-1* | 0.00 | –29.00 | 16.00 | –48.00 | –40.00 |
| miR-151-5p | 0.00 | –17.00 | 6.00 | –25.00 | –13.00 |
| miR-103b | 0.00 | –21.00 | 26.00 | –30.00 | –8.00 |
The bold miRNA are referenced in the text.
Table 4:
The expression analysis of various miRNA belonging to Profile 24 as assigned by the STEM clustering tool
| miRNA | 0 h | 4 h | 8 h | 12 h | 24 h |
|---|---|---|---|---|---|
| miR-140-5p | 0.00 | 1.00 | 1.00 | –6.00 | –1.00 |
| miR-130b* | 0.00 | –12.00 | 5.00 | –29.00 | –22.00 |
| miR-941 | 0.00 | –8.00 | –15.00 | –42.00 | –27.00 |
| miR-20b | 0.00 | –6.00 | 9.00 | –47.00 | –31.00 |
| miR-191* | 0.00 | 3.00 | 6.00 | –5.00 | –5.00 |
| miR-3607-5p | 0.00 | –23.00 | 18.00 | –81.00 | –44.00 |
| miR-423-5p | 0.00 | –152.00 | 52.00 | –449.00 | –390.00 |
| miR-744 | 0.00 | –2.00 | 3.00 | –9.00 | –7.00 |
| miR-4448 | 0.00 | –13.00 | 172.00 | –341.00 | –268.00 |
| miR-125b | 0.00 | 5.00 | 12.00 | –24.00 | –17.00 |
| miR-92a | 0.00 | –3 835.00 | –1 455.00 | –9 545.00 | –9 017.00 |
| miR-18a | 0.00 | 3.00 | 5.00 | –7.00 | –3.00 |
| miR-320b | 0.00 | 6.00 | 5.00 | –15.00 | –13.00 |
The bold miRNA are referenced in the text.
The miRNAs categorized in Profile 27 are shown in Table 5. These miRNAs typically showed a pattern of induction at 8 h following exposure to IR, and repression at the 4-h and 12-h time-points (Figs. 1 and 3d). The top 10 miRNAs showing the highest levels of expression alterations are shown in Fig. 3d. miR-191 and miR-21 expressed two peaks of induction; one at 8 h and the other at 24 h. miR-191 and miR-21 were repressed at the 4-h and 12-h time-points after radiation treatment. miR-155 was initially repressed at the 4-h time-point and was induced later on. The maximum level of miR-155 induction was seen at 8 h after radiation treatment followed by a decline in its expression level at the 12-h time-point. miR-181a, miR-let-7f, miR-30d and miR-378c were only induced at 8 h but remained repressed at all the other time-periods. miR-26a and miR-182 were induced at 8 h and 24 h after irradiation.
Table 5:
The expression analysis of various miRNA belonging to Profile 27 as assigned by the STEM clustering tool
| miRNA | 0 h | 4 h | 8 h | 12 h | 24 h |
|---|---|---|---|---|---|
| miR-27b* | 0.00 | –2.00 | 11.00 | –9.00 | –5.00 |
| miR-181a | 0.00 | –326.00 | 827.00 | –607.00 | –138.00 |
| miR-4677-3p | 0.00 | 1.00 | 5.00 | –3.00 | 0.00 |
| miR-191 | 0.00 | –926.00 | 2 766.00 | –2 648.00 | 1 481.00 |
| miR-769-5p | 0.00 | –7.00 | 41.00 | –17.00 | 9.00 |
| miR-339-3p | 0.00 | 7.00 | 14.00 | –4.00 | 2.00 |
| miR-148a | 0.00 | –62.00 | 223.00 | –156.00 | 9.00 |
| miR-30b | 0.00 | 3.00 | 39.00 | –10.00 | 17.00 |
| miR-186 | 0.00 | –36.00 | 147.00 | –98.00 | 58.00 |
| miR-26b | 0.00 | –11.00 | 30.00 | –44.00 | 28.00 |
| let-7f | 0.00 | –120.00 | 374.00 | –393.00 | –164.00 |
| miR-15b | 0.00 | –4.00 | 75.00 | –20.00 | 23.00 |
| miR-361-5p | 0.00 | –2.00 | 4.00 | –6.00 | 1.00 |
| miR-30e* | 0.00 | 10.00 | 66.00 | –9.00 | 15.00 |
| miR-30d | 0.00 | –84.00 | 187.00 | –315.00 | –197.00 |
| miR-101 | 0.00 | 2.00 | 16.00 | –6.00 | 10.00 |
| miR-146b-5p | 0.00 | –21.00 | 92.00 | –47.00 | 63.00 |
| miR-98 | 0.00 | –1.00 | 10.00 | –5.00 | 4.00 |
| miR-625* | 0.00 | 1.00 | 5.00 | –5.00 | –1.00 |
| let-7c | 0.00 | –23.00 | 56.00 | –46.00 | 23.00 |
| miR-103a | 0.00 | 7.00 | 30.00 | –19.00 | 11.00 |
| miR-17 | 0.00 | –2.00 | 10.00 | –16.00 | 9.00 |
| miR-454 | 0.00 | 1.00 | 12.00 | –3.00 | 5.00 |
| miR-181b | 0.00 | –66.00 | 216.00 | –149.00 | 38.00 |
| miR-21 | 0.00 | –81.00 | 2 456.00 | –1 050.00 | 647.00 |
| miR-19a | 0.00 | 5.00 | 22.00 | –10.00 | 9.00 |
| miR-425 | 0.00 | –15.00 | 25.00 | –27.00 | 0.00 |
| miR-363 | 0.00 | 14.00 | 173.00 | –83.00 | 116.00 |
| miR-26a | 0.00 | –102.00 | 324.00 | –301.00 | 164.00 |
| miR-378c | 0.00 | –56.00 | 251.00 | –214.00 | –49.00 |
| miR-15b* | 0.00 | 0.00 | 5.00 | –2.00 | 3.00 |
| miR-25 | 0.00 | –51.00 | 159.00 | –147.00 | 74.00 |
| miR-23a | 0.00 | –1.00 | 10.00 | –4.00 | 5.00 |
| miR-421 | 0.00 | 0.00 | 3.00 | –8.00 | –2.00 |
| miR-151-3p | 0.00 | –10.00 | 17.00 | –25.00 | –4.00 |
| miR-148b | 0.00 | 0.00 | 43.00 | –32.00 | 16.00 |
| miR-30d* | 0.00 | 5.00 | 16.00 | –7.00 | 10.00 |
| miR-21* | 0.00 | –14.00 | 416.00 | –97.00 | 114.00 |
| miR-155 | 0.00 | –532.00 | 1 588.00 | –1 778.00 | 41.00 |
| miR-27b | 0.00 | –78.00 | 372.00 | –143.00 | 142.00 |
| let-7i | 0.00 | –15.00 | 54.00 | –18.00 | 19.00 |
| miR-3609 | 0.00 | 3.00 | 8.00 | 0.00 | 1.00 |
| miR-30c | 0.00 | –3.00 | 60.00 | –49.00 | 33.00 |
| miR-181c | 0.00 | –2.00 | 3.00 | –8.00 | 1.00 |
| miR-182 | 0.00 | 2.00 | 586.00 | –224.00 | 256.00 |
| miR-20a | 0.00 | 18.00 | 41.00 | –35.00 | –9.00 |
The bold miRNA are referenced in the text.
The miRNAs belonging to Profile 28 are summarized in Table 6. These miRNAs typically exhibited two peaks of upregulation; one at the 8-h time-point and the other at the 24-h time-point in TK6 cells exposed to X-rays. These miRNAs were repressed at the 4-h and 12-h time-points. The top 10 miRNAs showing the highest levels of expression level alterations are shown in Fig. 3e. The level of miR-16, miR-146a, and miR-22 modulation during the 24-h time-course experiment was much greater than that of other miRNA in this profile.
Table 6:
The expression analysis of various miRNA belonging to Profile 28 as assigned by the STEM clustering tool
| miRNA | 0 h | 4 h | 8 h | 12 h | 24 h |
|---|---|---|---|---|---|
| miR-16 | 0.00 | –117.00 | 542.00 | –390.00 | 473.00 |
| miR-99a | 0.00 | –7.00 | 62.00 | –5.00 | 61.00 |
| miR-183* | 0.00 | 0.00 | 2.00 | 0.00 | 5.00 |
| miR-130b | 0.00 | 0.00 | 43.00 | –12.00 | 45.00 |
| miR-29c | 0.00 | 0.00 | 5.00 | 0.00 | 7.00 |
| miR-146a | 0.00 | –111.00 | 266.00 | –261.00 | 421.00 |
| miR-221* | 0.00 | 0.00 | 11.00 | 1.00 | 21.00 |
| miR-17* | 0.00 | –4.00 | 19.00 | –6.00 | 21.00 |
| miR-183 | 0.00 | –22.00 | 30.00 | –6.00 | 87.00 |
| miR-22 | 0.00 | –5.00 | 107.00 | –31.00 | 112.00 |
| miR-192 | 0.00 | –10.00 | 37.00 | –19.00 | 30.00 |
| miR-221 | 0.00 | –2.00 | 19.00 | –9.00 | 23.00 |
| miR-143 | 0.00 | 1.00 | 23.00 | 4.00 | 29.00 |
| miR-30a | 0.00 | –5.00 | 22.00 | –11.00 | 49.00 |
| miR-34a | 0.00 | –7.00 | 11.00 | –4.00 | 20.00 |
| miR-181a* | 0.00 | –11.00 | 80.00 | –16.00 | 70.00 |
| miR-15a | 0.00 | –9.00 | 22.00 | –4.00 | 17.00 |
The bold miRNA are referenced in the text.
Table 7 shows the STEM-assigned miRNA in Profile 42. Most of these miRNAs were initially induced at the 4-h time-point and continued with the upregualtion that was observed until 8 h following radiation exposure. There was a noticeable decline in the expression levels of this set of miRNAs at the 12-h time-point. These miRNAs were induced again at the 24-h time-point. The top 10 miRNAs showing the highest levels of expression alterations are shown in Fig. 3f. miR-30e and miR-142-5p showed two peaks of upregulation; one at the 8-h time-point and the other at the 24-h time-point in TK6 cells exposed to X-rays. miR-19b and miR-93 were induced at 4 h, 8 h and 24 h post-irradiation of TK6 cells.
Table 7:
The expression analysis of various miRNA belonging to Profile 42 as assigned by the STEM clustering tool
| miRNA | 0 h | 4 h | 8 h | 12 h | 24 h |
|---|---|---|---|---|---|
| miR-30c-1* | 0.00 | 4.00 | 36.00 | 5.00 | 21.00 |
| miR-27a | 0.00 | –10.00 | 54.00 | –13.00 | 41.00 |
| miR-500a* | 0.00 | 3.00 | 12.00 | –1.00 | 9.00 |
| miR-142-5p | 0.00 | –14.00 | 506.00 | –82.00 | 414.00 |
| miR-19b | 0.00 | 7.00 | 91.00 | –18.00 | 56.00 |
| miR-181c* | 0.00 | 2.00 | 5.00 | 3.00 | 5.00 |
| miR-93 | 0.00 | 21.00 | 69.00 | –11.00 | 50.00 |
| miR-330-5p | 0.00 | 2.00 | 8.00 | –1.00 | 7.00 |
| miR-181a-2* | 0.00 | 1.00 | 36.00 | –6.00 | 18.00 |
| miR-106a | 0.00 | 5.00 | 11.00 | 2.00 | 6.00 |
| let-7f-2* | 0.00 | 0.00 | 5.00 | 0.00 | 2.00 |
| miR-34c-5p | 0.00 | 3.00 | 12.00 | 5.00 | 6.00 |
| miR-125b-2* | 0.00 | –15.00 | 60.00 | –19.00 | 31.00 |
| miR-29a | 0.00 | –4.00 | 22.00 | –4.00 | 13.00 |
| miR-23b | 0.00 | 0.00 | 8.00 | 0.00 | 2.00 |
| miR-301a | 0.00 | 2.00 | 20.00 | 0.00 | 15.00 |
| miR-30e | 0.00 | 65.00 | 595.00 | –70.00 | 431.00 |
The bold miRNA are referenced in the text.
As a proof of principle we validated the expression alterations of a few miRNA including miR-142-3p, miR-let7a, miR-21, miR-155, miR-16 and miR-142-5p with real-time PCR (Fig. 4). The relative expression of these miRNA was determined, as we have previously described [23]. The real-time PCR data confirmed the patterns of miRNA expression changes as observed by deep sequencing methodology.
Figure 4:
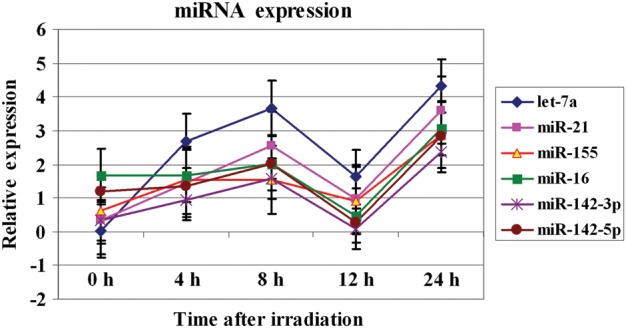
Real-time PCR analysis of the expression changes of various miRNA in irradiated TK6. Commercially available assays on demands for these miRNA were purchased from Applied Biosystems Inc. The cells were treated with a 2 Gy X-ray dose, and the miRNA expression relative to sham-irradiated controls, shown as Log2 transformed values, was computed at 0-h, 4-h, 8-h, 12-h and 24-h time-points. The error bars indicate the standard error of the mean (SEM) for three replicates.
DISCUSSION
Advances in miRNA expression analysis
Technological advances have spawned a multitude of platforms for miRNA expression profiling [31]. Techniques for quantification of miRNA include real-time PCR-based analysis, which involves the hybridization of a stem–loop RT primer to the 3' end of miRNA and reverse transcription [32]. The RT products are quantified using conventional TaqMan PCR that includes an miRNA-specific forward primer, a reverse primer and a dye-labeled TaqMan probe [32]. The purpose of the tailed forward primer at 5' is to increase its melting temperature (Tm) dependent on the sequence composition of miRNA molecules.
Profiling experiments, using microarray or deep-sequencing technology have also been performed. The improvements in the design and chemistry of microarrays have led to the generation of high quality data. Previously microarrays by different manufacturers produced results that differed between samples. The readout by different laser scanners showed variations in terms of reproducibility of results. Subsequently the development of experimental and computational methods provided solutions to deal with variation in the data. The inherent biases in the microarrays are now understood, and analytical solutions have made microarrays as a popular choice for detecting miRNA levels. The dramatic reduction in the cost of performing microarray experiments has made this platform affordable. Instead of using hybridization to detect miRNA, deep sequencing samples miRNA by direct sequencing. Since the deep-sequencing analysis avoids the inclusion of traditional probe-target hybridization, the resultant data is cleaner and more reliable.
Deep sequencing utilizes MPS, generating millions of small RNA sequence reads from a given sample. The tools and methodologies for the analysis of miRNA expression data from deep sequencing have been discussed in detail [33]. Profiling of miRNAs by deep sequencing measures absolute abundance. MPS strategies allow the simultaneous ‘reading’ of sequences of millions of cDNAs derived from small RNA fragments. The MPS technology involves universal oligonucleotides that are physically anchored to a fixed surface inside lanes of a ‘flowcell.’ A small RNA library is first prepared by enzymatically ligating 5' and 3' adapters to small RNA molecules, and then enriched by 10–15 cycles of PCR using primers that contain sequences homologous to these adapters and complementary to the oligos on the flow cell surface. In the final library construct, the 5' end contains a sequencing primer-binding sequence. Once completed, a small RNA library can be loaded into one or more flowcell lanes and, by bridge amplification, produce clusters comprising double-stranded DNA, each derived from a single template molecule. Each cluster is individually sequenced in parallel by the successive addition of the four-nucleoside triphosphates. These nucleotides have a 3' reversible terminator moiety that is also a fluorophore. This prevents successive incorporation of multiple nucleotides in polynucleotide tracts. Images of the laser-excited fluorophores are captured after each nucleotide addition step, and then the fluorophore is chemically cleaved to allow further extension reactions. An overlay of all images collected during this process is used to produce full-length sequence reads. Because the diversity of the microRNAome is much less than the number of reads, many identical sequences are produced (and can be considered multiple observations). By considering each read as a single observation of a molecule of that miRNA, MPS data provide the expression profile of a sample. Alignment softwares, such as BWA or Novoalign, are capable of rapidly finding optimal alignments in the human genome [34]. In order to gain genome-wide assessment of the miRNA transcriptome, we employed MPS to profile radiation-modulated miRNA in human cells.
Responses of miRNA in radiation-exposed TK6 cells
We investigated the response of miRNA after exposure of TK6 cells to a 2 Gy X-ray dose. The TK6 cell line is a popular experimental model to examine the effects of IR. A large number of investigators have used these cells for a variety of radiobiology studies and have generated substantial data. Our laboratory has published many papers using TK6 cells. Most recently we examined the miRNA expression in these cells. It is thus reasonable to use TK6 cells for our current and future studies. We have chosen a 2 Gy radiation dose to mimic clinical therapeutic doses. Cancer patients receiving external beam radiotherapy (EBRT) are administrated 2 Gy fractionated doses. Furthermore, previous studies published from our laboratory utilized a 2 Gy dose for miRNA expression analysis. Using a 2 Gy dose used in the present study allows us to correlate the current data to our other studies.
miRNAs play an important role in regulation of the cellular network; some miRNAs target highly evolutionarily conserved signal transduction pathways, which are important for cellular development and maturity. Each miRNA has the potential to bind at thousands of different loci, and each gene may be regulated by hundreds of different miRNA [35]. Our aim was to examine the time-dependent IR effect on miRNA expression. Large-scale alterations in the miRNA levels were identified. We found that miR-222 was repressed after IR exposure of TK6 cells (Table 2, Fig. 3a). Recently it was shown that the expression of miR-222 was changed in TK6 cells subjected to a simulated microgravity condition [36]. miR-222 induces cell growth and cell cycle progression via direct targeting of p27 and p57 in various human malignancies, and has been shown to regulate radiosensitivity, cell growth and invasion, via direct modulation of PTEN expression [37]. miR-222 is differentially expressed in pancreatic tumors, and elevated expression of miR-222 is associated with poor survival [38]. miR-142-3p, miR-107 and miR-106b were induced at the 8- and 24-h time-points after irradiation of TK6 cells (Table 2, Fig. 3a). miR-107 has been shown to function as a tumor suppressor [39]. miR-142-3p is upregulated in glioblastoma cells treated with X-rays [24]. Altered expression of miR-106b has been shown in response to radiation. Down-regulation of miR-106b is involved in p21-mediated cell cycle arrest in response to radiation. miR-106b regulates p21-activated cell cycle arrest and is able to override radiation-induced cell cycle arrest and cell growth inhibition [40].
Our data shows that miR-378 was induced at 8 h after IR exposure (Table 3, Fig. 3b). miR-378 has shown to be a tumor suppressor [41]. miR-let-7a, miR-let-7g, miR-103b and miR-486-3p were also induced at 8 h post-irradiation (Table 3, Fig. 3b). miR-486-3p is differentially expressed in pancreatic ductal adenocarcinomas [42]. miR-let-7a and miR-let-7g belong to the let-7 miRNA family. The let-7 family of miRNA are negative regulators of the rat sarcoma, RAS oncogene [43]. RAS proteins receive signals from cell surface receptors, such as growth factor receptors. Downregulation of the RAS gene is strongly associated with a poor prognosis in lung, pancreatic and colon cancer patients [44]. The expression levels of the let-7 family miRNAs are downregulated in gamma-radiation exposed cells [22]. miR-7 targets epidermal growth factor receptor (EGFR) and genes associated with the thymoma viral oncogene (Akt) pathway, insulin receptor substrate 1 (IRS-1) and insulin receptor substrate 2 (IRS-2) [45]. miR-92a and miR-941 were repressed in X-ray-treated cells (Table 4, Fig. 3c). miR-92a is part of the miR-1792 cluster, which has been linked to tumorigenesis. Downregulation of miR-92a is associated with breast cancer [46]. miR-423-5p, miR-4448, miR-3607-5p, miR-20b and miR-130b were downregulated at the 4-h, 12-h and 24-h time-points but were upregulated at the 8-h time-point after irradiation of TK6 cells (Table 4, Fig. 3c). It has been shown that the expression levels of miR-423-5p change in TK6 cells subjected to a simulated microgravity condition [36]. miR-20b modulates vascular endothelial growth factor (VEGF) expression by targeting hypoxia inducible factor 1 (HIF-1) alpha as well as signal transducer and activator of transcription 3 (STAT3) in MCF-7 breast cancer cells [47]. miR-130b is regulated by BCR-ABL [48].
Our data indicated that some miRNAs, for instance, miR-191 and miR-21, expressed two peaks of induction; one at 8 h and the other at 24 h after IR treatment (Table 5, Fig. 3d). miR-21 is an antiapoptotic factor expressed in glioblastoma, breast and lung cancer [49]. High expression of miR-21 is also correlated with a worse prognosis of adenocarcinoma [49]. miR-21 is a negative regulator of the hPDCD4 gene, which is fundamental in programmed cell death. Previous studies have shown that miR-21 is upregulated in radiation-treated cells [6, 23]. Another microRNA miR-155 was induced at 8 h after radiation treatment in the current study. miR-155 is differentially expressed in pancreatic tumors compared to normal tissues and elevated expression of these miRNA are associated with poor survival [38]. miR-181, miR-let-7f, miR-30d and miR-378c were also only induced at 8 h (Table 5, Fig. 3d). miR-181a is a member of the miR-181 family. This miRNA is downregulated in glioma cells in response to radiation treatment. It was suggested that miR-181a modulates radiosensitivity by targeting BCL-2 [50]. miR-26a and miR-182 were induced at 8 h and 24 h after irradiation (Table 5, Fig. 3d). The role of miR-182 is becoming clear in the radiation-induced stress response. BRCA1 transcripts are selectively enriched in the Argonaute/miR-182 complex and miR-182 downregulates BRCA1 expression. Antagonizing miR-182 enhances BRCA1 protein levels and provides protection from IR-induced cell death, while overexpressing miR-182 reduces BRCA1 protein, impairs homologous recombination-mediated repair, and renders cells hypersensitive to IR [51]. The expression pattern of miR-142-3p (Fig. 3a) was similar to that of the miRNA shown in Fig. 3d.
The expression of miR-16, miR-146a, and miR-22 was induced at 8 h and 24 h times post-irradiation (Table 6, Fig. 3e). miR-16 negatively regulates B-cell lymphoma 2 (BCL2) [52], which has been implicated in the radiation response of TK6 cells [53]. It is shown here that hepatocellular carcinoma cells express higher levels of miR-16, and lower levels of BCL-2. miR-22 is involved in the cellular response to UV radiation and promotes cell survival via the repression of PTEN expression [54]. UV radiation induces an increase of miR-22 expression, which is dependent on the activation of DNA damage responding kinase ATM (ataxia telangiectasia mutated). The tumor suppressor gene phosphatase and tensin homolog (PTEN) expression was inversely correlated with miR-22 induction. Moreover, increased miR-22 expression inhibited the activation of the caspase signaling cascade, leading to enhanced cell survival after UV radiation. A recent study identified that the expression of miR-22 was changed in TK6 cells subjected to simulated microgravity conditions [36]. There were similarities in the expression pattern of miRNA shown in Fig. 3d and 3e.
miR-30e and miR-142-5p showed two peaks of upregulation; one at the 8-h time-point and the other at the 24-h time-point (Table 7, Fig. 3f). Previous studies have shown that miR-142-5p is upregulated in IR-treated glioblastoma cells [24]. miR-19b and miR-93 were induced in irradiated TK6 cells (Table 7, Fig. 3f). It has been reported that miR-19b is induced in radiation-exposed cells [24]. It is shown here that induction of miR-93 expression and reduced p53 binding to p21 gene promoter accounts for loss of p21 (sdi1) expression in senescent cells after DNA damage [55].
miRNA expression patterns are useful in delineating biologic alterations as well as being prognostic factors in many diseases. miRNAs are involved in the normal functioning of cells, and the dysregulation of miRNA can be associated with the cellular response under stress conditions, such as exposure to IR. We found that miRNAs are deregulated in human cells treated with IR. The patterns of dysregulation of the miRNAs identified in this study might be a feature defining the fate of the irradiated cells. An aberrant expression of miRNA in many cancers is not just a random association, but is important in different steps of the tumorigenic process. Different regulatory mechanisms can control miRNA expression and may involve the biogenesis machinery or the recruitment of specific transcription factors. The tumorigenic process implies a substantial alteration of these mechanisms, and disruption of the equilibrium within the cell leading to a global change in miRNA expression.
Validation of previously identified ionizing radiation-modulated miRNA
In addition to discovering new miRNA responding to IR treatment, the MPS data on IR-induced miRNA expression alterations in this study confirmed earlier studies (Table 8). The current data revealed expression changes in the let-7 family of miRNA. Previous studies identified that the expression of miRNA belonging to the let-7 family was upregulated in irradiated TK6 cells. [23]. The data obtained in the current study with next-generation deep sequencing technology confirmed the earlier studies (Table 8).
Table 8:
Validation of the radiation-induced miRNA by deep sequencing or real-time PCR platforms
| miRNA | Deep Sequencing Analysis | Expression trend | Real-time PCR analysis [Reference] | Expression trend |
|---|---|---|---|---|
| miR-let-7a | Table 2 | ↑ 8 ha | [23] | ↑ |
| miR-let-7g | Table 2 | ↑ 8 ha | [23] | ↑ |
| miR-let-7c | Table 4 | ↑ 8 ha | [23] | ↑ |
| miR-let-7f | Table 4 | ↑ 8 ha | [23] | ↑ |
| miR-18a | Table 3 | ↑ 4 h, 8 ha | [22, 23] | ↑ |
| miR-21 | Table 4 | ↑ 8 h, 24 ha | [24, 12] | ↑b |
| miR-19a | Table 4 | ↑ 4 h, 8 h, 24 ha | [22, 23] | ↑ |
| miR-155 | Table 4 | ↑ 8 h, 24 ha | [23] | ↑b |
| miR-16 | Table 5 | ↑ 8 h, 24 ha | [23] | ↑b |
| miR-143 | Table 5 | ↑ 8 h, 24 ha | [23] | ↑b |
| miR-15a | Table 5 | ↑ 8 h, 24 ha | [23] | ↑b |
| miR-142-5p | Table 6 | ↑ 8 h, 24 ha | [22, 23] | ↑ |
| miR-19b | Table 6 | ↑ 4 h, 8 h, 24 ha | [22, 23] | ↑ |
aDownregulation was observed at other times.
bUpregulation was seen at lower radiation dose.
In this study we identified the upregulation of miR-18a (Table 4; Profile 24), miR-19a (Table 5; Profile 27), miR-19b and miR-142-5p (Table 7; Profile 42) in irradiated TK6 cells. These miRNA are involved in c-MYC gene regulation. This data has corroborated previous studies where it was shown that these miRNA were upregulated in X-ray-treated TK6 cells [23]. Other studies from our laboratory have also shown that the expression of miRNA associated with the c-MYC translocation is upregulated in TK6 cells exposed to gamma-radiation [22]. Studies on the proto-oncogene c-MYC support its regulation of 15% of all gene expression, including genes involved in cell division, cell growth and apoptosis [19]. The c-MYC induces a cluster of miRNA known as miR-17-92 including miR-17-5p, miR-17-3p, miR-18a, miR-19a, miR-20a, miR-19b,and miR-92-1. This cluster is amplified in B cell lymphomas and other cancers [5,6]. Induced expression of c-MYC has been correlated with accelerated tumor development, and many studies support the miR-17-92 cluster as being a potential human oncogene. Overexpressed miR-18a and miR-19a are found in lung cancers and B-cell lymphomas, and they can also accelerate tumor progression in B-cell lymphoma and play a role in angiogenesis [56]. A recent study identified downregulation of miR-19a in radiation-treated HCT116 cells [57].
The negative regulator of B cell lymphoma miR-15a is downregulated in chronic lymphocytic leukemia (CLL), the most common adult human leukemia [52, 58]. This miRNA targets the myeloblastosis viral oncogene homolog (MYB), a gene that is directly involved in myeloid, lymphoid and mixed-lineage leukemia [59]. We observed the upregulation of miR-15a and miR-16 (Table 6; Profile 28) in X-ray-treated TK6 cells. Other studies have reported dose-dependent upregulation of these miRNAs in irradiated TK6 cells (Table 8) [23].
miR-143 (Table 6; Profile 28), miR-155 and miR-21 (Table 5; Profile 27) were upregulated in radiation-treated TK6 cells. Other studies have reported the induction of miR-143, miR-155 and miR-21 in irradiated TK6 cells [23] (Table 8). miR-143 regulates connective tissue growth factor and its expression correlates with adipocyte differentiation and carcinogenesis [60]. The expression of miR-145 and miR-155 has been reported to alter in lung cancers and has been correlated to patient survival [49].
CONCLUSION
The correlation between IR exposure and carcinogenesis is well known. An understanding of the process behind this relationship will enable estimation of risks and prevention of cancer from environmental and occupational exposures. The cellular damage response to IR exposure involves a complex network of events required for maintaining the homeostasis and restoring genomic stability of the cells. Changes in the expression profile of many genes have been identified that could lead to the disruption of cellular homeostasis. The modulation of miRNA could be responsible for large-scale gene expression alterations leading to radiation-induced cellular effects. Our comprehensive catalogue of miRNA expression changes in TK6 cells indicate that miRNA plays a global role in regulating the response of lymphoblastoid cells following exposure to IR. Similar expression patterns of multiple miRNAs suggest common functions in IR-induced pathways. It is possible that the function of most miRNAs is to refine gene expression, and thus give cells more flexibility and the ability to respond quickly to environmental changes.
FUNDING
M.A.C. is supported by an endowment fund from the College of Nursing and Health Sciences, University of Vermont. N.P. is supported by NIH grant P01-35HG000205.
ACKNOWLEDGEMENTS
We thank Dr Howard Liber, Colorado State University, Fort Collins, CO, USA, for providing TK6 cells.
REFERENCES
- 1.Spitz DR, Azzam EI, Li JJ, et al. Metabolic oxidation/reduction reactions and cellular responses to ionizing radiation: a unifying concept in stress response biology. Cancer Metast Rev. 2004;23:311–22. doi: 10.1023/B:CANC.0000031769.14728.bc. [DOI] [PubMed] [Google Scholar]
- 2.Chaudhry MA. Bystander effect: biological endpoints and microarray analysis. Mutat Res. 2006;597:98–112. doi: 10.1016/j.mrfmmm.2005.04.023. [DOI] [PubMed] [Google Scholar]
- 3.Chaudhry MA, Omaruddin RA. Mitochondrial gene expression in directly irradiated and nonirradiated bystander cells. Cancer Biother Radiopharm. 2011;26:657–63. doi: 10.1089/cbr.2010.0940. [DOI] [PubMed] [Google Scholar]
- 4.Chaudhry MA, Omaruddin RA. Transcriptional changes of mitochondrial genes in irradiated cells proficient or deficient in p53. J Genet. 2012;91:105–10. doi: 10.1007/s12041-012-0138-6. [DOI] [PubMed] [Google Scholar]
- 5.Chaudhry MA, Omaruddin RA. Differential DNA methylation alterations in radiation-sensitive and -resistant cells. DNA Cell Biol. 2012;31:908–16. doi: 10.1089/dna.2011.1509. [DOI] [PubMed] [Google Scholar]
- 6.Chaudhry MA, Omaruddin RA, Kreger B, et al. Micro RNA responses to chronic or acute exposures to low dose ionizing radiation. Mol Biol Rep. 2012;39:7549–58. doi: 10.1007/s11033-012-1589-9. [DOI] [PMC free article] [PubMed] [Google Scholar]
- 7.Chaudhry MA. Base excision repair of ionizing radiation-induced DNA damage in G1 and G2 cell cycle phases. Cancer Cell Int. 2007;7:15. doi: 10.1186/1475-2867-7-15. [DOI] [PMC free article] [PubMed] [Google Scholar]
- 8.Chaudhry MA. Biomarkers for human radiation exposure. J Biomed Sci. 2008;15:557–63. doi: 10.1007/s11373-008-9253-z. [DOI] [PubMed] [Google Scholar]
- 9.Chaudhry MA. Radiation-induced gene expression profile of human cells deficient in 8-hydroxy-2'-deoxyguanine glycosylase. Int J Cancer. 2006;118:633–42. doi: 10.1002/ijc.21392. [DOI] [PubMed] [Google Scholar]
- 10.Chaudhry MA. Analysis of gene expression in normal and cancer cells exposed to gamma-radiation. J Biomed Biotechnol. 2008;2008:541678. doi: 10.1155/2008/541678. [DOI] [PMC free article] [PubMed] [Google Scholar]
- 11.Chaudhry MA. Strategies for detecting genomic DNA methylation: a survey of US patents. Recent Pat DNA Gene Seq. 2010;4:79–85. doi: 10.2174/187221510793205719. [DOI] [PubMed] [Google Scholar]
- 12.Omaruddin RA, Chaudhry MA. Detection of genomic DNA methylation with denaturing high performance liquid chromatography. Hum Cell. 2010;23:41–9. doi: 10.1111/j.1749-0774.2010.00084.x. [DOI] [PubMed] [Google Scholar]
- 13.Lhakhang TW, Chaudhry MA. Current approaches to micro-RNA analysis and target gene prediction. J Appl Genet. 2012;53:149–58. doi: 10.1007/s13353-011-0060-2. [DOI] [PubMed] [Google Scholar]
- 14.Lhakhang TW, Chaudhry MA. Interactome of radiation-induced microRNA-predicted target genes. Comp Funct Genomics. 2012;2012:569731. doi: 10.1155/2012/569731. [DOI] [PMC free article] [PubMed] [Google Scholar]
- 15.Olsen PH, Ambros V. The lin-4 regulatory RNA controls developmental timing in Caenorhabditis elagans by blocking LIN-14 protein synthesis after the initiation of translation. Dev Biol. 1999;216:671–80. doi: 10.1006/dbio.1999.9523. [DOI] [PubMed] [Google Scholar]
- 16.Fabian MR, Sonenberg N. The mechanics of miRNA-mediated gene silencing: a look under the hood of miRISC. Nat Struct Mol Biol. 2012;19:586–93. doi: 10.1038/nsmb.2296. [DOI] [PubMed] [Google Scholar]
- 17.Iorio MV, Croce CM. microRNA involvement in human cancer. Carcinogenesis. 2012;33:1126–33. doi: 10.1093/carcin/bgs140. [DOI] [PMC free article] [PubMed] [Google Scholar]
- 18.Cho W. OncomiRs: the discovery and progress of microRNAs in cancers. Mol Cancer. 2007;6:60. doi: 10.1186/1476-4598-6-60. [DOI] [PMC free article] [PubMed] [Google Scholar]
- 19.Xi Y, Edwards JR, Ju J. Investigation of miRNA biology by bioinformatic tools and impact of miRNAs in colorectal cancer-regulatory relationship of c-Myc and p53 with miRNAs. Cancer Inform. 2007;3:245–53. [PMC free article] [PubMed] [Google Scholar]
- 20.Sokolov MV, Panyutin IV, Neumann RD. Unraveling the global microRNAome responses to ionizing radiation in human embryonic stem cells. PLoS One. 2012;7 doi: 10.1371/journal.pone.0031028. e31028. [DOI] [PMC free article] [PubMed] [Google Scholar]
- 21.Templin T, Paul S, Amundson SA, et al. Radiation-induced micro-RNA expression changes in peripheral blood cells of radiotherapy patients. Int J Radiat Oncol Biol Phys. 2012;80:549–57. doi: 10.1016/j.ijrobp.2010.12.061. [DOI] [PMC free article] [PubMed] [Google Scholar]
- 22.Chaudhry MA. Real-time PCR analysis of micro-RNA expression in ionizing radiation-treated cells. Cancer Biother Radiopharm. 2009;24:49–56. doi: 10.1089/cbr.2008.0513. [DOI] [PubMed] [Google Scholar]
- 23.Chaudhry MA, Kreger B, Omaruddin RA. Transcriptional modulation of micro-RNA in human cells differing in radiation sensitivity. Int J Radiat Biol. 2010;86:569–83. doi: 10.3109/09553001003734568. [DOI] [PubMed] [Google Scholar]
- 24.Chaudhry MA, Sachdeva H, Omaruddin RA. Radiation-induced micro-RNA modulation in glioblastoma cells differing in DNA-repair pathways. DNA Cell Biol. 2010;29:553–61. doi: 10.1089/dna.2009.0978. [DOI] [PubMed] [Google Scholar]
- 25.Griffiths-Jones S. The microRNA Registry. Nucleic Acids Res. 2004;32:D109–11. doi: 10.1093/nar/gkh023. [DOI] [PMC free article] [PubMed] [Google Scholar]
- 26.Griffiths-Jones S, Grocock RJ, van Dongen S, et al. miRBase: microRNA sequences, targets and gene nomenclature. Nucleic Acids Res. 2006;34:D140–4. doi: 10.1093/nar/gkj112. [DOI] [PMC free article] [PubMed] [Google Scholar]
- 27.Griffiths-Jones S, Saini HK, van Dongen S, et al. miRBase: tools for microRNA genomics. Nucleic Acids Res. 2008;36 doi: 10.1093/nar/gkm952. D154–8. [DOI] [PMC free article] [PubMed] [Google Scholar]
- 28.Kozomara A, Griffiths-Jones S. miRBase: integrating microRNA annotation and deep-sequencing data. Nucleic Acids Res. 2011;39 doi: 10.1093/nar/gkq1027. D152–7. [DOI] [PMC free article] [PubMed] [Google Scholar]
- 29.Langmead B, Trapnell C, Pop M, et al. Ultrafast and memory-efficient alignment of short DNA sequences to the human genome. Genome Biol. 2009;10 doi: 10.1186/gb-2009-10-3-r25. R25. [DOI] [PMC free article] [PubMed] [Google Scholar]
- 30.Ernst J, Bar-Joseph Z. STEM: a tool for the analysis of short time series gene expression data. BMC Bioinformatics. 2006;7:191. doi: 10.1186/1471-2105-7-191. [DOI] [PMC free article] [PubMed] [Google Scholar]
- 31.Pritchard CC, Cheng HH, Tewari M. MicroRNA profiling: approaches and considerations. Nat Rev Genet. 2012;13:358–69. doi: 10.1038/nrg3198. [DOI] [PMC free article] [PubMed] [Google Scholar]
- 32.Chen C, Ridzon DA, Broomer AJ, et al. Real-time quantification of microRNAs by stem-loop RT-PCR. Nucleic Acids Res. 2005;33 doi: 10.1093/nar/gni178. e179. [DOI] [PMC free article] [PubMed] [Google Scholar]
- 33.Creighton CJ, Reid JG, Gunaratne PH. Expression profiling of microRNAs by deep sequencing. Brief Bioinform. 2009;10:490–7. doi: 10.1093/bib/bbp019. [DOI] [PMC free article] [PubMed] [Google Scholar]
- 34.Li H, Durbin R. Fast and accurate short read alignment with Burrows-Wheeler transform. Bioinformatics. 2009;25:1754–60. doi: 10.1093/bioinformatics/btp324. [DOI] [PMC free article] [PubMed] [Google Scholar]
- 35.Bartel DP. MicroRNAs: genomics, biogenesis, mechanism, and function. Cell. 2004;116:281–97. doi: 10.1016/s0092-8674(04)00045-5. [DOI] [PubMed] [Google Scholar]
- 36.Mangala LS, Zhang Y, He Z, et al. Effects of simulated microgravity on expression profile of microRNA in human lymphoblastoid cells. J Biol Chem. 2011;286:32483–90. doi: 10.1074/jbc.M111.267765. [DOI] [PMC free article] [PubMed] [Google Scholar]
- 37.Chun-Zhi Z, Lei H, An-Ling Z, et al. MicroRNA-221 and microRNA-222 regulate gastric carcinoma cell proliferation and radioresistance by targeting PTEN. BMC Cancer. 2010;10:367. doi: 10.1186/1471-2407-10-367. [DOI] [PMC free article] [PubMed] [Google Scholar]
- 38.Greither T, Grochola LF, Udelnow A, et al. Elevated expression of microRNAs 155, 203, 210 and 222 in pancreatic tumors is associated with poorer survival. Int J Cancer. 2010;126:73–80. doi: 10.1002/ijc.24687. [DOI] [PubMed] [Google Scholar]
- 39.Datta J, Smith A, Lang JC, et al. microRNA-107 functions as a candidate tumor-suppressor gene in head and neck squamous cell carcinoma by downregulation of protein kinase Cvarepsilon. Oncogene. 2012;31:4045–53. doi: 10.1038/onc.2011.565. [DOI] [PMC free article] [PubMed] [Google Scholar]
- 40.Li B, Shi XB, Nori D, et al. Down-regulation of microRNA 106b is involved in p21–mediated cell cycle arrest in response to radiation in prostate cancer cells. Prostate. 2011;71:567–74. doi: 10.1002/pros.21272. [DOI] [PubMed] [Google Scholar]
- 41.Faltejskova P, Svoboda M, Srutova K, et al. Identification and functional screening of microRNAs highly deregulated in colorectal cancer. J Cell Mol Med. 2012;16:2655–66. doi: 10.1111/j.1582-4934.2012.01579.x. [DOI] [PMC free article] [PubMed] [Google Scholar]
- 42.Yu J, Li A, Hong SM, et al. MicroRNA alterations of pancreatic intraepithelial neoplasias. Clin Cancer Res. 2012;18:981–92. doi: 10.1158/1078-0432.CCR-11-2347. [DOI] [PMC free article] [PubMed] [Google Scholar]
- 43.Johnson SM, Grosshans H, Shingara J, et al. RAS is regulated by the let-7 microRNA family. Cell. 2005;120:635–47. doi: 10.1016/j.cell.2005.01.014. [DOI] [PubMed] [Google Scholar]
- 44.Goodsell DS. The molecular perspective: the ras oncogene. Oncologist. 1999;4:263–4. [PubMed] [Google Scholar]
- 45.Kefas B, Godlewski J, Comeau L, et al. microRNA-7 inhibits the epidermal growth factor receptor and the Akt pathway and is down-regulated in glioblastoma. Cancer Res. 2008;68:3566–72. doi: 10.1158/0008-5472.CAN-07-6639. [DOI] [PubMed] [Google Scholar]
- 46.Nilsson S, Moller C, Jirstrom K, et al. Downregulation of miR-92a is associated with aggressive breast cancer features and increased tumour macrophage infiltration. PLoS One. 2012;7 doi: 10.1371/journal.pone.0036051. e36051. [DOI] [PMC free article] [PubMed] [Google Scholar]
- 47.Cascio S, D'Andrea A, Ferla R, et al. miR-20b modulates VEGF expression by targeting HIF-1 alpha and STAT3 in MCF-7 breast cancer cells. J Cell Physiol. 2010;224:242–9. doi: 10.1002/jcp.22126. [DOI] [PubMed] [Google Scholar]
- 48.Suresh S, McCallum L, Lu W, et al. MicroRNAs 130a/b are regulated by BCR-ABL and downregulate expression of CCN3 in CML. J Cell Commun Signal. 2011;5:183–91. doi: 10.1007/s12079-011-0139-x. [DOI] [PMC free article] [PubMed] [Google Scholar]
- 49.Yanaihara N, Caplen N, Bowman E, et al. Unique microRNA molecular profiles in lung cancer diagnosis and prognosis. Cancer Cell. 2006;9:189–98. doi: 10.1016/j.ccr.2006.01.025. [DOI] [PubMed] [Google Scholar]
- 50.Chen G, Zhu W, Shi D, et al. MicroRNA-181a sensitizes human malignant glioma U87MG cells to radiation by targeting Bcl-2. Oncol Rep. 2010;23:997–1003. doi: 10.3892/or_00000725. [DOI] [PubMed] [Google Scholar]
- 51.Moskwa P, Buffa FM, Pan Y, et al. miR-182-mediated downregulation of BRCA1 impacts DNA repair and sensitivity to PARP inhibitors. Mol Cell. 2011;41:210–20. doi: 10.1016/j.molcel.2010.12.005. [DOI] [PMC free article] [PubMed] [Google Scholar]
- 52.Cimmino A, Calin GA, Fabbri M, et al. miR-15 and miR-16 induce apoptosis by targeting BCL2. Proc Natl Acad Sci U S A. 2005;102:13944–9. doi: 10.1073/pnas.0506654102. [DOI] [PMC free article] [PubMed] [Google Scholar]
- 53.Akerman GS, Rosenzweig BA, Domon OE, et al. Alterations in gene expression profiles and the DNA-damage response in ionizing radiation-exposed TK6 cells. Environ Mol Mutagen. 2005;45:188–205. doi: 10.1002/em.20091. [DOI] [PubMed] [Google Scholar]
- 54.Tan G, Shi Y, Wu ZH. MicroRNA-22 promotes cell survival upon UV radiation by repressing PTEN. Biochem Biophys Res Commun. 2012;417:546–51. doi: 10.1016/j.bbrc.2011.11.160. [DOI] [PMC free article] [PubMed] [Google Scholar]
- 55.Choi OR, Lim IK. Loss of p21(Sdi1) expression in senescent cells after DNA damage accompanied with increase of miR-93 expression and reduced p53 interaction with p21(Sdi1) gene promoter. Biochem Biophys Res Commun. 2011;407:406–11. doi: 10.1016/j.bbrc.2011.03.038. [DOI] [PubMed] [Google Scholar]
- 56.He L, Thomson JM, Hemann MT, et al. A microRNA polycistron as a potential human oncogene. Nature. 2005;435:828–33. doi: 10.1038/nature03552. [DOI] [PMC free article] [PubMed] [Google Scholar]
- 57.Shin S, Cha HJ, Lee EM, et al. MicroRNAs are significantly influenced by p53 and radiation in HCT116 human colon carcinoma cells. Int J Oncol. 2009;34:1645–52. doi: 10.3892/ijo_00000295. [DOI] [PubMed] [Google Scholar]
- 58.Calin GA, Dumitru CD, Shimizu M, et al. Frequent deletions and down-regulation of micro- RNA genes miR15 and miR16 at 13q14 in chronic lymphocytic leukemia. Proc Natl Acad Sci U S A. 2002;99:15524–9. doi: 10.1073/pnas.242606799. [DOI] [PMC free article] [PubMed] [Google Scholar]
- 59.Chung EY, Dews M, Cozma D, et al. c-Myb oncoprotein is an essential target of the dleu2 tumor suppressor microRNA cluster. Cancer Biol Ther. 2008;7:1758–64. doi: 10.4161/cbt.7.11.6722. [DOI] [PMC free article] [PubMed] [Google Scholar]
- 60.Shahi P, Loukianiouk S, Bohne-Lang A, et al. Argonaute – a database for gene regulation by mammalian microRNAs. Nucleic Acids Res. 2006;34 doi: 10.1093/nar/gkj093. D115–8. [DOI] [PMC free article] [PubMed] [Google Scholar]