

Abstract
Purpose
To use 13C MRS and 31P MRS to develop direct assay for regional [HCO3−] in the human brain and to define brain pH and physiological response of [HCO3−] to fasting.
Materials and Methods
Seven healthy subjects underwent MRS examinations on a 1.5T MRI scanner. Subjects were well fed with repeated examinations performed after 4 and 12 hours of fasting. Proton noise decoupling 13C MRS were acquired using pulse and acquire acquisition while 31P MRS were acquired using 2-D chemical shift imaging method with TR of 2s.
Results
Fasting brain bicarbonate concentrations (6.7 ± 2.5 mM for 12hr fasting, P=0.002 and 8.3 ± 2.1 mM for 4 hr fasting, P=0.015) are significantly reduced compared to fed state (11.6 ± 1.3 mM). However, no significant difference in brain pH is observed, confirming the critical role of pCO2 in intracerebral pH homeostasis.
Conclusion
We demonstrated that the intracellular HCO3− in human brain is readily modified by diet but appears to have no measureable effect on cerebral pH. Natural abundance 13C can provide useful information relevant to human brain pH homeostasis by giving information of HCO3−.
Keywords: Brain pH, 13C MRS, 31P MRS, Henderson-Hasselbalch equation
INTRODUCTION
Acid-base homeostasis remains a cornerstone of human acute medical care. Its maintenance is a vital function of living systems. Changes of human body pH in either direction can result in irreversible harm or death. Nowhere is pH homeostasis more critical than in the brain (1), where maintaining proper brain pH is important for neurotransmission processes. It is often assumed that fasting impacts intracellular brain pH, resulting in acidosis. Various intracranial pH monitoring devices are commonly used in clinical settings (2–3). Using such devices, it was found that brain pH falls in acute isocapnic metabolic acidosis and rises in acute isocapnic metabolic alkalosis (4–5). Alternatively, magnetic resonance spectroscopy (MRS) has been used successfully to measure concentrations of different brain metabolites and to study brain energy metabolism. While 31P MRS can be used to measure changes in intracellular pH based on the chemical shift difference between inorganic phosphate (Pi) and phosphocreatine (PCr) (6–7), 13C MRS can be used to measure CO2 and bicarbonate (HCO3−) concentrations based on the pH-dependent equilibrium between CO2 and HCO3− according to Henderson-Hasselbalch equation (8):
where pKa is the acid dissociation constant of CO2, which is 6.15 in the Krebs-Henseleit buffer (9). The relationship shows at any given instance that in order to maintain constant pH, either [HCO3−] or [CO] need to adjust accordingly. Alternatively, realignment in CO2−HCO3− may be over-ridden by [H+]. Counter-intuitively, the ketogenic diet, when causing a severe acidosis load, leaves human intracranial (white matter) pH constant (10) while bicarbonate administration causes brain acidosis in rat (11). However, results of human and rodent studies for example, in ketogenic diets, have been mixed. Pan et al (10) argue in favor of cerebral alkalinization in brain of fasted humans, based upon elevated intracerebral lactate; working in diabetic ketoacidotic rats Al-Mudallal et al (12) saw no pH change and Glaser et al (13) observed acidification. The goals of this study are to use MRS to develop direct assay for regional [HCO3−] in human brain and to define brain pH and physiological response of [HCO3−] to fasting using 13C MRS method. In addition, proton decoupled 31P MRS will be used to define intracerebral pH during fasting in the same subjects. We anticipate that the combination of these two heteronuclear techniques, 13C MRS and 31P MRS could completely define variation in human brain pH in health and disease.
METHODS
The study was approved by the local institutional review board. Healthy subjects were recruited from the local community and all gave informed consent to participate in the study. 13C and 31P MRS studies were performed on seven subjects (5F/2M) with mean age of 29 ± 2 year with three subjects participating in both MRS studies. In total, 13 measurements (3 measurements × 3 subjects plus 2 measurements × 2 subjects) of 13C MRS and 15 measurements (3 measurements × 5 subjects) of 31P MRS were available for analysis. Subjects were instructed to consume their normal low fat and high protein diet prior to the scheduled examinations. Repeat examinations were performed after 4 and 12 hours of fasting. One subject did not participated in the fed state 13C MRS examination and one subject missed the 4 hours fasting 13C MRS examination. The MRS examinations were performed in the posterior brain using a similar published protocol (14). The examinations were performed on a 1.5T GE MRI scanner equipped with multi-nuclear data acquisition and a standalone proton decoupling capability. The subjects lay supine on top of the modified head volume coil (15) where the posterior brain region was included in the field of view. The imaging portion of the protocol involved spoiled gradient-recall acquisition steady-state (SPGR) axial images with the following acquisition parameters: TE = 4.2 ms, TR = 175 ms, flip angle = 60°, field of view = 24cm, slice thickness = 2mm, with 1 mm gap. Prior to carbon and phosphorous data acquisitions, field homogeneity adjustment was performed using the automated single voxel proton spectroscopy (PRESS) approach from which the voxel of interest was prescribed from the SPGR images and included the entire sensitive volume of the coil, (typically 100–140 cc). The volume was shimmed to achieve full-width at half maximum of 20–30 Hz of the unsuppressed water signal. For 13C MRS, proton-noise decoupling carbon MRS data was acquired using pulse and acquire acquisition with TR of 3sec in 6.5 minutes block for 60–70 minutes similar to published studies (16). The signal-to-noise ratio of natural abundance 13C creatine plus phosphocreatine resonance exceeded 4:1.
Proton decoupled 31P MRS was performed using a dual tuned half-head 1H-31P rf coil with 3 Watts decoupling power as previously described (17)Intracerebral pH was calculated from PCr to Pi chemical shift using (7). To avoid 31P signal contamination from scalp muscle, 2-dimensional chemical shift imaging was used with the following parameters; pulse and acquire 8×8×1 phase encoding steps with four excitations per step, TR of 3sec.
DATA ANALYSIS
MR spectra were analyzed using off-line processing software available from GE Healthcare (SAGE version 2007 software package). The processing of each spectrum involved zero filling to 16K; 5 Hz Gaussian line broadening, fourier transformation, and manual phasing. For 13C MRS, chemical shift scaling of the processed spectra was set relative to the prominent lipid carbonyl resonance at 172ppm followed by summation of the 60–70 minutes MRS data sets acquired from each subject. A non-linear least-squares Levenberg-Marquardt fitting algorithm was used to fit the spectra and resulting peak areas were used to calculate bicarbonate concentration using total creatine concentration (tCr) of 11 mM as the internal concentration reference (18). For 31P MRS, inspection of all resonances, relative peak ratio to gamma-ATP were compared between fed and fasted states and the phosphocreatine to inorganic phosphate chemical shift difference was used to compute brain pH using the formula described by Petroff and colleagues (7):
where δ is chemical shift difference in part per million between phosphocreatine and inorganic phosphate resonances.
RESULTS
A representative summed natural abundance 13C spectrum from 148 to 170 ppm chemical shift region from a fed (A) and 12 hour fasted (B) in a single healthy subject is shown in Figure 1. The resonances at 158 ppm assigned to total creatine (creatine plus phosphocreatine) and bicarbonate at 161 ppm are clearly visible in each spectrum after an acquisition time of 45–50 min. A significant reduction in the peak area assigned to 13C bicarbonate, relative to that of 13C total creatine after fasting was observed.(Table 1) examined after shorter (4 hours, P=0.015) or longer (12hours, P=0.002) periods of fasting (Figure 2).
Figure 1.
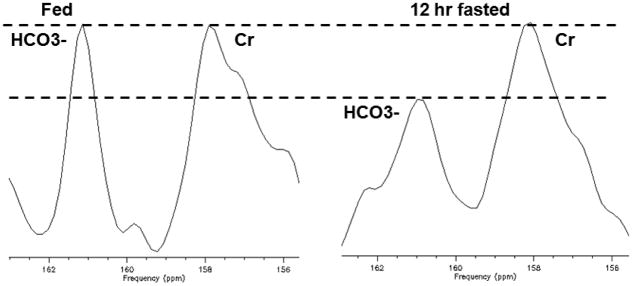
Summation of 9 blocks of the 6.5 minutes acquisition of 13C MRS from a volunteer acquired for 50–60 minutes with fed (left) and 12 hour fasted (right). Bicarbonate resonance at 161ppm is clearly visible and displays significantly lower peak amplitude in the 12 hour fasted compared to the fed condition while Cr + PCr resonance remains constant. Dotted lines demonstrate Cr + PCr resonance is unchanged with reduced bicarbonate resonance after 12 hr of fasting.
Table 1.
Effect of fasting on intracerebral metabolites in seven healthy volunteers.
| Nutritional State | [Cr] mM | [HCO3] mM | pH | Calculated [CO2] mM |
|---|---|---|---|---|
| Fed | 11.0 | 11.6 ± 1.3 (N=4) | 7.14 ± 0.04 (N=5) | 1.06 |
| Fasted, 4 hr. | 11.0 | 8.5 ± 2.5 (N=4) | 7.15 ± 0.05 (N=5) | 0.76 |
| P (vs. fed) | 0.015 | 0.39 | ||
| Fasted, 12 hr. | 11.0 | 6.7 ± 2.5 (N=5) | 7.18 ± 0.13 (N=5) | 0.56 |
| P (vs. fed) | 0.002 | 0.27 |
N= number of subjects examined
Figure 2.
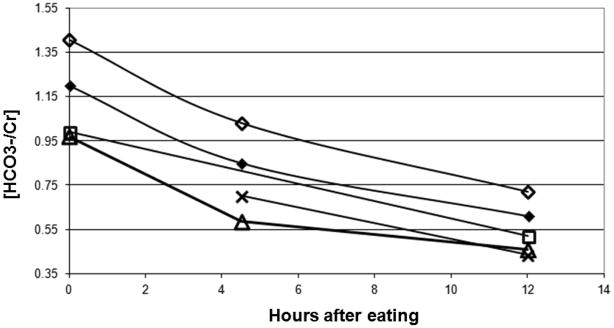
Changes of bicarbonate to creatine ratio from five healthy subjects at fed, 4 and 12 hr fasting. Three subjects completed all three scanning conditions, fed, 4 and 12 hr of fasting. One subject did not participated in the fed state and one missed the 4 hr fasted appointment.
A typical proton decoupled 31P MRS spectrum from the same volunteer in fed and fasted state is displayed in Figure 3. There were no notable differences between the identity and relative peak areas of the 31P resonances, PME, Pi, PDE, PCR, alpha, beta or gamma ATP. The chemical shift difference between Pi and PCr in fasted and fed states was unchanged. As shown in Table 1, intracerebral pH was not statistically different after fasting, with a small but not significant increase from pH 7.14 to 7.15 during 4 hr fasting (P=0.39) and to 7.18 during 12 hr fasting (P=0.27).
Figure 3.
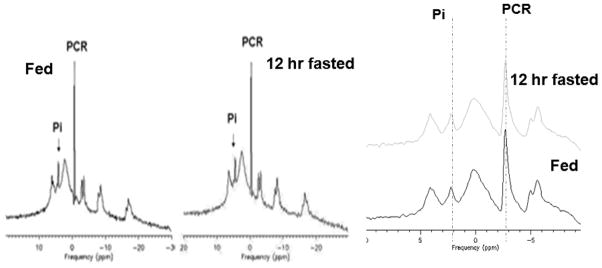
Averaged proton decoupled 31P MRS spectra (10 minutes acquisition time) from a normal volunteer acquired at fed (left) and at 12 hr of fasting (middle). The chemical shifts of the inorganic phosphate (Pi) and the phosphocreatine (PCr) resonances remain unchanged as shown (right).
DISCUSSION
We demonstrated that the intracellular HCO3− in human brain is readily modified by diet but appears to have no measureable effect on cerebral pH; this is contrary to the predictions of (19–21). Estimated HCO3− concentrations in human brain, based on these novel natural abundance 13C MRS observations closely match those from direct chemical assays in animal studies range, from 14 to17 mM (21). While direct measurement for HCO3− concentration of human brain has not previously been available, its concentration can be calculated using the Henderson-Hasselbalch equation based on acid-base equilibrium of carbonic acid and bicarbonate if brain pH and CO2 concentrations are known. 31P MRS has been widely used to measure intracellular pH of tissue and organs in vivo. The approach relies on chemical shift different between inorganic phosphate (Pi) and prominent phosphorous compounds most usually phosphocreatine (PCr). Intracellular fluid pH has been reported in brain of several animal species ranging from 7.04 in rat (22) 7.13 in cat (23), and 7.05 in dog. We observed similar pH in fed healthy subjects to previous values reported from our laboratory (7.13 ±0.02 vs 6.99 ± 0.01) (24). In addition it is also similar to pH in cat brain measurement using lipid soluble pH sensitive fluorescent indicator (25).
Natural abundance 13C can provide useful information relevant to human brain pH homeostasis by giving information of HCO3−, This data, combined with 31P MRS assays of cytosolic intracellular pH, provides two of the three parameters of the Henderson-Hasselbalch equation. While it is still not possible with conventional 13C MRS, as used here, to measure brain CO2 concentration in real time due to its very low concentration (1–2 mM) the estimated pCO2 (Table 1) falls within the range determined invasively in surgical patients; that concentration falls in parallel with the determined reduction in brain bicarbonate (26).
In future, it may be possible to determine pCO2 directly in human brain using hyperpolarized 13C MRS thereby obtaining a complete picture of the complex metabolic events maintaining pH homeostasis. Infusing a hyperpolarized labeled substrate ([1-13C] pyruvate) in rat hearts has been reported to demonstrate CO2 and HCO3− (27). There are limitations to our technique: first, dedicated hardware is required for stable broadband excitation. Second, long total data acquisition time of 50 to 60 minutes is required. Third, relatively larger brain volume with no spatial localization is examined.
In conclusion, this conventional natural abundance 13C MRS in combination with proton decoupled 31P MRS technique appears to reliably record two of the desired parameters and to define brain pH in humans.
Acknowledgments
Grant support: NIH/NIDA K2521112 (N. Sailasuta)
NCICA122513-01 (PI BDRoss)
Whittier Family Foundation (Kent C. Harris, Thao T Tran and Brian D. Ross)
References
- 1.Obara M, Szeliga M, Albrecht J. Regulation of pH in the mammalian central nervous system under normal and pathological conditions: facts and hypotheses. Neurochem Int. 2008;52(6):905–19. doi: 10.1016/j.neuint.2007.10.015. [DOI] [PubMed] [Google Scholar]
- 2.Charbel FT, Hoffman WE, Misra M, Hannigan K, Ausman JI. Cerebral interstitial tissue oxygen tension, pH, HCO3, CO2. Surg Neurol. 1997;48(4):414–7. doi: 10.1016/s0090-3019(96)00473-9. [DOI] [PubMed] [Google Scholar]
- 3.Mendelowitsch A, Sekhar LN, Caputy AJ, Shuaib A. Intraoperative on-line monitoring of cerebral pH by microdialysis in neurosurgical procedures. Neurol Res. 1998;20(2):142–8. doi: 10.1080/01616412.1998.11740497. [DOI] [PubMed] [Google Scholar]
- 4.Javaheri S, De Hemptinne A, Vanheel B, Leusen I. Changes in brain ECF pH during metabolic acidosis and alkalosis: a microelectrode study. J Appl Physiol. 1983;55(6):1849–53. doi: 10.1152/jappl.1983.55.6.1849. [DOI] [PubMed] [Google Scholar]
- 5.Adler S, Simplaceanu V, Ho C. Brain pH in acute isocapnic metabolic acidosis and hypoxia: a 31P-nuclear magnetic resonance study. Am J Physiol. 1990;258(1 Pt 2):F34–40. doi: 10.1152/ajprenal.1990.258.1.F34. [DOI] [PubMed] [Google Scholar]
- 6.Petroff OA, Prichard JW. Cerebral pH by NMR. Lancet. 1983;2(8341):105–6. doi: 10.1016/s0140-6736(83)90088-0. [DOI] [PubMed] [Google Scholar]
- 7.Petroff OA, Prichard JW, Behar KL, Alger JR, den Hollander JA, Shulman RG. Cerebral intracellular pH by 31P nuclear magnetic resonance spectroscopy. Neurology. 1985;35(6):781–8. doi: 10.1212/wnl.35.6.781. [DOI] [PubMed] [Google Scholar]
- 8.van Stekelenburg GJ. On the reliability of the Henderson-Hasselbalch equation in routine clinical acid-base chemistry. Ann Clin Biochem. 1984;21 (Pt 3):224. doi: 10.1177/000456328402100312. [DOI] [PubMed] [Google Scholar]
- 9.Leem CH, Lagadic-Gossmann D, Vaughan-Jones RD. Characterization of intracellular pH regulation in the guinea-pig ventricular myocyte. J Physiol. 1999;517(Pt 1):159–80. doi: 10.1111/j.1469-7793.1999.0159z.x. [DOI] [PMC free article] [PubMed] [Google Scholar]
- 10.Pan JW, Bebin EM, Chu WJ, Hetherington HP. Ketosis and epilepsy: 31P spectroscopic imaging at 4.1 T. Epilepsia. 1999;40(6):703–7. doi: 10.1111/j.1528-1157.1999.tb00766.x. [DOI] [PubMed] [Google Scholar]
- 11.Shapiro JI, Whalen M, Kucera R, Kindig N, Filley G, Chan L. Brain pH responses to sodium bicarbonate and Carbicarb during systemic acidosis. Am J Physiol. 1989;256(5 Pt 2):H1316–21. doi: 10.1152/ajpheart.1989.256.5.H1316. [DOI] [PubMed] [Google Scholar]
- 12.Al-Mudallal AS, LaManna JC, Lust WD, Harik SI. Diet-induced ketosis does not cause cerebral acidosis. Epilepsia. 1996;37(3):258–61. doi: 10.1111/j.1528-1157.1996.tb00022.x. [DOI] [PubMed] [Google Scholar]
- 13.Glaser N. Pediatric diabetic ketoacidosis and hyperglycemic hyperosmolar state. Pediatr Clin North Am. 2005;52(6):1611–35. doi: 10.1016/j.pcl.2005.09.001. [DOI] [PubMed] [Google Scholar]
- 14.Sailasuta N, Abulseoud O, Harris KC, Ross BD. Glial dysfunction in abstinent methamphetamine abusers. J Cereb Blood Flow Metab. 2010;30(5):950–60. doi: 10.1038/jcbfm.2009.261. [DOI] [PMC free article] [PubMed] [Google Scholar]
- 15.Gropman AL, Sailasuta N, Harris KC, Abulseoud O, Ross BD. Ornithine transcarbamylase deficiency with persistent abnormality in cerebral glutamate metabolism in adults. Radiology. 2009;252(3):833–41. doi: 10.1148/radiol.2523081878. [DOI] [PMC free article] [PubMed] [Google Scholar]
- 16.Sailasuta N, Robertson LW, Harris KC, Gropman AL, Allen PS, Ross BD. Clinical NOE 13C MRS for neuropsychiatric disorders of the frontal lobe. J Magn Reson. 2008;195(2):219–25. doi: 10.1016/j.jmr.2008.09.012. [DOI] [PMC free article] [PubMed] [Google Scholar]
- 17.Bluml S, Tan J, Harris K, Adatia N, Karme A, Sproull T, et al. Quantitative proton-decoupled 31P MRS of the schizophrenic brain in vivo. J Comput Assist Tomogr. 1999;23(2):272–5. doi: 10.1097/00004728-199903000-00017. [DOI] [PubMed] [Google Scholar]
- 18.Ross B, Tran T, Bhattacharya P, Watterson DM, Sailasuta N. Application of NMR spectroscopy in medicinal chemistry and drug discovery. Curr Top Med Chem. 2011;11(1):93–114. doi: 10.2174/156802611793611850. [DOI] [PubMed] [Google Scholar]
- 19.Chesler M, Chen JC, Kraig RP. Determination of extracellular bicarbonate and carbon dioxide concentrations in brain slices using carbonate and pH-selective microelectrodes. J Neurosci Methods. 1994;53(2):129–36. doi: 10.1016/0165-0270(94)90169-4. [DOI] [PMC free article] [PubMed] [Google Scholar]
- 20.Smellie WS, O’Donnell J, Davidson H, Couper J, Logue FC. Effects of changes in acid base and calcium concentration on fasting serum insulin, proinsulin, and glucose concentrations. J Clin Pathol. 1994;47(11):982–5. doi: 10.1136/jcp.47.11.982. [DOI] [PMC free article] [PubMed] [Google Scholar]
- 21.Siesjo BK. The relation between the bicarbonate concentration in blood plasma and in brain tissue. Experientia. 1964;20(8):455–6. doi: 10.1007/BF02152148. [DOI] [PubMed] [Google Scholar]
- 22.Siesjo BK, Folbergrova J, MacMillan V. The effect of hypercapnia upon intracellular pH in the brain, evaluated by the bicarbonate-carbonic acid method and from the creatine phosphokinase equilibrium. J Neurochem. 1972;19(11):2483–95. doi: 10.1111/j.1471-4159.1972.tb01308.x. [DOI] [PubMed] [Google Scholar]
- 23.Roos A. Intracellular pH and intracellular buffering power of the cat brain. Am J Physiol. 1965;209(6):1233–46. doi: 10.1152/ajplegacy.1965.209.6.1233. [DOI] [PubMed] [Google Scholar]
- 24.Bluml S, Zuckerman E, Tan J, Ross BD. Proton-decoupled 31P magnetic resonance spectroscopy reveals osmotic and metabolic disturbances in human hepatic encephalopathy. J Neurochem. 1998;71(4):1564–76. doi: 10.1046/j.1471-4159.1998.71041564.x. [DOI] [PubMed] [Google Scholar]
- 25.Sundt TM, Anderson RE, Van Dyke RA. Brain pH measurements using a diffusible, lipid soluble pH sensitive fluorescent indicator. J Neurochem. 1978;31(3):627–35. doi: 10.1111/j.1471-4159.1978.tb07834.x. [DOI] [PubMed] [Google Scholar]
- 26.Zauner A, Doppenberg E, Woodward JJ, Allen C, Jebraili S, Young HF, et al. Multiparametric continuous monitoring of brain metabolism and substrate delivery in neurosurgical patients. Neurol Res. 1997;19(3):265–73. doi: 10.1080/01616412.1997.11740812. [DOI] [PubMed] [Google Scholar]
- 27.Schroeder MA, Swietach P, Atherton HJ, Gallagher FA, Lee P, Radda GK, et al. Measuring intracellular pH in the heart using hyperpolarized carbon dioxide and bicarbonate: a 13C and 31P magnetic resonance spectroscopy study. Cardiovasc Res. 2010;86(1):82–91. doi: 10.1093/cvr/cvp396. [DOI] [PMC free article] [PubMed] [Google Scholar]