Abstract
PURPOSE
To determine the normal size and wall thickness of the ascending thoracic aorta (AA) and its relationship with cardiovascular risk factors in a large population-based study.
MATERIALS AND METHODS
The mean AA luminal diameter was measured in 3573 Multi-Ethnic Study of Atherosclerosis (MESA) participants (age: 45–84 years), using gradient echo phase contrast cine MRI. Multiple linear regression models were used to evaluate the associations between risk factors and AA diameter. The median and upper normal limit (95th percentile) was defined in a “healthy” subgroup as well as AA wall thickness.
RESULTS
The upper limits of body surface area indexed AA luminal diameter for age categories of 45–54, 55–64, 65–74, and 75–84 years are 21, 22, 22, and 28 mm/m2 in women and 20, 21, 22, 23 mm/m2 in men, respectively. The mean AA wall thickness was 2.8 mm. Age, gender and body surface area were major determinants of AA luminal diameter (~+1 mm/10 years; ~+1.9 mm in men than women; ~+1 mm/ 0.23 m2; p<0.001). The AA diameter in hypertensive subjects was +0.9 mm larger than in normotensives (p<0.001).
CONCLUSION
AA diameter increases gradually with aging for both genders, among all race/ethnicities. Normal value of AA diameter is provided.
Keywords: Thoracic aorta, MRI, normal value, cardiovascular risk factors
INTRODUCTION
Enlargement of the ascending aorta (AA) is a frequent finding in clinical practice. Age, gender, and body size have been shown to be the important determinants of AA diameter (1,2). The ascending aorta is considered dilated or ectatic when its size is 1.1 to 1.5 times larger than the normal and aneurismal when its size exceeds the limits defining dilatation (3,4).
The diameter of the ascending aorta, typically measured at the level of the right pulmonary artery, is used to define the dimensions of the AA. The normal size of the AA has previously been defined using magnetic resonance imaging (MRI) in single center studies without consideration of race/ ethnicity and or other determinates of AA size using T1 weighted spin echo and balanced fast field echo sequences (5–8). The purpose of this study was assess AA lumen and wall size in a large multi-center and multi-ethnic population-based study to determine normal reference values for AA luminal diameter and wall thickness. We also sought to determine the major relationships between AA size and cardiovascular risk factors.
METHODS
Study Design and Population
The Multi-Ethnic Study of Atherosclerosis (MESA) study has been previously described (9). In brief, 6,814 participants (age 45 to 84 years, 3,601 females) who identified themselves as white, African-American, Hispanic, or Chinese and free of clinically apparent CVD were recruited from six US communities (Baltimore City and Baltimore County, MD; Chicago, IL; Forsyth County, NC; Los Angeles County, CA; Northern Manhattan and the Bronx, NY; and St. Paul, MN) between July 2000 and August 2002. The institutional review boards at all participating centers approved the study, and all participants gave written informed consent.
Baseline Examination
Study subjects underwent an extensive baseline evaluation including clinical history, physical examination, laboratory tests, and anthropometric measurements. Body surface area (BSA) was calculated as 0.20247 x [height (m) (0.725)] x [weight (kg) (0.425)] (10). Weight was measured to the nearest 0.5 kg (in light clothing) and height to the nearest 0.1 cm. Standardized questionnaires were used to obtain information about smoking history, current medications, and physician diagnoses of hypertension and diabetes. Hypertension was defined as systolic blood pressure (SBP) ≥140 mm Hg, diastolic blood pressure (DBP) ≥90 mm Hg, or self reported hypertension with use of anti-hypertensive medications(11). Steady and pulsatile components of blood pressure were expressed as mean blood pressure (MBP = 2/3DBP + 1/3SBP) and pulse pressure (PP = SBP − DBP). Diabetes was defined based on the use of hypoglycemic drugs or insulin, or fasting blood glucose ≥ 126 mg/dl (12).
Coronary artery calcium (CAC) score and maximum common and internal carotid artery intima-media thicknesses (IMT) were used as measures of subclinical atherosclerotic disease. The protocols for assessment of CAC by computed tomography and carotid IMT by carotid ultrasound were previously described (9,13,14). Interleukin-6 (IL-6) and C-reactive protein (CRP) were used as markers of systemic inflammation. Serum levels of IL-6 were determined by ultrasensitive ELISA (Quantikine HS Human IL-6 Immunoassay, R&D Systems, Minneapolis, MN), and CRP levels were measured by the BNII nephelometer (N High Sensitivity CRP, Dade Behring Inc., Deerfield, IL).
Aorta MRI and Image Analysis
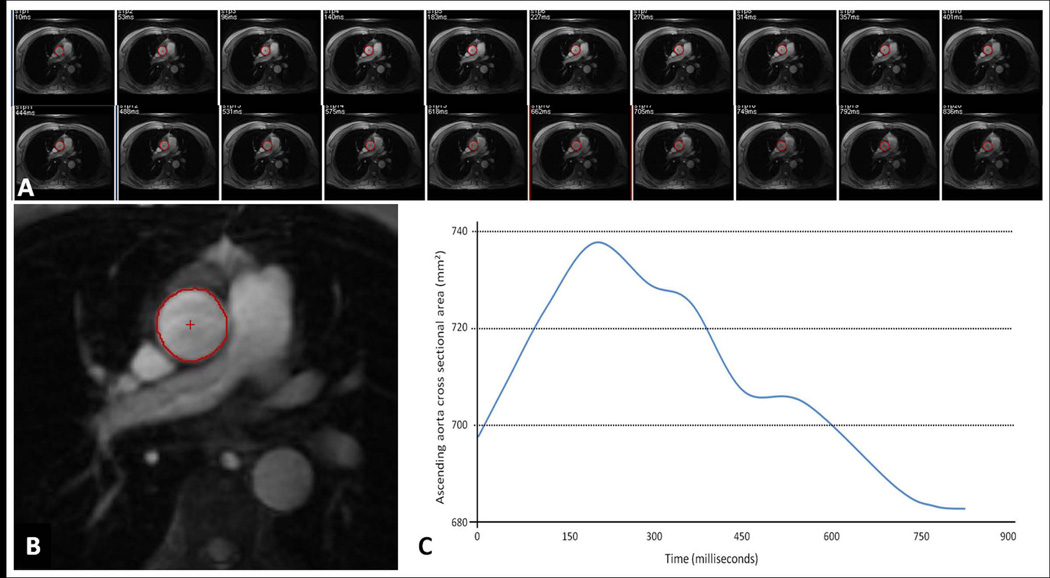
5004 MESA participants had cardiac MRI. Aorta MRI was performed in 5 field centers (excluding St Paul, MN due to technical reasons) using ECG gated gradient echo phase contrast cine sequence (n=3573). Ascending aorta images were obtained in the axial plane at the level of the right pulmonary artery with free breathing (TR = 10 msec; TE = 1.9 msec; field of view = 34 cm; slice thickness = 8 mm; matrix size = 256 × 224; NEX=2; temporal resolution = 20 ms; velocity encoding gradient = 150 cm/s; and receiver bandwidth = 32 kHz) and magnitude images of the cine phase contrast sequence were used to calculate AA luminal diameter (5). Ascending aorta contours were traced throughout the cardiac cycle automatically after selecting the center point in the first image using QFLOW software (Medis, the Netherlands). Contours were checked and corrected manually if needed. The maximum and minimum AA luminal diameters were determined from maximum and minimum cross-sectional areas of ascending aorta, respectively (Figure 1A–C). The mean AA luminal diameter was calculated as (maximum AA diameter + minimum AA diameter)/2. Phase contrast images from 100 participants were re-read by a second reader with an inter-reader intra-class correlation of 0.98 (95% confidence interval; 0.98–0.99). The mean difference between two readers was 0.14 mm; the limits of agreement was −1.1 to +1.4 mm.
Figure 1.
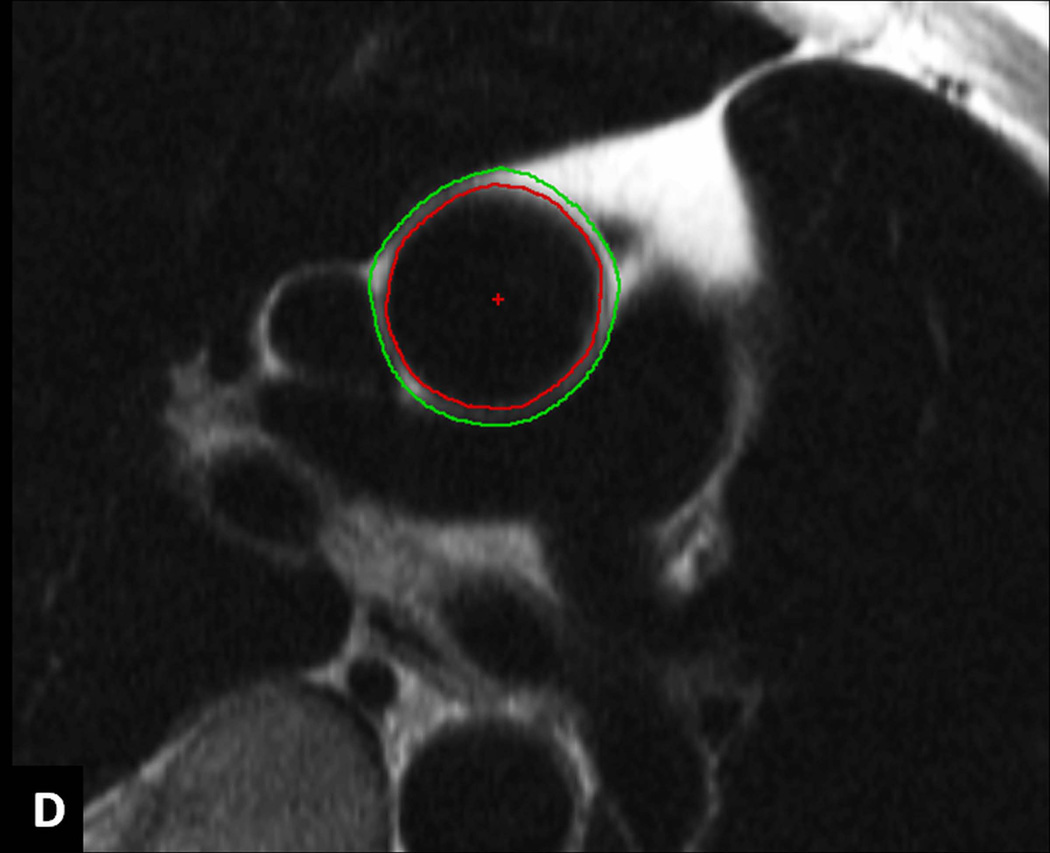
A–D: Image analysis. Series of modulus images from ECG gated phase contrast aorta MRI at the level of right pulmonary artery (A). A representative image from the series with ascending aorta contour (B). The resulting ascending aorta cross sectional area/ time curve over the cardiac cycle to determine maximum and minimum cross sectional areas (C). ECG gated double inversion recovery black blood fast spin echo image at the same image position during diastole showing the inner and outer contours of ascending aorta to obtain ascending aorta wall thickness (D).
In a subgroup of 1,053 MESA participants, who were scanned in three field centers (Johns Hopkins University, Wake Forest University, and Columbia University) with an MRI scanner from the same manufacturer equipped with similar software, ECG gated double inversion recovery black blood fast spin echo sequence (TR = 2 RR intervals; TE = 42 msec; field of view = 36 cm; slice thickness = 6 mm; matrix size = 512 × 256, interpolated to 512 × 512; echo train length = 32; and receiver bandwidth = 62.5 kHz) was performed at the same image position during diastole. The normal value of AA wall thickness was defined from participants with Inner and outer AA contours were traced automatically using VESSELMASS research software (V2011-EXP, Leiden University Medical Center, Leiden, the Netherlands) to obtain vessel wall thickness (15) (Figure 1D).
All aortic MRI studies were evaluated and quantified at a single reading center blinded to the clinical information of the subjects.
Statistical Analysis
Clinical characteristics of the study population are presented as mean (SD) for continuous variables [except CAC, which is presented as median (25th, 75th percentile)] or as percentage for categorical variables. Differences in these characteristics by gender were evaluated with the Student unpaired t test and Pearson’s chi-square test for continuous and categorical variables, respectively. CAC values were natural log-transformed after adding 1 before transformation to accommodate zeroes and very small values.
We used linear regression to calculate the association of AA luminal diameter with each risk factor (traditional cardiovascular risk factor, measure of subclinical atherosclerosis, and inflammatory marker). Two different models were used: i) Minimally adjusted model was adjusted for age, sex, and BSA, and additionally adjusted for each risk factor one at a time, and ii) Fully adjusted model was adjusted for age, sex, BSA, and all other risk factors together. We evaluated BP measures in minimally adjusted models [systolic blood pressure (SBP), diastolic blood pressure (DBP), mean arterial pressure (MAP), and pulse pressure (PP)] and singled out the measure that gave the highest association with AA luminal diameter for further pursuance in the fully adjusted model. BSA was used as the surrogate of body size as it gave higher association with AA luminal diameter than height and weight on a separate univariate analysis (not shown). The minimally adjusted models for BP and lipid measures were additionally adjusted for hypertension and lipid medication use, respectively. In a series of separate models, we tested for all potential interactions between i) sociodemographic variables of age, sex, BSA, and ethnicity and ii) each risk factor and these sociodemographic variables; for this, significance was declared at p<0.001 after Bonferroni correction for a total of 50 interaction tests. Univariate summary statistics were used to report normal reference values of AA luminal diameter (both un-indexed and indexed by BSA) [including 5th, 50th (median), 95th percentile values] by age, gender, and ethnicity. The upper limit of AA luminal diameter was defined as 95th percentile value. To compare AA luminal diameter obtained from 2 MRI sequences, Pearson’s correlation coefficient was calculated and Bland-Altman plot was generated.
All analyses were performed using STATA version 9.0 (StataCorp; College Station, TX) statistical software. A 2-sided P value of <0.05 was considered statistically significant, unless specified otherwise.
RESULTS
Participant Characteristics
3,573 MESA participants underwent phase contrast MRI of the AA. The mean age of the participants was 60.6 years (range 45–84); 54% were female; 11% were Chinese-American, 30% were African-American, 17% Hispanic and 42% were Caucasian (Table 1). Among the participants included in the analysis, women had lower mean BSA, DBP, common and internal carotid IMT (p<0.001 for all), lower median CAC scores (p<0.001), and lower triglycerides (p=0.006). Compared to men, women were less likely to be smokers (p<0.001) and diabetic (p=0.04). Women were also more likely to use anti-hypertension medication (p=0.03) and have higher PP, IL-6, and CRP levels (p<0.001, p=0.004 and p<0.001, respectively).
Table 1.
Characteristics of MESA Participants with Ascending Aortic Luminal Diameter Measurement (n= 3573) by Gender, 2000–02
| Women N=1940 Mean±SD or n (%) |
Men N=1633 Mean ±SD or n (%) |
p | |
|---|---|---|---|
| Cardiovascular Disease Risk Factors | |||
| Age, years | 60.6 ±10.0 | 60.5±10.0 | 0.73 |
| Race/ethnicity | 0.42 | ||
| Caucasian | 801 (41.3) | 700 (42.9) | |
| Chinese American | 214 (11.0) | 185 (11.3) | |
| African American | 601 (31.0) | 464 (28.4) | |
| Hispanic | 324 (16.7) | 284 (17.4) | |
| Body Surface Area (m2) | 1.76 ± 0.2 | 2.0 ±0.2 | <0.0001 |
| Total Cholesterol (mg/dl) | 199.54 ± 34.9 | 187.8±33.4 | <0.0001 |
| LDL Cholesterol (mg/dl) | 117.5±31.6 | 116.8± 29.7 | 0.44 |
| HDL Cholesterol (mg/dl) | 57.36±15.7 | 45.3±11.6 | <0.0001 |
| Triglycerides (mg/dl) | 123.3± 80.8 | 131.0±85.2 | 0.006 |
| Lipid Lowering Medication(Yes) | 315 (16.3) | 236 (14.5) | 0.14 |
| Hyperlipidemia | 862 (45.1) | 930 (57.7) | <0.0001 |
| Systolic BP (mmHg) | 125.1±22.8 | 124.5±18.8 | 0.34 |
| Diastolic BP (mmHg) | 69.35±10.3 | 75.1± 9.5 | <0.0001 |
| Mean BP (mmHg) | 88.0±13.2 | 91.5±11.5 | <0.0001 |
| Pulse Pressure (mmHg) | 55.8± 17.8 | 49.4± 14.3 | <0.0001 |
| Hypertension (Yes) | 838 (43.2) | 653 (40.0) | 0.053 |
| Hypertension Medication (Yes) | 715 (36.9) | 546 (33.4) | 0.030 |
| Diabetes (Yes) | 182 (9.4) | 187 (11.5) | 0.043 |
| Cigarette Smoking (Yes) | 791 (40.9) | 936 (57.5) | <0.0001 |
| Family History of Heart Attack (Yes) | 847 (46.1) | 595 (38.9) | <0.0001 |
| Measures of Subclinical Atherosclerosis | |||
| Coronary calcium score* | 0 (0–19.6) | 9.7 (0–130.9) | <0.0001 |
| Maximum CCA IMT (mm) | 0.8 (0.2) | 0.9 (0.2) | <0.0001 |
| Maximum ICA IMT (mm) | 1.0 (0.5) | 1.1 (0.6) | <0.0001 |
| Systemic Inflammatory Markers | |||
| IL-6 (pg/ml) | 1.5 (1.2) | 1.4 (1.2) | 0.004 |
| CRP (mg/l) | 4.5 (6.2) | 2.66 (5.3) | <0.0001 |
CCA IMT: common carotid artery intima media thickness, ICA IMT: Internal carotid artery intima media thickness.
Numbers given represents median (25th–75th percentile) for coronary calcium score
Ascending Aorta Luminal Diameter and Cardiovascular Disease Risk Factors
The mean AA luminal diameter was 33.4 mm in men and 30.5 in women. Age, male gender, and BSA were major determinants of AA luminal diameter, accounting for 26% of the variability in AA luminal diameter. AA luminal diameter increased an average of 1.2 mm (about 3.8% of the mean value) per each 10-year increase in age and 1 mm (about 3.1% of the mean value) per each 0.23 m2 increase in BSA. Men had 1.9 mm (about 5.9% of the mean value) larger AA luminal diameter than women after adjusting for age and BSA (Table 2). The fully adjusted model confirmed these findings with only small changes in the magnitude of effect (Table 3). All variables in the fully adjusted model accounted for 30% of the variability. As regards interactions, the only significant variable was observed between age and ethnicity in which the rate of increase in AA luminal diameter with age in Chinese was 0.1 mm higher than in Caucasians.
Table 2.
Minimally Adjusted Linear Regression Models Showing Associations of Ascending Aortic Luminal Diameter with Cardiovascular Disease Risk Factors in 3573 MESA Participants, 2000–02
| Variable | Regression Coefficient (mm) |
95% CI | p |
|---|---|---|---|
| BASELINE MODEL | |||
| Age ( per SD of 10 yrs) 1 | 1.2 | 1.1–1.3 | <0.001 |
| Gender 2 | 1.9 | 1.6–2.1 | <0.001 |
| Body Surface Area (per SD of 0.23m2)3 | 1.0 | 0.9–1.1 | <0.001 |
| BASELINE MODEL+ ONE VARIABLE | |||
| Traditional Risk Factors | |||
| Race | |||
| …Caucasian | Reference | Reference | |
| Chinese American | 1.7 | 1.3–2.1 | <0.001 |
| African American | −0.2 | −0.4-0.1 | 0.20 |
| Hispanic | 0.1 | −0.2–0.4 | 0.57 |
| Systolic BP (per SD of 21 mmHg)4 | 0.3 | 0.2–0.5 | <0.001 |
| Diastolic BP (per SD of 10 mmHg)4 | 0.7 | 0.6–0.8 | <0.001 |
| Mean BP (per SD of 13 mmHg) 4 | 0.6 | 0.4–0.7 | <0.001 |
| Pulse Pressure (per SD of 17 mmHg) 4 | −0.1 | −0.3-0.0 | 0.07 |
| Hypertension (yes) | 0.9 | 0.7–1.2 | <0.001 |
| Cigarette Smoking (yes) | −0.2 | −0.4-0.0 | 0.07 |
| Diabetes (yes) | −0.4 | −0.8-−0.1 | 0.02 |
| Total Cholesterol (per SD of 36 mg/dl)5 | −0.1 | −0.2-0.0 | 0.08 |
| HDL (per SD of 15 mg/dl)5 | −0.02 | −0.1-0.1 | 0.74 |
| LDL ( per SD of 32 mg/dl)5 | −0.1 | −0.2-0.0 | 0.18 |
| Triglycerides ( per SD of 89 mg/dl)5 | −0.04 | −0.2-0.1 | 0.43 |
| Measures of Subclinical Atherosclerosis | |||
| Coronary Calcium Score (present) | 0.3 | 0.1–0.5 | 0.015 |
| Log CAC (per SD of 2.52) | 0.21 | 0.1–0.4 | 0.001 |
| Maximum CCA IMT (per SD of 0.19mm) | 0.1 | 0.0–0.3 | 0.06 |
| Maximum ICA IMT (per SD of 0.60mm) | −0.1 | −0.2-0.1 | 0.44 |
| Systemic Inflammatory Markers | |||
| IL-6 (per SD of 1.22pg/ml) | −0.03 | −0.2-0.1 | 0.59 |
| CRP (per SD of 6 mg/l) | −0.1 | −0.2-0.0 | 0.17 |
CI: Confidence Interval, BP: blood pressure, CAC: coronary artery calcium score, CCA IMT: common carotid artery intima media thickness, ICA IMT: Internal carotid artery intima media thickness.
All models (except for age, gender and, body surface area) were adjusted for age, gender, body surface area.
Adjusted for gender, body surface area
Adjusted for age, body surface area
Adjusted for age and gender
Adjusted for age, gender, body surface area, hypertension medication use
Adjusted for age, gender, body surface area, lipid lowering medication use.
Table 3.
Fully Adjusted Linear Regression Model Showing Associations of Ascending Aortic Luminal Diameter with Cardiovascular Disease Risk Factors in 3573 MESA Participants, 2000–02
| Variable | Regression Coefficient (mm) |
95% CI | p |
|---|---|---|---|
| Age (per SD of 10 yrs) | 1.1 | 1.0–1.3 | <0.001 |
| Gender | 1.2 | 0.9–1.5 | <0.001 |
| Body Surface Area (per SD of 0.23 m2) | 1.2 | 1.0–1.4 | <0.001 |
| Race | |||
| Chinese American | 1.5 | 1.1–1.9 | <0.001 |
| African American | −0.5 | −0.8- −0.2 | <0.001 |
| Hispanic | 0.03 | −0.3–0.4 | 0.86 |
| Diastolic Blood Pressure (per SD of 10 mmHg) | 0.73 | 0.6–0.8 | <0.001 |
| Hypertension Medication (yes) | 0.6 | 0.4–0.9 | <0.001 |
| Cigarette smoking (yes) | −0.04 | −0.3−0.2 | 0.74 |
| Diabetes | −0.5 | −0.9– −0.2 | 0.006 |
| Total cholesterol (per SD of 36 mg/dl) | −0.2 | −0.3– −0.0 | 0.007 |
| HDL (per SD of 15 mg/dl) | 0.1 | −0.0–0.2 | 0.07 |
| Lipid medication (yes) | −0.7 | −1.0– −0.4 | <0.001 |
| IL-6 (per SD of 1.22 pg/ml) | 0.0 | −0.1−0.1 | 0.98 |
| CRP (per SD of 6 mg/l) | −0.1 | −0.2–0.0 | 0.07 |
| Max CCA IMT (per SD of 0.19 mm) | 0.09 | −0.1–0.2 | 0.23 |
| Log CAC (per SD of 2.52) | 0.07 | 0.0–0.1 | 0.01 |
Chinese participants had a larger AA luminal diameter (1.5 mm larger, p<0.001) and African Americans had a slightly smaller AA luminal diameter (−0.5 mm, p<0.001) in the fully adjusted model, compared to Caucasian participants.
In minimally adjusted models, hypertension, SBP, DBP, MBP and PP all showed a positive association with AA luminal diameter. The influence of DBP on AA luminal diameter was more than double that of SBP (0.73 mm vs. 0.32 mm increase in AA diameter per 1 standard deviation −SD− increase in DBP and SBP, respectively) (Table 2). These findings persisted in the fully adjusted models that were developed separately for each of the above mentioned blood pressure related variables (not shown). Given its greatest regression coefficient of all continuous BP measures, we included DBP in the fully adjusted model in Table 3. AA luminal diameter was an average of 0.4 mm (about 1.25% of the mean value) less in diabetics compared to non-diabetics after adjusting for age, gender and BSA (Table 2). There was no association between total cholesterol, triglycerides, LDL, and HDL after adjusting for age, gender, BSA, and lipid lowering medication use. However, in the fully adjusted regression models, total cholesterol and lipid lowering medication use was negatively associated with AA luminal diameter (0.2 mm smaller, about 0.6% of the mean value, p<0.007; and 0.7 mm smaller, about 2.2% of the mean value, p<0.001, respectively) (Table 3). There was no change in the significance of associations if we used minimum or maximum ascending aortic diameter except small changes in the magnitude of regression coefficients (not shown).
Ascending Aorta Diameter and Measures of Subclinical Atherosclerosis
Non-zero coronary artery calcium (CAC) score showed a positive association with AA luminal diameter (0.2 mm greater, about 0.6% of the mean value per each 1 SD increase in CAC score). This association remained significant in the fully adjusted regression model (Table 3).
Maximum common and internal carotid artery intima-media thicknesses were not associated with AA luminal diameter in the minimally adjusted (Table 2) or fully adjusted models (Table 3 for maximum common carotid artery intima-media thickness).
Ascending Aorta Diameter and Systemic Inflammatory Markers
There was no association between IL-6, CRP and AA luminal diameter after adjusting for age, gender and, BSA (Table 2).
Reference Values for Ascending Aorta Luminal Diameter
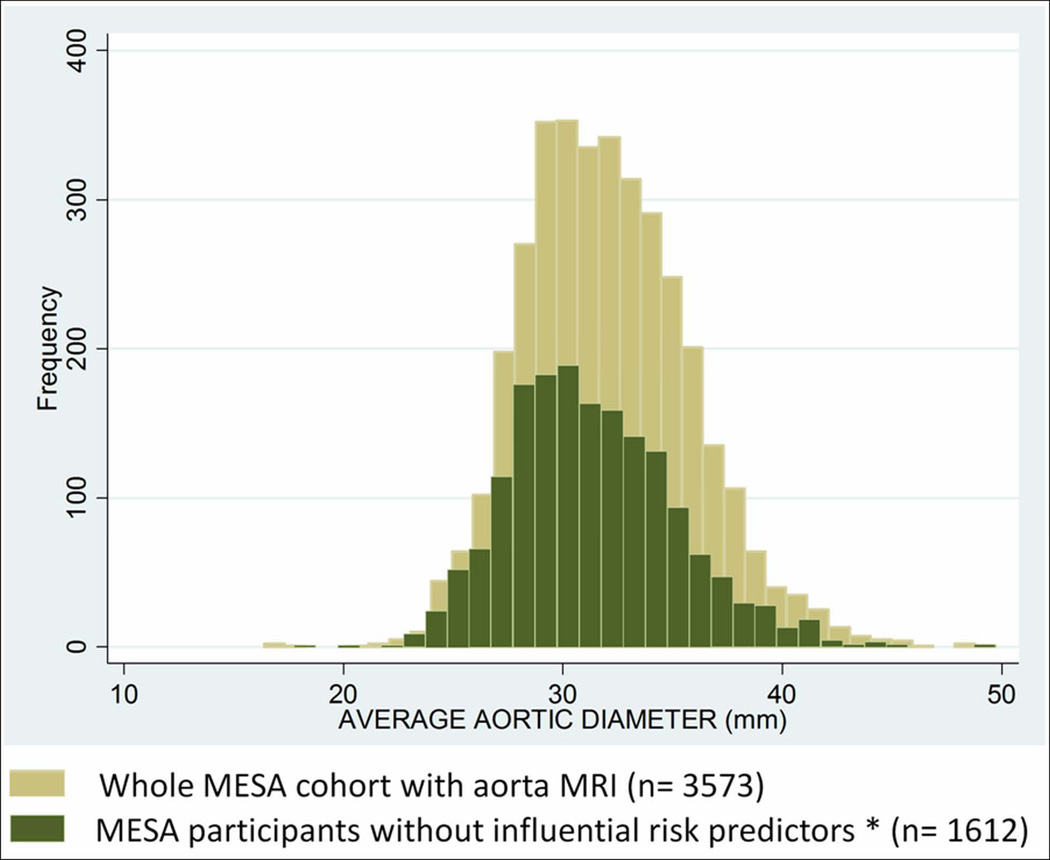
In the whole MESA cohort with AA luminal diameter measurements, 42% of participants were hypertensive, 10% were diabetic and 15% were on lipid lowering medications. Those risk factors as well as CAC score, total cholesterol was significantly associated with AA luminal diameter. Participants with hypertension, diabetes, lipid lowering medication use, CAC score value > 95th percentile (CAC score >95th percentile per age, gender and race categories (16) and total cholesterol value > 95th percentile were excluded from the sample to define reference values of AA luminal diameter. Histograms comparing average AA luminal diameter of all participants with aorta MRI (n=3,573) to participants without risk factors associated with AA luminal diameter (n=1,612) are shown in Figure 2. Median and upper normal limits of AA luminal diameter in all MESA participants were 32 mm and 39 mm; whereas these values were 31 mm and 38 mm in participants without risk factors influencing AA luminal diameter. The mean AA luminal diameter is significantly larger in participants with risk factors associated with AA luminal diameter than those without (32.6 mm vs. 31.4 mm; p<0.0001, respectively)
Figure 2.
Histograms Comparing Average Ascending Aortic Luminal Diameter of Whole MESA Cohort with Aorta MRI (n=3573) to Participants without Influential Predictors* (n=1612)
* Participants with hypertension, diabetes, lipid lowering medication use, coronary calcium score value > 95th percentile and total cholesterol value > 95th percentile were excluded
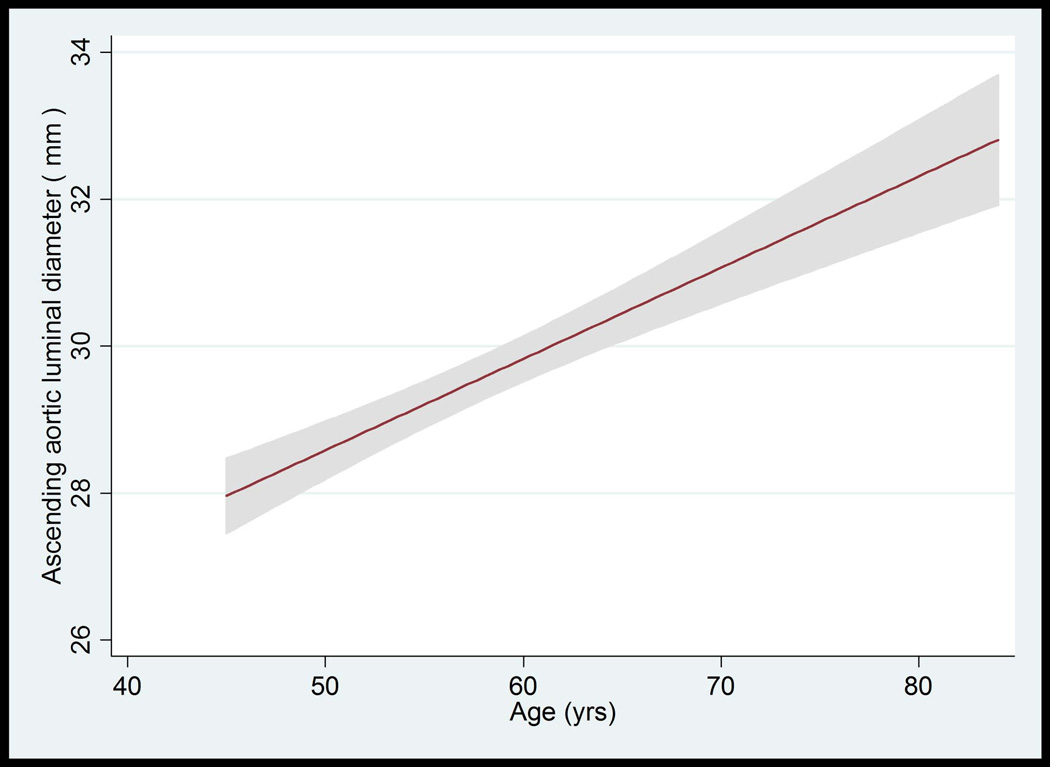
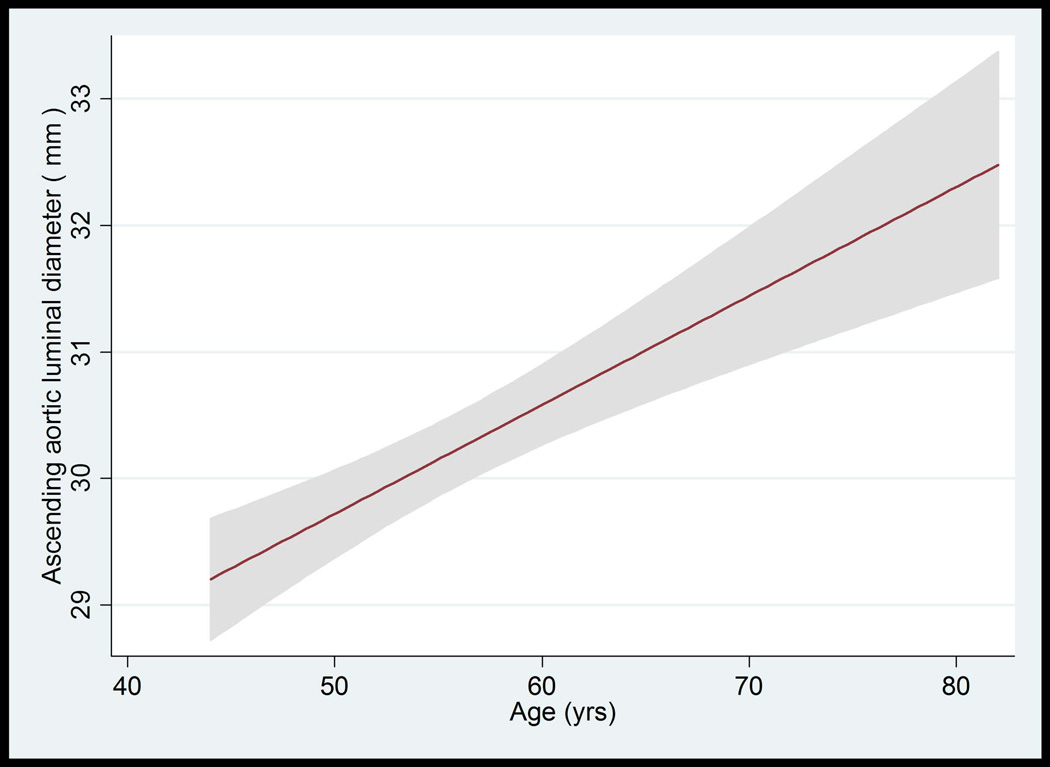
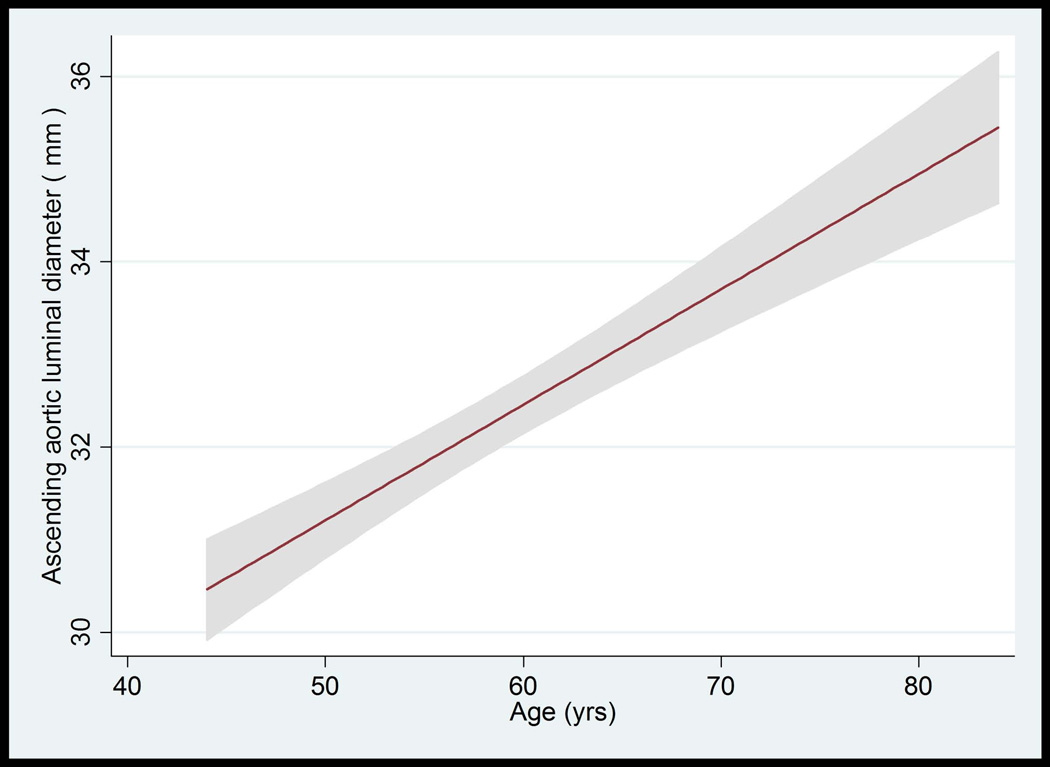
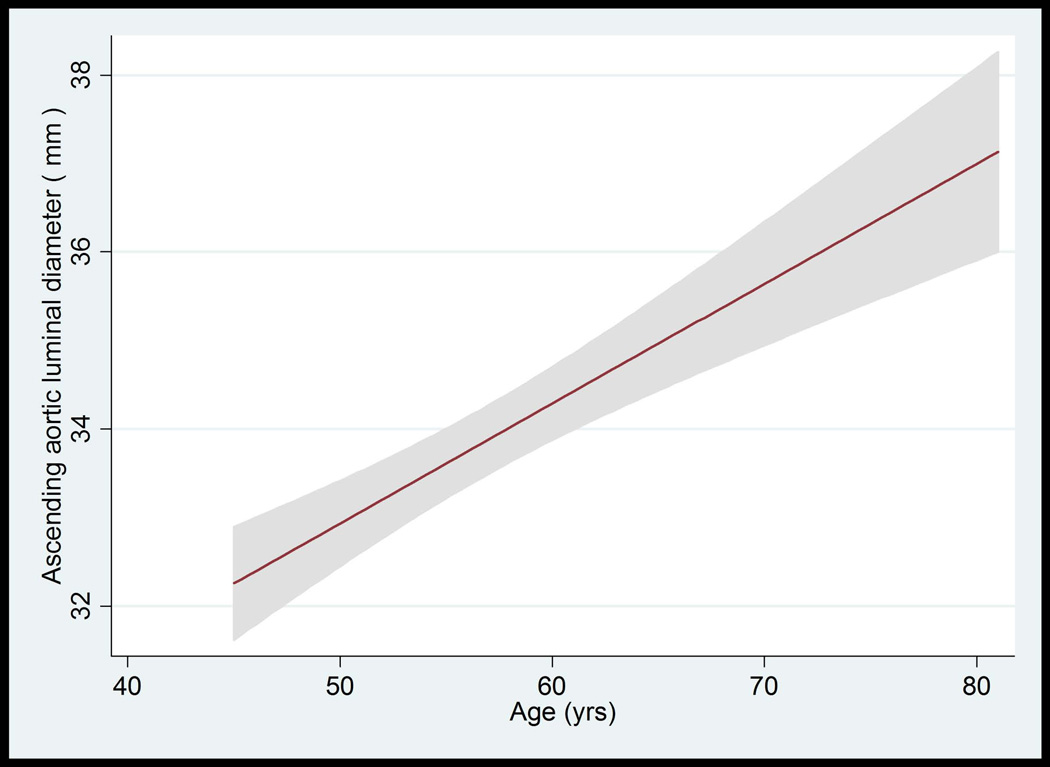
The median value of AA luminal diameter increased approximately by 1 mm per each decade for both men and women. The trend of greater AA luminal diameter with increased age was similar for all race/ethnic groups (not shown). The upper limits (95th percentile) of ascending aortic luminal diameter for age categories of 45–54, 55–64, 65–74, and 75–84 years were 34.4, 36.4, 36.3 and 37.1 mm in women, respectively. These values were 37.3, 40.7, 41.0, 40.8 mm in men, respectively (Table 4, Figure 3A–D).
Table 4.
Ascending Aortic Luminal Diameter by Age and Gender in MESA Participants without Influential Risk Factors* (N=1612)
| WOMEN | ||||||
|---|---|---|---|---|---|---|
| AGE CATEGORIES (years) |
N | AVERAGE ASCENDING AORTIC LUMINAL DIAMETER (mm) |
||||
| 5th percentile | Median | 95th percentile | Min | Max | ||
| 45–54 | 416 | 24.6 | 28.8 | 34.4 | 17.8 | 37.7 |
| 55–64 | 232 | 25.7 | 30.1 | 36.4 | 23.7 | 40.5 |
| 65–74 | 157 | 26.1 | 30.6 | 36.3 | 24.2 | 40.0 |
| 75–84 | 37 | 26.8 | 31.1 | 37.1 | 26.7 | 37.2 |
| MEN | ||||||
| AGE CATEGORIES (years) |
N | AVERAGE ASCENDING AORTIC LUMINAL DIAMETER (mm) |
||||
| 5th percentile | Median | 95th percentile | Min | Max | ||
| 45–54 | 345 | 27.2 | 31.6 | 37.3 | 25.2 | 44.6 |
| 55–64 | 229 | 28.1 | 32.8 | 40.7 | 24.4 | 49.8 |
| 65–74 | 139 | 28.7 | 34.2 | 41.0 | 27.8 | 43.9 |
| 75–84 | 57 | 28.6 | 34.7 | 40.8 | 27.7 | 43.5 |
Participants with hypertension, diabetes, lipid medication use, coronary calcium score value > 95th percentile and total cholesterol value > 95th percentile were excluded.
BSA: Body Surface Area
Figure 3.
A–D: Ascending Aorta Diameter in Relation to Age and Body Surface Area.
A: The mean value and 95% Normal Confidence Limits for Ascending Aorta Diameter in relation to age in women with a body surface area < 0.17 m2.
B: The mean value and 95% Normal Confidence Limits for Ascending Aorta Diameter in relation to age in women with a body surface area ≥ 0.17 m2
C: The mean value and 95% Normal Confidence Limits for Ascending Aorta Diameter in relation to age in men with a body surface area < 0.2 m2
D: The mean value and 95% Normal Confidence Limits for Ascending Aorta Diameter in relation to age in men with a body surface area ≥ 0.2 m2
Table 5 shows 5th, 50th, 95th percentile values of BSA-indexed AA luminal diameter stratified by age and gender, respectively. The upper limits (95th percentile) of BSA-indexed AA luminal diameter for age categories of 45–54, 55–64, 65–74, and 75–84 years were 21, 22, 22, and 28 mm/m2 in women; whereas these values were 20, 21, 22, 23 mm/m2 in men, respectively. The formula for predicting the mean ascending aortic luminal diameter is 14.99 + 0.12 x age + 1.79 (if male) + 4.63 x BSA.
Table 5.
Body Size Indexed Ascending Aortic (AA) Luminal Diameter by Age and Gender in MESA Participants without Influential Risk Factors* (N=1612)
| WOMEN | ||||||
|---|---|---|---|---|---|---|
| AGE CATEGORIES (years) |
N | AVERAGE BSA INDEXED AA LUMINAL DIAMETER (mm/m2) |
||||
| 5th percentile | Median | 95th percentile | Min | Max | ||
| 1: 45–54 | 416 | 13.5 | 16.7 | 20.7 | 11.2 | 23.4 |
| 2: 55–64 | 232 | 14.8 | 17.6 | 22.1 | 12.8 | 25.8 |
| 3: 65–74 | 157 | 14.5 | 18.1 | 22.1 | 13.0 | 26.7 |
| 4: 75–84 | 37 | 15.3 | 19.7 | 28.2 | 15.3 | 28.8 |
| MEN | ||||||
| AGE CATEGORIES (years) |
N | AVERAGE BSA INDEXED AA LUMINAL DIAMETER (mm/m2) |
||||
| 5th percentile | Median | 95th percentile | Min | Max | ||
| 1: 45–54 | 345 | 13.3 | 15.9 | 19.5 | 11.6 | 22.3 |
| 2: 55–64 | 229 | 13.6 | 16.8 | 21.1 | 12.6 | 24.3 |
| 3: 65–74 | 139 | 14.2 | 17.8 | 21.8 | 12.8 | 25.1 |
| 4: 75–84 | 57 | 15.2 | 18.6 | 22.6 | 14.7 | 23.6 |
Participants with hypertension, diabetes, lipid medication use, coronary calcium score value > 95th percentile and total cholesterol value > 95th percentile were excluded.
BSA: Body Surface Area
The upper limit of normal (95th percentile) and BSA indexed AA luminal diameter for women was 35.8 mm and 22 mm/m2 for Caucasians, 36.4 mm and 25 mm/m2 for Chinese-Americans, 35.4 mm and 20 mm/m2 for African-Americans, and 35.4 mm and 21 mm/m2 for Hispanics. For men, these values were 40.3mm and 20 mm/m2 for Caucasians, 37.9mm and 23 mm/m2 for Chinese-Americans, 39.6mm and 20 mm/m2 for African-Americans, and 39.1 mm and 21 mm/m2 for Hispanics, respectively.
AA Luminal Diameter and Wall Thickness Using Black Blood Fast Spin Echo
Of 1,053 MESA participants with spin echo images, 312 participants had no risk factors associated with AA luminal diameter.
The mean AA wall thickness was 2.8 mm and showed no significant association with age (p=0.78), gender (p=0.06), CAC score (p=0.5), or maximum common carotid artery intima-media thickness (p=0.08).
DISCUSSION
In a large, population-based study conducted in the United States of men and women with a mean age of 61 years, the upper limit of BSA-indexed ascending aortic luminal diameter (95th percentile) for age categories of 45–54, 55–64, 65–74, and 75–84 years was proposed as 21, 22, 22, and 28 mm/m2 in women; whereas these values were 20, 21, 22, 23 mm/m2 in men, respectively. The mean AA wall thickness was 2.8 mm with no significant change by age and gender. Age, male gender, and BSA were major determinants of mean AA luminal diameter, accounting for 26 % of its variability. Variation of AA luminal diameter by race/ethnicity was of minor clinical significance.
Prior knowledge about the normal limits of AA diameter was mainly from single center studies performed using TTE (1), MRI (5) (7), electron beam tomography, and MDCT (2,17–20). The measurement of AA diameter depends on the characteristics of the image acquisition and resolution. It is measured as luminal diameter in some of these studies (1,5,17,18,21) and as outer diameter in others (2,7,18,20). The mean values of AA luminal diameter were between 29 and 32 mm for women and between 32 and 35 mm for men. AA mean outer diameter values were between 31 and 34 mm and 34 and 40 mm for women and men, respectively. Our results are in the similar range of published studies for AA luminal diameter (mean ± standard deviation: 30 ±3 for women, 33 ±4 mm for men). Variation between these studies may also in part be due to aortic pulsatility and the sequence performed in MRI. The AA diameter changes approximately by 7–8% (~ 2–3 mm) over the cardiac cycle (17–19). The current study allows us to measure the AA luminal diameter using cine phase contrast MRI. A phase contrast sequence would not be the first choice to determine aortic size and in MESA study it was performed to obtain asending aortic distensibility.
The positive relationship between age (1,2,5,17–20), gender (1,2,18,20), body surface area (1,17,20), and ascending aortic diameter has been previously reported in smaller studies. Our results are consistent with previous studies. AA diameter was greater with advancing age for both genders and across all ethnicities.
Previous studies reported contradictory results about the role of high blood pressure as a major risk factor for ascending aortic dilatation. In the Framingham heart study, blood pressure variables showed inconsistent associations (DBP and MBP were positively related, SBP and PP were negatively related) with aortic root dimension (22). In the SPARC study, AA diameter did not show any association with systolic and diastolic blood pressures; whereas aortic diameter at the level of sinuses of Valsalva was negatively associated with systolic blood pressure (1). Chironi et al. (20) reported a positive relationship between AA diameter and hypertension, and systolic and diastolic blood pressure. In the current study, blood pressure measurements were standardized at 6 sites evaluating more than 6814 subjects. Our data indicate that all blood pressure related variables were consistently and positively associated with AA diameter, although the overall effect size is small.
Chironi et al. (20) reported a positive association between CAC and AA diameter after adjustments for age, gender, and BSA, similar to the current study. In our study, this association remained significant in the fully adjusted model. Other subclinical measures of atherosclerosis (maximum common and internal carotid artery IMT) and systemic inflammatory markers (IL-6 and CRP) showed no clinically significant relationship to AA.
As a limitation, selection of participants in MESA was designed to minimize biases typically associated with studies of volunteers, but does not necessarily represent a random sample of the U.S. population. Smaller sample sizes for some ethnicities may have limited our ability to detect ethnic interactions. The cross sectional design of the study impairs the ability to establish the temporal and causal nature of the associations. The thoracic aorta diameter was measured at a single site of ascending aorta from a single slice.
In conclusion, major determinants of AA diameter were age, gender, and body size. AA diameter increased gradually with advancing age for both genders and among all race/ethnicities. We provide normal reference values of AA luminal diameter as well as wall thickness with the objective of defining enlargement of the ascending aorta.
Acknowledgement
The authors thank the other investigators, the staff, and the participants of the MESA study for their valuable contributions. A full list of participating MESA investigators and institutions can be found at http://www.mesa-nhlbi.org.
Funding/Support: This research was supported by contracts N01-HC-95159 through N01-HC-95169 from the National Heart, Lung, and Blood Institute and NIH intramural research program.
REFERENCES
- 1.Agmon Y, Khandheria BK, Meissner I, et al. Is aortic dilatation an atherosclerosis-related process? Clinical, laboratory, and transesophageal echocardiographic correlates of thoracic aortic dimensions in the population with implications for thoracic aortic aneurysm formation. Journal of the American College of Cardiology. 2003;42(6):1076–1083. doi: 10.1016/s0735-1097(03)00922-7. [DOI] [PubMed] [Google Scholar]
- 2.Wolak A, Gransar H, Thomson LE, et al. Aortic size assessment by noncontrast cardiac computed tomography: normal limits by age, gender, and body surface area. Jacc. 2008;1(2):200–209. doi: 10.1016/j.jcmg.2007.11.005. [DOI] [PubMed] [Google Scholar]
- 3.Evangelista A. Diseases of the aorta: aneurysm of the ascending aorta. Heart (British Cardiac Society) 96(12):979–985. doi: 10.1136/hrt.2008.152751. [DOI] [PubMed] [Google Scholar]
- 4.Hiratzka LF, Bakris GL, Beckman JA, et al. 2010 ACCF/AHA/AATS/ACR/ASA/SCA/SCAI/SIR/STS/SVM guidelines for the diagnosis and management of patients with Thoracic Aortic Disease: a report of the American College of Cardiology Foundation/American Heart Association Task Force on Practice Guidelines, American Association for Thoracic Surgery, American College of Radiology, American Stroke Association, Society of Cardiovascular Anesthesiologists, Society for Cardiovascular Angiography and Interventions, Society of Interventional Radiology, Society of Thoracic Surgeons, and Society for Vascular Medicine. Circulation. 2010;121(13):e266–e369. doi: 10.1161/CIR.0b013e3181d4739e. [DOI] [PubMed] [Google Scholar]
- 5.Garcier JM, Petitcolin V, Filaire M, et al. Normal diameter of the thoracic aorta in adults: a magnetic resonance imaging study. Surg Radiol Anat. 2003;25(3–4):322–329. doi: 10.1007/s00276-003-0140-z. [DOI] [PubMed] [Google Scholar]
- 6.Mohiaddin RH, Schoser K, Amanuma M, Burman ED, Longmore DB. MR imaging of age-related dimensional changes of thoracic aorta. Journal of computer assisted tomography. 1990;14(5):748–752. doi: 10.1097/00004728-199009000-00012. [DOI] [PubMed] [Google Scholar]
- 7.Wanhainen A, Themudo R, Ahlstrom H, Lind L, Johansson L. Thoracic and abdominal aortic dimension in 70-year-old men and women--a population-based whole-body magnetic resonance imaging (MRI) study. J Vasc Surg. 2008;47(3):504–512. doi: 10.1016/j.jvs.2007.10.043. [DOI] [PubMed] [Google Scholar]
- 8.Redheuil A, Yu WC, Mousseaux E, et al. Age-related changes in aortic arch geometry: relationship with proximal aortic function and left ventricular mass and remodeling. J Am Coll Cardiol. 2011;58(12):1262–1270. doi: 10.1016/j.jacc.2011.06.012. [DOI] [PMC free article] [PubMed] [Google Scholar]
- 9.Bild DE, Bluemke DA, Burke GL, et al. Multi-ethnic study of atherosclerosis: objectives and design. American journal of epidemiology. 2002;156(9):871–881. doi: 10.1093/aje/kwf113. [DOI] [PubMed] [Google Scholar]
- 10.Du Bois D, Du Bois EF. A formula to estimate the approximate surface area if height and weight be known. 1916. Nutrition. 1989;5(5):303–311. discussion 312–303. [PubMed] [Google Scholar]
- 11.Chobanian AV, Bakris GL, Black HR, et al. Seventh report of the Joint National Committee on Prevention, Detection, Evaluation, and Treatment of High Blood Pressure. Hypertension. 2003;42(6):1206–1252. doi: 10.1161/01.HYP.0000107251.49515.c2. [DOI] [PubMed] [Google Scholar]
- 12.Association. AD. Diagnosis and classification of diabetes mellitus. Diabetes Care. 2004;27(Suppl 1):S5–S10. doi: 10.2337/diacare.27.2007.s5. [DOI] [PubMed] [Google Scholar]
- 13.Carr JJ, Nelson JC, Wong ND, et al. Calcified coronary artery plaque measurement with cardiac CT in population-based studies: standardized protocol of Multi-Ethnic Study of Atherosclerosis (MESA) and Coronary Artery Risk Development in Young Adults (CARDIA) study. Radiology. 2005;234(1):35–43. doi: 10.1148/radiol.2341040439. [DOI] [PubMed] [Google Scholar]
- 14.McDermott MM, Liu K, Criqui MH, et al. Ankle-brachial index and subclinical cardiac and carotid disease: the multi-ethnic study of atherosclerosis. American journal of epidemiology. 2005;162(1):33–41. doi: 10.1093/aje/kwi167. [DOI] [PubMed] [Google Scholar]
- 15.Adame IM, van der Geest RJ, Bluemke DA, Lima JA, Reiber JH, Lelieveldt BP. Automatic vessel wall contour detection and quantification of wall thickness in in-vivo MR images of the human aorta. Journal of magnetic resonance imaging : JMRI. 2006;24(3):595–602. doi: 10.1002/jmri.20662. [DOI] [PubMed] [Google Scholar]
- 16.McClelland RL, Chung H, Detrano R, Post W, Kronmal RA. Distribution of coronary artery calcium by race, gender, and age: results from the Multi-Ethnic Study of Atherosclerosis (MESA) Circulation. 2006;113(1):30–37. doi: 10.1161/CIRCULATIONAHA.105.580696. [DOI] [PubMed] [Google Scholar]
- 17.Lin FY, Devereux RB, Roman MJ, et al. Assessment of the thoracic aorta by multidetector computed tomography: age- and sex-specific reference values in adults without evident cardiovascular disease. Journal of cardiovascular computed tomography. 2008;2(5):298–308. doi: 10.1016/j.jcct.2008.08.002. [DOI] [PubMed] [Google Scholar]
- 18.Mao SS, Ahmadi N, Shah B, et al. Normal thoracic aorta diameter on cardiac computed tomography in healthy asymptomatic adults: impact of age and gender. Academic radiology. 2008;15(7):827–834. doi: 10.1016/j.acra.2008.02.001. [DOI] [PMC free article] [PubMed] [Google Scholar]
- 19.Lu TL, Huber CH, Rizzo E, Dehmeshki J, von Segesser LK, Qanadli SD. Ascending aorta measurements as assessed by ECG-gated multi-detector computed tomography: a pilot study to establish normative values for transcatheter therapies. European radiology. 2009;19(3):664–669. doi: 10.1007/s00330-008-1182-8. [DOI] [PubMed] [Google Scholar]
- 20.Chironi G, Orobinskaia L, Megnien JL, et al. Early thoracic aorta enlargement in asymptomatic individuals at risk for cardiovascular disease: determinant factors and clinical implication. Journal of hypertension. 28(10):2134–2138. doi: 10.1097/HJH.0b013e32833cd276. [DOI] [PubMed] [Google Scholar]
- 21.Hager A, Kaemmerer H, Rapp-Bernhardt U, et al. Diameters of the thoracic aorta throughout life as measured with helical computed tomography. J Thorac Cardiovasc Surg. 2002;123(6):1060–1066. doi: 10.1067/mtc.2002.122310. [DOI] [PubMed] [Google Scholar]
- 22.Vasan RS, Larson MG, Levy D. Determinants of echocardiographic aortic root size. The Framingham Heart Study. Circulation. 1995;91(3):734–740. doi: 10.1161/01.cir.91.3.734. [DOI] [PubMed] [Google Scholar]


