

Abstract
Tumor‐associated macrophages (TAM) play a critical role in promoting tumor development and metastasis. In the present study, we found that legumain, an asparaginyl endopeptidase, was highly expressed on the surface of TAM. A doxorubicin‐based prodrug specifically activated by legumain selectively ablated TAM and resulted in a significant reduction of angiogenic factors and related tumor vessel growth. Treatment with the prodrug also suppressed circulating tumor cells and myeloid immune suppressor Gr‐1+/CD11b+ cells in tumor‐bearing animals. After selective ablation of TAM using the prodrug, tumor growth and metastases were greatly inhibited in murine tumor models. These results indicate that legumain‐activated prodrugs targeting TAM in tumors might represent a novel anticancer strategy.
Tumor‐associated macrophages (TAM) consisting of a polarized M2 macrophage population1, 2 are key regulators of tumor progression.3, 4 Many observations indicate that in the tumor microenvironment TAM perform several protumoral functions, including promotion of tumor growth, angiogenesis, metastasis and suppression of adaptive immunity, and expression of growth factors and matrix proteases.3, 5 Recent studies performed by Wyckoff et al.6 using multi‐photon intra‐vital microscopy provided dramatic visual evidence of the direct interaction of tumor cells with macrophages in the tumor microenvironment and of perivascular macrophage‐assisted tumor cell intravasation, both of which strongly supported the role of TAM in tumor invasion and metastasis. Therefore, TAM are at the center of the invasive microenvironment and represent a novel target for cancer therapy.7
The selection of legumain as a target for the elimination of TAM in tumors is based on our recent finding that legumain is highly upregulated in various tumors but is absent or only present at a very low level in normal tissues from which these tumors arise.8 In recent years, legumain has been observed to be highly expressed in various solid tumors and in acute lymphoblastic leukemia.8, 9, 10, 11, 12, 13 Legumain is a distinct member of the C13 family of cysteine proteases.9, 14, 15 It is well conserved throughout biological kingdoms and was first identified in plants, and subsequently in parasites, as well as in mammals, as the only known asparaginyl endopeptidase (AEP). It has a very restricted specificity requiring an asparagine at the P1 site of substrates.9, 16 We recently discovered that legumain was highly expressed in M2 macrophages induced by Th2 cytokines.5, 17 In contrast, classical macrophages of the M1 phenotype, which perform key immune surveillance functions, express a low level of legumain and lack cell surface presentation of legumain proteins.5, 17 Consistent with these findings, we found that TAM expressed a very high level of legumain on the cell surface in the tumor microenvironment.5, 17 Consequently, targeting TAM that overexpress legumain will not interfere with the biological functions of normal macrophages, including their cytotoxicity and antigen presentation.1, 18
We have designed a cell‐impermeable doxorubicin‐based prodrug (leg‐3) 17, 19 that is specifically activated by legumain in the tumor microenvironment and selectively targets TAM. Our results demonstrate that selective killing of legumain‐expressing TAM led to the inhibition of tumor growth and metastasis, as well as angiogenesis, with an obvious reduction of angiogenic factors and endothelial cells in murine tumor models. The selective targeting of TAM reduced tumor cell intravasation, as demonstrated by the dramatic reduction of circulating tumor cells (CTC) in tumor‐bearing mice. Moreover, the selective ablation of TAM resulted in a drastic reduction of myeloid‐derived suppressor cells (MDSC), thereby improving rather than damaging the immune system. Taken together, our data support the important functions of TAM in tumor progression and metastasis and indicate that legumain‐activated prodrugs might represent a novel anticancer therapeutic strategy against a wide spectrum of solid tumors through the targeting of TAM.
Materials and Methods
Cell culture
The murine breast carcinoma cell line 4T1, murine non‐small‐cell lung carcinoma cell line D121 and colon carcinoma cell line CT26 were cultured in DMEM with 2 mM l‐glutamine and 1 mM non‐essential amino acid containing 10% FBS in a 5% CO2 environment. The human breast cancer cell line MDA‐MB‐231 (ATCC, Rockville, MD, USA) was cultured in Leibovitz's L‐15 medium with 2 mM l‐glutamine containing 10% FBS in a CO2‐free environment.
Isolation of murine bone marrow‐derived macrophages
Balb/c mice were killed, their skin was peeled and then their hind legs were removed and placed in a dish containing sterile PBS. Excess muscle was removed and a 26G needle attached to a 10‐cc syringe was inserted into the bone marrow cavity to wash out cells with serum‐free Eagle's minimal essential medium (EMEM) until the bone appeared white. Bone marrow cells were harvested and then passed through a cell strainer (70 μm) into 50‐mL centrifuge tubes on ice. The cells were centrifuged for 20 min at 500 g at room temperature and then the supernatant was discarded and the cell pellet was resuspended in 5 mL of serum‐free EMEM. Cells were resuspended in EMEM containing 10% FBS and then centrifuged for 10 min at 500 g at 4°C. Cells were resuspended in EMEM to a final concentration of 5 × 10⁶ cells/mL. Next, 1 × 10⁷ cells/mL were plated in six‐well plates containing macrophage colony‐stimulating factor (M‐CSF) (10 ng/mL), interleukin‐4 (IL‐4), IL‐10 and IL‐13 (10 ng/mL) for M2 differentiation and 3 × 10⁷ cells/mL were plated in six‐well plates containing granulocyte macrophage colony‐stimulating factor (GM‐CSF) (10 ng/mL) and interferon‐gamma (IFN‐γ) (1 ng/mL) for M1 differentiation. After the cells were incubated for 24 h in a humidified 37°C, 5% CO2 incubator, medium containing cytokines was changed daily for 4 days.
Double‐marker immunohistochemistry
Raw 264.7 cells were cultured in chamber slides. Tumor tissues were embedded in optimal cutting temperature compound and cut into 8‐μm sections using Cryostep. The slides were brought to room temperature, dried using a hair dryer for 20 min and then fixed in cold acetone at −20°C for 10 min. After incubation with normal goat serum blocking solution for 20 min, the sections were incubated with Avidin D solution for 15 min. The slides were rinsed briefly with PBS and then incubated for 15 min with biotin solution (Avidin/Biotin blocking kit; Vector Laboratories, Burlingame, CA, USA). Subsequently, the slides were incubated with the first primary antibody overnight (biotin‐conjugated rat anti‐mouse CD68 [Serotec, Oxon, UK]) at a 1:100 dilution and then with the secondary antibody and Rhodamine Avidin DCS (red) at a 1:200 dilution. The slides were then incubated with the second primary antibody (sheep anti‐mouse legumain at 0.1 mg/mL) for 1 h at room temperature, followed by incubation with the secondary antibody fluorescein anti‐sheep IgG (green) (Vector Laboratories) at a 1:200 dilution for 40 min. Nuclear staining was performed with DAPI (10 μg/mL) for 10 min and then cover slips were mounted onto the slides with anti‐fade medium.
Immunocytochemical staining
Frozen specimens were cut into 8‐μm sections in a cryostat and fixed in 4% paraformaldehyde for 10 min. The monoclonal antibody rat anti‐mouse CD31 (0.1 mg/mL) (clone MEC133; BD Pharmingen, San Diego, CA, USA) and rat anti‐mouse F4/80 (AbD Serotec, Oxford, UK) were incubated overnight at 4°C, followed by the secondary antibody staining steps as previously described.20, 21 Positive numbers were assessed by two scorers blinded to the treatment group through counting positive numbers/field at ×400 magnification under a microscope. Five different views were chosen to count the numbers in each slice. The statistical significance of differential findings was determined using the Student's t test.
Flow cytometry
The TAM were isolated from Dox‐ or leg‐3‐treated mice and the control mice were inoculated with 4T1 cells. Staining was performed with PE‐labeled anti‐F4/80 antibody (eBioscience, San Diego, CA, USA) in combination with the primary antibody, sheep anti‐mouse legumain and the secondary antibody, FITC‐conjugated rabbit anti‐sheep. The TAM bearing high levels of legumain and F4/80+ were quantified using two‐color flow analysis. CD11b labeled‐phycoerythrin and Gr‐1+‐conjugated FITC antibodies (eBioscience) were used at a 1:50 dilution for 1 h at room temperature.
Angiogenesis factor array
The angiogenesis factor array was used to profile angiogenesis‐related proteins in conditioned medium from the cell culture. Briefly, carefully selected captured antibodies were spotted in duplicate on nitrocellulose membranes. The cell culture supernatants were diluted and mixed with a cocktail of biotinylated detection antibodies before incubation with the array. These complexes were bound by its cognate immobilized captured antibodies on the membrane. Streptavidin–horseradish peroxidase and chemiluminescent detection reagents were added and signals were produced that were proportional to the amount of bound analytes. The Proteome profiler angiogenesis factor array was used to profile the angiogenesis‐related proteins. Curves were generated by quantifying the mean spot pixel densities from the array membrane and were compared with untreated control using image analysis software.
Enrichment of CTC
Briefly, 0.5 mL of blood was collected from a mouse into an EDTA tube (Beckton Dickinson, Franklin Lakes, NJ, USA). The blood was washed once with PBS, followed by lysis of red blood cell. The sample was washed again with AS1 and subsequently incubated with micromagnetic particles conjugated to anti‐mouse CD45 (eBiosciences) to remove white blood cells (WBC) using a magnetic separation stand (Promega, Madison, WI, USA). The supernatants were transferred into a new Eppendorf tube and spun using a microcentrifuge. The resulting cells were spotted onto a slide.
The immunofluorescence staining protocol is similar to that previously described.21 Briefly, cells were fixed in 2% paraformaldehyde in Tris‐buffered saline (TBS; pH 7.2) for 40 min at room temperature, followed by permeabilization using 0.1% Triton X‐100 for 10 min. The sample was blocked with 2% BSA and 2% rabbit serum in TBS for 1 h at room temperature and was then subjected to sequential antibody incubation with anti‐mouse cytokeratin 8 plus 19, biotinylated rabbit anti‐rat IgG, Texas Red‐labeled streptavidin and FITC‐conjugated anti‐mouse CD45. The above antibodies were diluted with blocking solution and washings were performed using 0.2% BSA in TBS after each antibody incubation.
Murine tumor models
All animal experiments were approved by the Institutional Animal Care and Use Committee of the Scripps Research Institute before the experiments were initiated. Six‐week‐old Balb/c mice were subjected to an injection of 5 × 10⁵ 4T1 cells into the right flank of the mammary pad. Three different groups of six animals per group were treated between days 9 and 27 after tumor induction. The treatment consisted of either 100 μL i.v. injections of saline alone (control group) or leg‐3 treatment (100 μg/100 μL leg‐3 in saline) by i.p. injection every 2 days for 2 weeks. The tumor volumes of the treated animals were measured every 2 days, starting on day 9, using microcaliper measurements (volume = length × width × width/2). When the tumor volume reached 1400 mm3, the primary tumor was removed in the control groups (approximately 3 weeks). When the first death occurred, all mice were killed and their lungs were removed and fixed in Bouin's solution. Lung metastases were counted using an anatomy microscope, including five lobes of lung with all micro‐metastases. Each group included 6–8 mice and the experiment was repeated three times.
To induce experimental pulmonary metastases, 1 × 10⁵ D121 cells or 4T1 cells were injected into the tail vein of 6‐week‐old male C57BL/6 and female Balb/c mice. The treatment consisted of either 100 μL i.v. injections of saline alone (control group) or leg‐3 (100 μg/100 μL leg‐3 in saline) by i.p. injection every 2 days for 2 weeks. The mice were then killed. The lungs were removed on day 16 and fixed in the Bouin's solution overnight. Lung metastases were counted using an anatomy microscope.
The MDA‐MB‐231 mouse model was followed as described previously.22 Lung tissues were fixed in 4% paraformaldehyde overnight and marinated in graded 10%, 15% or 20% sucrose with PBS (pH 7.2). Five lobes of both lungs were cut into a series of 8‐μm frozen sections and one out of every 10 sections was selected for staining with hematoxylin and eosin. The metastasis of each section was calculated under microscopy observation and analyzed.
The statistical significance between treatment groups was determined using two‐tailed Student's t tests using Microsoft EXCEL software (Redmond, WA, USA). The statistical significance of the survival curves was determined using the log‐rank test and graphpad prism version 3.0 (GraphPad Software, San Diego, CA, USA).
Results
Legumain was highly expressed in TAM in both primary and metastatic tumors
We have previously reported that legumain is highly expressed by neoplastic, stromal and endothelial cells in tumors, including breast cancer and colon cancer.8, 17 Tumor‐associated macrophages are associated with tumor progression and metastasis; we hypothesized that legumain was highly expressed in TAM. Thus, we collected murine 4T1 breast tumor tissues and examined legumain expression in TAM in the tumor center, tumor periphery and lung metastases. CD68, which demonstrates significant surface expression and functions as a macrophage receptor for oxidized low‐density lipoprotein,23 has been used as a surface marker for macrophages.24 Therefore, double‐fluorescent immunohistochemical staining with anti‐legumain antibody (green) and anti‐CD68 antibody (red), a surface marker for macrophages, was performed. Legumain was found to be strongly stained in the central area of the primary tumor and weakly stained in the tumor periphery and lung metastasis (Fig. 1a–c). Surprisingly, co‐localization analysis of legumain and CD68 in tumor tissue showed that legumain was highly expressed in CD68‐positive TAM in both the primary tumor and lung metastasis (Fig. 1a–c). Although legumain was weakly stained in the 4T1 tumor periphery area, TAM consistently demonstrated double‐positive staining for legumain and CD68 (Fig. 1b). We also analyzed legumain expression in tumor cells (4T‐1 and MDA‐MB‐231). The western blotting and immunofluorescent results showed that legumain was also upregulated in these cells (Fig. S1), which is consistent with the results previously reported by us and other groups.8, 11
Figure 1.
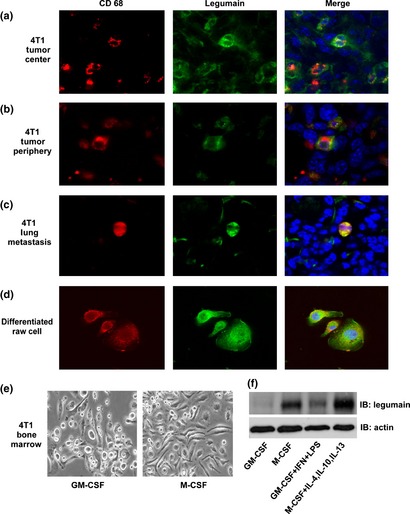
Legumain was highly expressed on the surface of tumor‐associated macrophages (TAM) in both primary and metastatic murine mammary carcinoma models. (a–c) Representative confocal images of the 4T1 tumor central area (a), periphery area (b) and lung metastasis (c) stained with anti‐legumain antibody (green) and anti‐CD68 antibody (red, a marker for macrophages). The TAM were both positive for legumain (green) and CD68 (red). (d) RAW264.7 cells were stimulated with interleukin‐4 (IL‐4), IL‐10 and IL‐13 (10 ng/mL), either singularly or combined. Legumain (green) and CD68 (red) were shown to be highly expressed on cells. (e, f) Bone marrow cells isolated from Balb/c mice were differentiated into M1 and M2 macrophages using cytokines granulocyte macrophage colony‐stimulating factor (GM‐CSF) (10 ng/mL), interferon‐gamma (IFN‐γ) (0.5 ng/mL) and LPS (1 ng/mL) to differentiate M1 macrophages and cytokines macrophage colony‐stimulating factor (M‐CSF) (10 ng/mL), IL‐4, IL‐10 and IL‐13 (10 ng/mL) to differentiate M2 macrophages. Representative images of differentiated cells are shown (e). Legumain expression on M2 macrophages was analyzed using western blotting (f). The data represent three independent experiments. IB, immunoblot.
Because TAM have been characterized as a polarized M2 macrophage population, a finding that is in contrast to that observed for classic macrophages (M1 type),1, 2 we further examined legumain expression in M2 macrophages induced by the RAW 264.7 cell line following stimulation with IL‐4, IL‐10 and IL‐13 (10 ng/mL).5 Consistently, legumain (green) was found to be highly expressed on these cells (Fig. 1d). The colocalization of legumain and CD68 indicated that portions of legumain reside on the surface of TAM (Fig. 1a–d). Although legumain was discovered as a lysosomal enzyme, we previously reported that legumain was observed on the cell surface.8 Moreover, we isolated primary murine bone marrow cells to differentiate into M1 and M2 macrophages. The cytokines GM‐CSF (10 ng/mL), IFN‐γ (0.5 ng/mL) and LPS (1 ng/mL) induce M1 macrophages and the cytokines M‐CSF (10 ng/mL), IL‐4, IL‐10 and IL‐13 (10 ng/mL) induce M2 macrophages.25 As reported, classic M1 macrophages displayed a round shape and amoeboid appearance, whereas M2 macrophages were more elongated (Fig. 1e). The western blotting results further confirmed that legumain was highly expressed on M2 macrophages compared with M1‐type macrophages induced by GM‐CSF (Fig. 1f). The FACS further supported high legumain localization on the cell surface of TAM (Fig. S2).
Taken together, these data demonstrated that legumain was highly expressed in TAM in both primary and metastatic murine mammary carcinoma.
The TAM population was decreased in tumor stroma by leg‐3 treatment
We designed a cell‐impermeable doxorubicin‐based prodrug leg‐3 by covalently linking a succinyl‐blocked substrate peptide that is specifically activated by legumain to the aminoglycoside of doxorubicin (Fig. S3).17 This prototype cell‐impermeable tumor microenvironment‐activated prodrug is inactive and non‐toxic until activated extracellularly by legumain in the acidic tumor microenvironment.17, 26
Because legumain was highly expressed on the surface of TAM, we used leg‐3 to treat the murine breast cancer model and investigated its potential effect on TAM and tumor progression. Immunohistochemical staining analysis with the anti‐CD68 antibody showed that populations of TAM were decreased significantly in both the primary tumor (Fig. 2a, right picture) and lung metastasis (Fig. 2b, right picture) after leg‐3 treatment compared with saline treatment. The quantification of CD68‐positive cells per field at ×400 magnification showed that leg‐3 significantly reduced the number of TAM by fourfold compared with the control group (Fig. 2a,b, right). Leg‐3 treatment resulted in significant necrosis. Next we performed flow cytometry to analyze the population of TAM in the tumor stroma after treatment with doxorubicin (Dox) or leg‐3 by double staining with the anti‐F4/80 antibody (a marker for macrophages) combined with the anti‐legumain antibody. A significant decrease in TAM was observed in the leg‐3 treatment group (Fig. 2c, upper right) compared with the saline or Dox treatment group (P < 0.001) (Fig. 2c, lower right). These data demonstrate that the population of TAM was significantly ablated in the tumor stroma by leg‐3 treatment.
Figure 2.
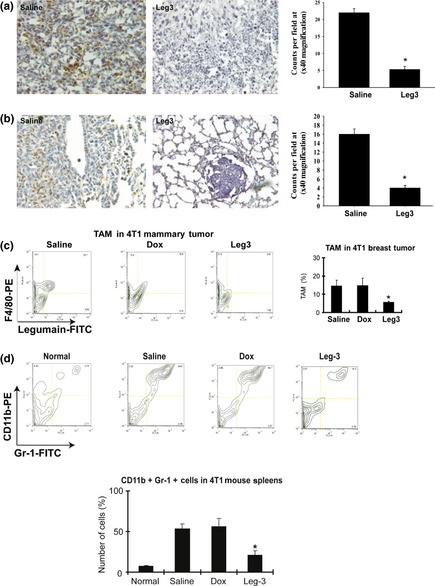
Tumor‐associated macrophages (TAM) and myeloid‐derived suppressor cells were decreased by leg‐3 treatment. (a, b) Representative confocal images of immunohistochemical staining with anti‐CD68 antibody in 4T1 breast tumor tissue (a) and lung metastasis (b) of control and Leg‐3 treatment groups. (c) The population of TAM in the tumor stroma was analyzed using flow cytometric analyses with F4/80 and legumain double staining after Dox and leg‐3 treatment. The TAM were dramatically decreased in the leg‐3 treatment group (upper right). The statistical significance of the leg‐3 group was calculated using the Student's t‐test (*P < 0.001 compared with saline and Dox). (d) The population of myeloid immune suppressor cells (Gr‐1+/CD11b+) in the spleen was analyzed using flow cytometry with CD11b‐PE and Gr‐1‐FITC double staining after Dox or leg‐3 treatment. Statistical analysis used the Student's t‐test (*P < 0.001). Data represent the mean ± SD of three independent experiments.
Inhibition of TAM by leg‐3 suppressed myeloid‐derived suppressor Gr‐1 +/CD11b+ cells in tumor‐bearing animals
Recent findings have suggested that myeloid‐derived suppressor Gr‐1+/CD11b+ cells induced by tumors directly contribute to tumor growth and angiogenesis.27, 28, 29 These cells aid in tumor development by not only providing molecules and factors essential for tumor growth and neovascularization but also by exerting profound inhibitory activity on both tumor‐specific and non‐specific T lymphocytes.30 Because TAM have been reported to increase the Gr‐1+/CD11b+ cell population in tumors,31, 32 we speculated that those cells are also affected by leg‐3 after selective inhibition of TAM. The population of myeloid‐derived suppressor cells (Gr‐1+/CD11b+) in the spleen of 4T1 tumor‐bearing mice was examined using CD11b‐PE and Gr‐1‐FITC double staining after Dox or leg‐3 treatment. The result showed that Gr‐1 + /CD11b+ cells were dramatically decreased in the leg‐3 treatment group compared with the saline or Dox group (P < 0.001) (Fig. 2d). These data indicate that selective ablation of TAM by leg‐3 suppressed myeloid‐derived suppressor cells in tumor‐bearing animals.
Leg‐3 treatment reduced levels of angiogenic factors and related tumor vessels in tumors
The TAM can influence tumor metastasis in several ways because they secrete various tumor growth factors, proangiogenic factors and proteases that stimulate tumor angiogenesis and tumor growth and metastases. To assess whether the elimination of TAM reduces the release of some of these factors, tumor tissue cells were collected from leg‐3‐treated mice and control animals. Freshly isolated tumor cells were cultured and their supernatants were collected at 24 and 48 h (day 1 and day 2, respectively). The levels of angiogenic factors were analyzed in the murine CT26 colon carcinoma model. Consistent with the 4T1 breast cancer model, TAM were significantly reduced in the CT26 colon carcinoma model after leg‐3 treatment (4 mg/kg) (Fig. 3a). All angiogenic factors were decreased compared with those in the control, except PF‐4, which was increased at day one and decreased thereafter (Fig. 3b,c). We further examined tumor vessels using the endothelial marker CD31 after leg‐3 treatment for 2 weeks. Compared with the saline group, CD31‐positive expression was reduced after the leg‐3 treatment (Fig. 3d). CD31‐positive cells were assessed by two scorers blinded to the treatment groups through counting positive cells/field at × 400 magnification under a microscope (Fig. 3d, right). The statistical significance of differential findings was determined using the Student's t‐test. Together, these results further support that leg‐3 treatment reduced TAM in the colon carcinoma and breast carcinoma models and the levels of angiogenic factors and related tumor vessels were inhibited by leg‐3 treatment.
Figure 3.
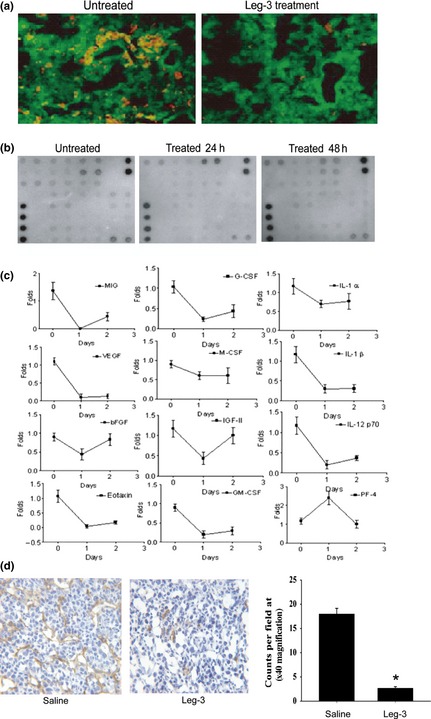
Leg‐3 treatment reduced the level of angiogenic factors and blood vessels in tumors. (a) The population of tumor‐associated macrophages (TAM) was analyzed using immunohistochemical staining with anti‐CD68 (red) and anti‐legumain (green) antibodies in a CT26 colon cancer model treated with or without leg‐3. (b) CT26 colon tumor tissue was harvested and the supernatants of tumor tissue cells cultured for 24 and 48 h were collected. The concentrations of angiogenic factors were measured. Representative results of angiogenic factor arrays. (c) Quantification of levels of angiogenic factors during leg‐3 treatment. (d) The population of endothelial cells was analyzed using immunohistochemical staining with anti‐CD31 antibody after leg‐3 treatment for 2 weeks. Data represent three independent experiments.
Leg‐3 treatment inhibited CTC in tumor‐bearing animals
Condeelis and colleagues reported that TAM carried tumor cells circulating in the blood, that is, CTC.33 We hypothesized that the elimination of TAM would also decrease CTC. Based on recently published results on CTC in metastatic breast cancer patients,34, 35 we performed a CTC study using the murine 4T1 mammary carcinoma model.
Consistent with previous reports, 4T1 tumor cells were found (Fig. 4a) among WBC in circulating blood (Fig. 4a, WBC). However, compared with the saline treatment, those CTC were found to have undergone obvious cell death by the leg‐3 treatment (Fig. 4a, saline and leg‐3 treatment). We repeated this experiment three times and found that the number of CTC in the leg‐3 treatment group was significantly reduced compared with the saline control group (P < 0.001) (Fig. 4b). These results demonstrate that the leg‐3 treatment effectively reduced CTC in tumor‐bearing animals.
Figure 4.
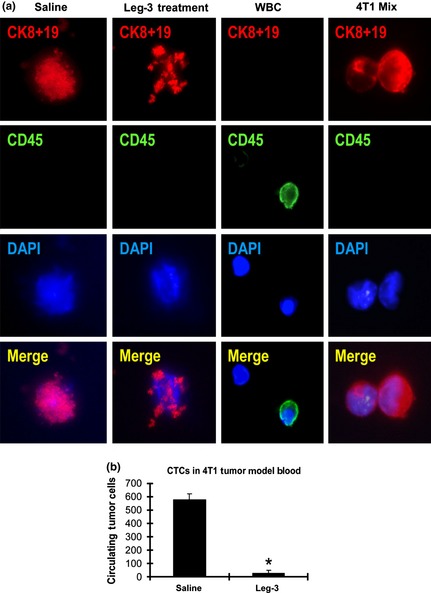
Leg‐3 treatment decreased circulating tumor cells (CTC) in 4T1 breast cancer‐bearing animals. (a) The CTC were analyzed using immunofluorescence staining with anti‐cytokeratin 8 plus 19 (red). DAPI was used for nuclear staining (blue) and CD45 (green) is the marker for white blood cells. (b) The numbers of control and leg‐3 groups (n = 6/group) with standard deviation are shown. Statistical analysis using the Student's t test demonstrated that the difference between the leg‐3 treated and control groups was significant (*P < 0.001). Data represent the mean ± SD of three independent experiments.
Leg‐3 treatment inhibited tumor progression in a murine mammary carcinoma model
Accumulating evidence indicates that TAM promote tumor cell survival and invasion, and targeting legumain in TAM of breast cancer was recently validated by our collaborators and us using a vaccine approach.17 Here, we demonstrate that leg‐3 specifically targeting TAM effectively inhibited primary tumor growth and metastasis. The 4T1 cells were inoculated by injection in the right flank of the mammary pad. Three different groups (n = 6/group) of mice were treated daily with i.p. injection from day 1 through day 10 after tumor induction. Treatment involved 100 μL of saline alone, doxorubicin (0.2 mg/kg in 100 μL of saline) and leg‐3 (4 mg/kg in 100 μL of saline). The leg‐3 treatment significantly inhibited tumor growth compared with groups treated with saline or Dox (P < 0.001 compared with saline; P < 0.001 compared with Dox) (Fig. 5a). We further examined the effects of leg‐3 on a 4T1 spontaneous lung metastasis model. The 4T1 cells were inoculated into the mammary pad and surgical removal of primary tumors was performed when the tumor volume reached 1400 mm3. These mice were further monitored for spontaneous lung metastasis. All mice were killed when the first death occurred. Lung metastatic foci were counted and representative lungs from the treatment groups (Saline, Dox and leg‐3) are shown in Figure 5(b) (left panel). Statistical analysis demonstrated that the differences between the leg‐3 treatment and the saline or Dox groups were significant (P < 0.01) (Fig. 5b, right panel).
Figure 5.
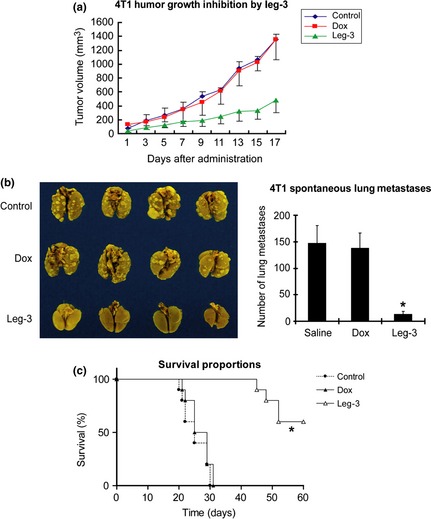
Inhibition of murine 4T1 tumor growth and metastasis in Balb/c mice treated with leg‐3. (a) Tumor volume was monitored every 2 days from the start of tumor induction. Tumor volume was expressed as the mean ± SD P < 0.001 compared with saline; P < 0.002 compared with Dox. (b) Effect of leg‐3 on 4T1 spontaneous lung metastasis. Three groups of mice (as in [A]) were killed on day 17, the lungs were harvested and metastatic foci were counted. Representative lungs from treatment groups (saline, Dox and Leg‐3) are shown. The mean number of metastatic foci per group (n = 6) with standard deviation is shown. Statistical analysis used the Student's t test. (c) Survival analysis of Balb/c mice with spontaneous lung metastases. Statistical significance (*P < 0.001) was calculated using the Cox–Mantel log‐rank test. Data represent the mean ± SD of three independent experiments.
Survival analysis was performed in the 4T1 murine mammary carcinoma model. Compared with the saline and Dox groups, the leg‐3 treatment significantly extended survival (Fig. 5c). Statistical significance (P < 0.001) was calculated using the Cox–Mantel log‐rank test (Fig. 5c). Taken together, our data support that the selective ablation of TAM by leg‐3 significantly inhibited tumor growth and metastasis, as well as extended the host's survival.
Leg‐3 treatment inhibited experimental lung metastasis in tumor models
Metastasis is the primary cause of mortality in most cancer patients and is greatly influenced by non‐malignant cells of the tumor microenvironment.36 Therefore, we performed leg‐3 treatment in three different experimental lung metastasis models: murine D121 lung cancer, 4T1 breast cancer and human MDA‐MB‐231 breast cancer. Compared with the control groups, leg‐3 treatment led to a statistically significant reduction of lung metastasis in all models (P < 0.001) (Fig. 6). These results demonstrate that selective ablation of TAM by leg‐3 effectively suppresses metastasis.
Figure 6.
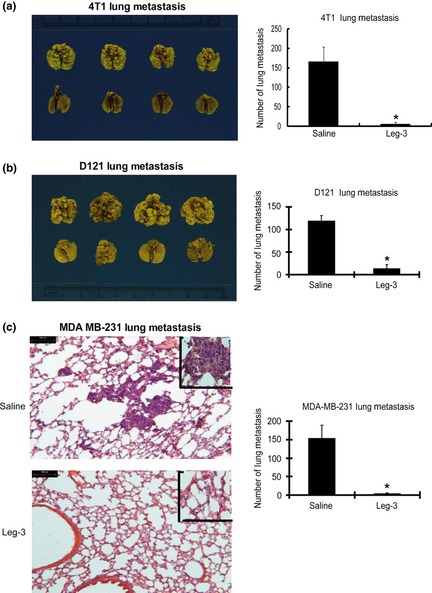
Efficacy of treating murine D121 lung cancer, 4T1 breast cancer and human MDA‐MB‐231 breast cancer for experimental lung metastasis using leg‐3. (a) Six‐ to seven‐week‐old female Balb/c mice inoculated with 4T1 cells were divided into control and leg‐3 treatment groups. Representative lobes of lungs from control (upper) and leg‐3 treatment (lower) groups are shown. The mean number of metastatic foci per group (n = 6) with standard deviation is shown. Statistical analysis using the Student's t‐test revealed that the difference between the control and leg‐3‐treated groups was significant (*P < 0.001). (b) Seven‐week‐old female C57BL/6 mice inoculated with D121 cells were divided into control and leg‐3 treatment groups. Representative lobes of lungs from control (upper) and leg‐3 treatment (lower) groups are shown. The mean number of metastatic foci per group (n = 6) with standard deviation is shown. Statistical analysis using the Student's t‐test revealed that the difference between the control and leg‐3‐treated groups was significant (*P < 0.001). (c) Six‐ to seven‐week‐old female SCID mice inoculated with MDA‐MB‐231 cells were divided into control and leg‐3 treatment groups. Lung colonies of the tumor masses were counted. Representative sections of lungs from control (left, upper panel) and leg‐3 treatment (left, lower panel) groups are shown. The mean number of metastatic foci per group (n = 6) with standard deviation is shown. Statistical analysis using the Student's t‐test revealed that the difference between the control and leg‐3‐treated groups was significant (*P < 0.001). Data represent the mean ± SEM of three independent experiments.
Discussion
The TAM play important roles in tumor progression.25, 37 Targeting TAM in the tumor microenvironment has distinctive advantages because TAM are non‐transformed and considerably more sensitive to chemotherapeutic agents than tumor cells that are frequently multi‐drug resistant. In recent studies, anti‐TAM induced by small molecule inhibitors and vaccines effectively suppressed tumor suppression.5, 38 For example, the antitumor agent Yondelis has inhibitory effects on TAM viability, differentiation and cytokine production, which are likely to contribute to the antitumor activity of this agent in inflammation‐associated human tumors.38 An antagonist of the chemokine CCL5 that was shown to be important in the recruitment of TAM reduced the tumor infiltrate and slowed tumor growth.39 Recently, our group reported that a legumain‐based DNA vaccine induced a robust CD8+ T‐cell response against TAM, which dramatically reduced their density in tumor tissues, resulting in suppression of tumor growth and metastasis.5 Hence, although the therapeutic targeting of TAM is still in its infancy, the initial clinical results are encouraging because they suggest that targeting TAM might be a new anticancer strategy.
In the present study, we found that legumain was highly expressed on TAM in the tumor stroma. Taking advantage of legumain's enzymatic activity, we designed a unique cell‐impermeable doxorubicin‐based prodrug (leg‐3), which is specifically activated by legumain, to effectively eliminate TAM (Fig. S4). The prodrug treatment significantly reduced the population of TAM in tumors and resulted in a significant reduction in angiogenic factors and related blood vessels. The antiangiogenic effect was demonstrated by reduced vessel density in treated tumors. Moreover, the leg‐3 treatment suppressed CTC and MDSC. Consequently, the prodrug therapy exerted a combined antiangiogenic and anti‐tumor effect. We observed that tumor growth, invasion and metastasis were significantly inhibited in murine models. Because the prodrug effectively avoids the original doxorubicin's toxicity, the targeted prodrug activation permits frequent dosing at an effective level, which is critical for preventing the recovery of TAM and effectively eradicating tumor cells. Although tumor cells and endothelial cells also show legumain expression,8, 17 leg‐3 might also target these cells to improve treatment efficacy. Doxorubicin is a chemotherapy drug that is administered to treat many different types of cancers with a dose of 2–7.5 mg/kg. In the present study, 4 mg/kg of leg‐3 significantly suppressed tumor development, whereas a comparable dose of free doxorubicin (0.2 mg/kg) did not show obvious effects (Figs 5b,6a). As we have previously reported, increasing the dose of doxorubicin to 5 mg/kg reduced tumor development with obvious toxicity to the heart.3 For this reason, we designed a pro‐drug that significantly increased drug potency.
Consistent with the importance of TAM in angiogenesis and tumor progression, the accumulation of TAM promotes apparent angiogenic responses at the site of metastasis. More importantly, the administration of this prodrug significantly reduces metastasis in both spontaneous and experimental metastasis models. The prodrug suppressed spontaneous metastasis following the surgical removal of primary tumors and extended the survival of the host without toxicity. Our findings indicate that TAM play a critical role in tumor development and metastasis. The potent in vivo efficacy of the legumain‐activated prodrug suggests that it might represent a novel anticancer strategy targeting multiple steps during tumor metastasis and angiogenesis.
Disclosure Statement
The authors have no conflict of interest.
Supporting information
Fig. S1. Legumain expression in tumor cells.
Fig. S2. Upregulated legumain expression in tumor‐associated macrophages.
Fig. S3. Chemical characteristics of leg‐3.
Fig. S4. A schematic diagram of prodrug leg‐3 activation and function in tumor‐associated macrophages.
Acknowledgments
These studies were supported by CA 127535 and CDMRP grants W81XWH‐05‐1‐0091 and W81XWH‐05‐1‐0318, NIH training grant T32 CA075924 and grants from the National Natural Science Foundation of China (no. 30971137, no. 31171308 and no. 81172208), research fund from Shanghai Advanced Research Institute, Chinese Academy of Sciences (no. 1105022000) and Shanghai Committee of Science and Technology (no. 13XD1402600). We thank Dr Mengjia Tang for providing technical support.
(Cancer Sci, doi: 10.1111/cas.12202, 2013)
References
- 1. Sica A, Larghi P, Mancino A et al Macrophage polarization in tumour progression. Semin Cancer Biol 2008; 18: 349–55. [DOI] [PubMed] [Google Scholar]
- 2. Mills CD, Kincaid K, Alt JM, Heilman MJ, Hill AM. M‐1/M‐2 macrophages and the Th1/Th2 paradigm. Journal of Immunology 2000; 164: 6166–73. [DOI] [PubMed] [Google Scholar]
- 3. Allavena P, Sica A, Solinas G, Porta C, Mantovani A. The inflammatory micro‐environment in tumor progression: the role of tumor‐associated macrophages. Crit Rev Oncol Hematol 2008; 66: 1–9. [DOI] [PubMed] [Google Scholar]
- 4. Jinushi M, Chiba S, Yoshiyama H et al Tumor‐associated macrophages regulate tumorigenicity and anticancer drug responses of cancer stem/initiating cells. Proc Natl Acad Sci USA 2011; 108: 12425–30. [DOI] [PMC free article] [PubMed] [Google Scholar]
- 5. Xiang R, Luo YP, Zhou H et al Targeting tumor‐associated macrophages as a novel strategy against breast cancer. Journal of Clinical Investigation 2006; 116: 2132–41. [DOI] [PMC free article] [PubMed] [Google Scholar]
- 6. Wyckoff JB, Wang Y, Lin EY et al Direct visualization of macrophage‐assisted tumor cell intravasation in mammary tumors. Cancer Res 2007; 67: 2649–56. [DOI] [PubMed] [Google Scholar]
- 7. Bingle L, Brown NJ, Lewis CE. The role of tumour‐associated macrophages in tumour progression: implications for new anticancer therapies. Journal of Pathology 2002; 196: 254–65. [DOI] [PubMed] [Google Scholar]
- 8. Liu C, Sun CZ, Huang HN, Janda K, Edgington T. Overexpression of legumain in tumors is significant for invasion/metastasis and a candidate enzymatic target for prodrug therapy. Cancer Res 2003; 63: 2957–64. [PubMed] [Google Scholar]
- 9. Chen JM, Dando PM, Rawlings ND et al Cloning, isolation, and characterization of mammalian legumain, an asparaginyl endopeptidase. J Biol Chem 1997; 272: 8090–8. [DOI] [PubMed] [Google Scholar]
- 10. Sun XF, Murthy RV, Arbman G, Gao JF, Roodman GD. Legumain expression in relation to clinicopathologic and biological variables in colorectal cancer. Clin Cancer Res 2005; 11: 2293–9. [DOI] [PubMed] [Google Scholar]
- 11. von Wasielewski R, Gawenda J, Traub F, Luck HJ, Kreipe H. Legumain expression as a prognostic factor in breast cancer patients. Breast Cancer Res Treat 2007; 102: 1–6. [DOI] [PubMed] [Google Scholar]
- 12. Saha V, Patel N, Krishnan S et al A dyad of lymphoblastic lysosomal cysteine proteases degrades the antileukemic drug L‐asparaginase. Journal of Clinical Investigation 2009; 119: 1964–73. [DOI] [PMC free article] [PubMed] [Google Scholar]
- 13. Andrade VA, Jardim CA, Melo FM et al Nucleoplasmic calcium regulates proliferation of hepatocytes through legumain and reticulon4. Gastroenterology 2009; 136: 626–35. [Google Scholar]
- 14. Chen JM, Stevens RA, Barrett AJ. Cloning and characterization of mouse legumain. Mol Biol Cell 1997; 8: 2616. [Google Scholar]
- 15. Barrett AJ, Chen JM, Rawlings ND, Stevens RAE. Identification of the active site of legumain links it to caspases, clostripain and gingipains in a new clan of cysteine endopeptidases. FEBS Lett 1998; 441: 361–5. [DOI] [PubMed] [Google Scholar]
- 16. Kalbacher H, Schwarz G, Brandenburg J, Reich M, Burster T, Driessen C. Characterization of legumain. Biological Chemistry 2002; 383: 1813–6. [DOI] [PubMed] [Google Scholar]
- 17. Wu WY, Luo YP, Sun CZ et al Targeting cell‐impermeable prodrug activation to tumor microenvironment eradicates multiple drug‐resistant neoplasms. Cancer Res 2006; 66: 970–80. [DOI] [PubMed] [Google Scholar]
- 18. Sica A, Mantovani A. Macrophage plasticity and polarization: in vivo veritas. Journal of Clinical Investigation 2012; 122: 787–95. [DOI] [PMC free article] [PubMed] [Google Scholar]
- 19. Trouet A, Passioukov A, Van Derpoorten K et al Extracellularly tumor‐activated prodrugs for the selective chemotherapy of cancer: application to doxorubicin and preliminary in vitro and in vivo studies. Cancer Res 2001; 61: 2843–6. [PubMed] [Google Scholar]
- 20. Guo F, Ishiwata T, Yokoyama M, Asano G. Expression of basic fibroblast growth factor, epidermal growth factor, and their receptors in castrated and testosterone injected rat prostates. Acta Histochemica Et Cytochemica 1997; 30: 13–22. [Google Scholar]
- 21. Matsuda K, Maruyama H, Guo F et al Glypican‐1 is overexpressed in human breast cancer and modulates the mitogenic effects of multiple heparin‐binding growth factors in breast cancer cells. Cancer Res 2001; 61: 5562–9. [PubMed] [Google Scholar]
- 22. Guo F, Das S, Mueller BM, Barbas CF, Lerner RA, Sinha SC. Breaking the one antibody‐one target axiom. Proc Natl Acad Sci USA 2006; 103: 11009–14. [DOI] [PMC free article] [PubMed] [Google Scholar]
- 23. Ramprasad MP, Terpstra V, Kondratenko N, Quehenberger O, Steinberg D. Cell surface expression of mouse macrosialin and human CD68 and their role as macrophage receptors for oxidized low density lipoprotein. Proc Natl Acad Sci USA 1996; 93: 14833–8. [DOI] [PMC free article] [PubMed] [Google Scholar]
- 24. Murray PJ, Wynn TA. Obstacles and opportunities for understanding macrophage polarization. J Leukoc Biol 2011; 89: 557–63. [DOI] [PMC free article] [PubMed] [Google Scholar]
- 25. Sica A, Schioppa T, Mantovani A, Allavena P. Tumour‐associated macrophages are a distinct M2 polarised population promoting tumour progression: potential targets of anti‐cancer therapy. Eur J Cancer 2006; 42: 717–27. [DOI] [PubMed] [Google Scholar]
- 26. Vonhoff DD, Layard MW, Basa P et al Risk‐factors for doxorubicin‐induced congestive heart‐failure. Ann Intern Med 1979; 91: 710–7. [DOI] [PubMed] [Google Scholar]
- 27. Yang L, DeBusk LM, Fukuda K et al Expansion of myeloid immune suppressor Gr+CD11b+cells in tumor‐bearing host directly promotes tumor angiogenesis. Cancer Cell 2004; 6: 409–21. [DOI] [PubMed] [Google Scholar]
- 28. Shojaei F, Wu XM, Malik AK et al Tumor refractoriness to anti‐VEGF treatment is mediated by CD11b(+)Gr1(+) myeloid cells. Nat Biotechnol 2007; 25: 911–20. [DOI] [PubMed] [Google Scholar]
- 29. Suzuki E, Kapoor V, Jassar AS, Kaiser LR, Albelda SM. Gemcitabine selectively eliminates splenic Gr‐1(+)/CD11b(+) myeloid suppressor cells in tumor‐bearing animals and enhances antitumor immune activity. Clin Cancer Res 2005; 11: 6713–21. [DOI] [PubMed] [Google Scholar]
- 30. Serafini P, Borrello I, Bronte V. Myeloid suppressor cells in cancer: recruitment, phenotype, properties, and mechanisms of immune suppression. Semin Cancer Biol 2006; 16: 53–65. [DOI] [PubMed] [Google Scholar]
- 31. Gabrilovich DI, Nagaraj S. Myeloid‐derived suppressor cells as regulators of the immune system. Nat Rev Immunol 2009; 9: 162–74. [DOI] [PMC free article] [PubMed] [Google Scholar]
- 32. Mantovani A, Sica A, Allavena P, Garlanda C, Locati M. Tumor‐associated macrophages and the related myeloid‐derived suppressor cells as a paradigm of the diversity of macrophage activation. Hum Immunol 2009; 70: 325–30. [DOI] [PubMed] [Google Scholar]
- 33. Condeelis J, Pollard JW. Macrophages: obligate partners for tumor cell migration, invasion, and metastasis. Cell 2006; 124: 263–6. [DOI] [PubMed] [Google Scholar]
- 34. Cristofanilli M, Budd GT, Ellis MJ et al Circulating tumor cells, disease progression, and survival in metastatic breast cancer. N Engl J Med 2004; 351: 781–91. [DOI] [PubMed] [Google Scholar]
- 35. Molnar B, Ladanyi A, Tanko L, Sreter L, Tulassay Z. Circulating tumor cell clusters in the peripheral blood of colorectal cancer patients. Clin Cancer Res 2001; 7: 4080–5. [PubMed] [Google Scholar]
- 36. Joyce JA, Pollard JW. Microenvironmental regulation of metastasis. Nat Rev Cancer 2009; 9: 239–52. [DOI] [PMC free article] [PubMed] [Google Scholar]
- 37. Mantovani A, Schioppa T, Porta C, Allavena P, Sica A. Role of tumor‐associated macrophages in tumor progression and invasion. Cancer Metastasis Rev 2006; 25: 315–22. [DOI] [PubMed] [Google Scholar]
- 38. Allavena P, Signorelli M, Chieppa M et al Anti‐inflammatory properties of the novel antitumor agent yondelis (Trabectedin): inhibition of macrophage differentiation and cytokine production. Cancer Res 2005; 65: 2964–71. [DOI] [PubMed] [Google Scholar]
- 39. Robinson SC, Scott KA, Wilson JL, Thompson RG, Proudfoot AEI, Balkwill FR. A chemokine receptor antagonist inhibits experimental breast tumor growth. Cancer Res 2003; 63: 8360–5. [PubMed] [Google Scholar]
Associated Data
This section collects any data citations, data availability statements, or supplementary materials included in this article.
Supplementary Materials
Fig. S1. Legumain expression in tumor cells.
Fig. S2. Upregulated legumain expression in tumor‐associated macrophages.
Fig. S3. Chemical characteristics of leg‐3.
Fig. S4. A schematic diagram of prodrug leg‐3 activation and function in tumor‐associated macrophages.