

Abstract
Tendon stem cells (TSCs) may be used to effectively repair or regenerate injured tendons. However, the fates of TSCs once implanted in vivo remain unclear. This study was aimed to determine the feasibility of labeling TSCs with super-paramagnetic iron oxide (SPIO) nano-particles to track TSCs in vivo using MRI. Rabbit TSCs were labeled by incubation with 50 μg/ml SPIO. Labeling efficiency, cell viability, and proliferation were then measured, and the stemness of TSCs was tested by quantitative real time RT-PCR (qRT-PCR) and immunocytochemistry. We found that the labeling efficiency of TSCs reached as high as 98%, and that labeling at 50 μg/ml SPIO concentrations did not alter cell viability and cell proliferation compared to non-labeled control cells. Moreover, the expression levels of stem cell markers (Nucleostemin, Nanog, and Oct-4) did not change in SPIO-labeled TSCs compared to non-labeled cells. Both labeled and non-labeled cells also exhibited similar differentiation potential. Finally, labeled TSCs could be detected by MRI both in vitro and in vivo. Taken together, the findings of this study show that labeling TSCs with SPIO particles is a feasible approach to track TSCs in vivo by MRI, which offers a noninvasive method to monitor repair of injured tendons.
Keywords: Cell labeling, cell tracking, MR imaging
INTRODUCTION
Acute and chronic tendon injuries are common in occupational settings, especially in professional sports players and dancers 34. Once injured, tendons do not regain normal structures, thus resulting in frequent reinjures after repair. Efficiency of such repairs could be increased by understanding tendon biology at the cellular level. Recently, tendon stem/progenitor cells (TSCs) have been identified in humans, mice, rabbits, and rats in addition to the residential cells in tendons, the tenocytes 3, 27, 38. TSCs are tendon-specific adult stem cells, which can differentiate into tenocytes under normal physiological conditions 21, 34, 37, 38. Although bone marrow mesenchymal stem cells (BMSCs) have been used to repair injured tendons, they frequently cause bone formation in healed tendons. Therefore, TSCs may be more suitable than BMSCs to effectively repair acute and chronic tendon or ligament injuries 18, 34.
However, before recommending TSC transplantation to repair tendons in clinical applications, the role of TSCs in tendon healing must be defined. For this, implanted cells must be tracked so that their fate in vivo can be determined. Tracking TSCs requires cell labeling using an enhancement reagent that distinguishes implanted cells from the surrounding host cells.
Enhancement reagents are known to cause harmful effects on cells when used as labeling markers. Therefore, it is critical to identify reagents that have minimal effects on cells’ biological functions. In general, the criteria to select an enhancement reagent are based on factors such as less interference with critical cellular events (e.g. proliferation, differentiation, and metabolism) caused to the cells and availability of a noninvasive method to track the reagent 33. Implanted cells labeled with immuno-fluorescence reagents, radioisotopes, and magnetic reagents can be clearly tracked by biopsy, positron emission tomography (PET), and magnetic resonance imaging (MRI), respectively 19. However, biopsy is an invasive method, and PET has a radiation exposure risk, whereas MRI is completely non-invasive but has risks associated with radiation. Some researchers have reported a rapid, robust, and generic MRI based method to track labeled cells’ in vivo 30. MRI can also be repetitively used to track labeled cells, which makes it one of the most useful clinical cell tracking tools available.
Among the several magnetic labeling reagents that enhance MRI, superparamagnetic iron oxide (SPIO) nano-particles are the frequently used 36. SPIO nano-particles have been clinically approved to track transplanted cells 4, 6, 12 and have also been used to label rat gliosarcoma cells 25, marrow stromal cells 15, chondrocyte cells 17, and bone marrow stem cells 23. However, there are no reports on SPIO-labeling of tendon cells for in vivo cell tracking.
Our group is interested in the use of TSC therapy to promote the effective repair of injured tendons. Towards that end, we aim to determine the fates of transplanted TSCs using SPIO for noninvasive MRI tracking. Thus, the purpose of this study was to investigate the biological features of TSCs after labeling with SPIO. Based on previous studies 5, 6, we hypothesized that TSCs maintain their biological characteristics after labeling with an appropriate concentration of SPIO, and that such labeled cells are traceable by MRI. Using both in vitro and in vivo approaches, we found that SPIO labeling did not change TSC viability, proliferation, or stemness, and that labeled cells could be tracked by MRI in a rabbit tendon injury model.
MATERIALS AND METHODS
Culture of rabbit TSCs and verification of their stemness
The protocol to obtain TSCs from rabbits and create a tendon injury model on rabbits was approved by the University of Pittsburgh IACUC. The cells were isolated from fifteen 8–10 weeks old female New Zealand rabbits and cultured at 37°C in 5% CO2 based on our previously published methods 38. Stem cell identity of rabbit TSCs in culture was confirmed by immuno-staining for nucleostemin (NS), octamer-binding transcription factor 4 (Oct-4), and stage-specific embryonic antigen 4 (SSEA-4), which are known stem cell markers 38.
SPIO labeling of TSCs
SPIO labeling was performed using TSCs expressing high levels of stem cell markers NS, Oct-4, and SSEA-4. Cells were seeded into a 6-well plate at a density of 1 × 10⁴/well and cultured with 20% FBS-DMEM for 2 days. The medium in each well was then aspirated, and cells were rinsed once with PBS. Then serum-free labeling medium containing 50 g Fe/ml of SPIO (Sigma, Cat. # 51238) was added to each well and incubated for 4 h. The medium was then removed by aspiration and the cells were rinsed twice with PBS. The labeled cells were then treated with trypsin and culture medium (20%FBS-DMEM) was added to the detached cells to stop the reaction. Then the cells were transferred to tubes, centrifuged at 400g for 5 min and washed twice with PBS to remove trypsin. The obtained cells were re-suspended and used for further experimentation.
SPIO labeling efficiency of TSCs
Labeled TSCs were washed twice with PBS, trypsinized, and re-plated in six-well plates at a seeding density of 10,000 cells/well. After culturing overnight, cells were fixed and stained by Prussian blue according to the manufacturers’ protocol (Sigma-Aldrich, Cat. # 03899-25G), and counterstained by nuclear fast red (Poly Scientific, NY, Cat. # S248-80Z). All stained cells were examined and counted manually under light microscopy. Labeling efficiency was determined by the proportion of SPIO stained cells compared to the total number of cells stained with nuclear fast red. Cells with blue granular staining were considered to be positively stained. At least 100 randomly selected cells were counted per sample at 200× magnification. The area of each microscopic view under such a magnification was about 0.26 mm2.
Viability of SPIO-labeled TSCs
Trypan blue exclusion assay (Sigma, Cat. #T8154) was used to determine cell viability in SPIO-labeled group and control group without labeling. The test was performed on days 2, 4, and 7 after labeling the TSCs. Cells were counted on a hemocytometer to ensure that there were equal numbers of cells in both labeled and non-labeled TSCs samples. Cell morphology was also examined under a microscope (Nikon, Eclipse, TE2000-U).
Proliferation of SPIO-labeled TSCs
Cell population doubling time (PDT) was used as an index to determine cell proliferation 38. When cells were in the exponential growth phase on day 4 after labeling, they were counted in both labeled and non-labeled groups using an auto-cellometer (Nexcelom Bioscience LLC).
Immuno-staining of stem cell markers in SPIO-labeled TSCs
Stem cell markers NS and Nanog were examined using immunocytochemistry. The TSCs were fixed with 4% paraformaldehyde in PBS for 30 min at room temperature, followed by treatment with 0.1% Triton X-100 for 30 min. The cells were then reacted with rabbit anti-nucleostemin antibody (1:250; Santa Cruz Biotechnology, Cat. # B0508) and Nanog antibody (1:500; Santa Cruz Biotechnology, Cat. # 12308) overnight at room temperature. After washing the cells with PBS, Cy3-conjugated goat anti-rabbit secondary antibody (1:500; Millipore, Cat. # 92590) was applied for 2 hr at room temperature. The cells were also counterstained with H33342 staining (Sigma, St Louise). The stained cells were examined using fluorescence microscopy (Nikon, Eclipse, TE2000-U).
Quantitative real-time PCR (qRT-PCR) for gene analysis
The expression of stem cell genes Oct-4 and Nanog in TSCs labeled with or without SPIO on days 4, 7, and 14 was determined using qRT-PCR. Total RNA was extracted using an RNeasy Mini Kit with an on-column DNase I digest (Qiagen). First-strand cDNA was synthesized in a 20μl reaction from 1μg total RNA by reverse transcription with SuperScript II (Invitrogen, http://www.invitrogen.com). Conditions for the cDNA synthesis were: 65°C for 5 min and cooling for 1 min at 4°C, then 42°C for 50 min, followed by 72°C for 15 min. qRT-PCR was carried out using QIAGEN QuantiTect SYBR Green PCR Kit (Qiagen). In a 25μl PCR reaction mixture, 2μl cDNA (total 100 ng RNA) were amplified in a Chromo 4 Detector (MJ Research). Rabbit-specific primers were used to amplify Nanog and Oct-4. Glyceraldehyde-3-phosphate dehydrogenase (GAPDH) was used as an internal control. All primers were synthesized by Invitrogen. After an initial denaturation for 10 min at 95°C, 30 cycles of 50 seconds at 95°C, and 50 seconds at 58°C was performed. At least three independent experiments were performed to obtain relative expression levels of each stem cell gene.
Multi-differentiation potentials of SPIO-labeled TSCs
Multi-differentiation potentials of SPIO-labeled and non-labeled TSCs were examined by determining adipogenesis, chondrogenesis, and osteogenesis of the stem cells. Adipogenesis was detected by an Oil Red O assay, chondrogenesis by Safranin O assay, and osteogenesis by Alizarin Red S assay 38. After culturing in adipogenic, chondrogenic, and osteogenic differentiation induction media for 21 days, cells were washed 3 times with PBS for 5 min each.
Cells cultured in adipogenic medium were fixed in 4% paraformaldehyde for 40 min at room temperature, then washed 3 times with PBS for 5 min each, followed twice with water for 5 min each, and finally incubated in 0.36% Oil Red O solution (Millipore, Cat. # 90358) for 50 min. After washing 3 times with distilled water, the positive cells containing lipid droplets were stained red.
Cells cultured in chondrogenic medium were fixed in ice cold 75% ethanol for 1 h, rinsed twice with distilled water for 5 min each, and stained at room temperature for 30 min with Safranin O solution (Sigma, St. Louis; Cat. # HT904), then rinsed 5 times with distilled water. The positive cells were stained red.
Similarly, cells cultured in osteogenic medium were fixed in chilled 70% ethanol for 1h, rinsed twice with distilled water for 5 min each, followed by staining with Alizarin Red S (Millipore, Cat. # 2003999) at room temperature for 30 min, and finally rinsed 5 times with distilled water. The positively stained cells were orange-red.
All stained samples were examined under an inverted microscope (Nikon eclipse, TE2000-U) and images were obtained using a CCD (charge-coupled device) camera on the microscope and analyzed by SPOT™ imaging software (Diagnostic Instruments, Inc., Sterling Heights, MI).
Gene expression analysis of SPIO-labeled TSCs in differentiation induction media
Gene expression analysis using real time qRT-PCR (see methods above) was performed on SPIO-labeled TSCs and non-labeled cells, after cells were cultured in differentiation induction media for 21 days. Peroxisome proliferator-activated receptor gamma (PPAR) gene was detected for adipogenic induction, SRY-related high mobility group-box gene 9 (Sox9) for chondrogenic induction, and Runt-related transcription factor 2 (Runx2) for osteogenic induction.
In vitro MR imaging test
After labeling TSCs with SPIO, the cells were washed twice with PBS to remove excess SPIOs. After washing, labeled TSCs were counted by an auto-Cellometer, then transferred to eppendorf tubes containing rabbit platelet-rich plasma (PRP), which was prepared from rabbit blood as previously described 39. Briefly, about 9 ml rabbit blood was mixed with 1 ml 3.8% sodium citrate (SC) and the blood-SC mixture was centrifuged at 500 g for 30 min. The resulting supernatant with the platelets was then collected and counted using Cell-DYN Emerald (Abbott Diagnostics; Lake Forest) followed by activation of PRP using 22 mM CaCl2 to obtain cell-containing PRP gels. Finally, the labeled cells were tested on a 3T MR scanner (Magnetom Trio Tim, Siemens Medical Solutions, Erlangen, Germany) compared with unlabeled TSCs. These Eppendorf tubes containing labeled cells were placed in a small water tray (6 cm×10 cm×2 cm) and immersed under water at 15 mm depth. The tray was placed inside an 8-channel knee coil (Invivo Inc., Gainesville, FL, USA) of inner diameter 14 cm and isocentered inside the magnet.
The cell-gel composite samples were imaged using a 3D gradient echo (GRE) sequence with the following acquisition parameters: field of view = 140 mm, matrix size = 512 (or spatial resolution = 0.27mm), slice thickness = 1 mm, number of slices = 80 (without gap between slices due to 3D imaging), flip angle = 25°, repetition time (TR) = 12 ms, echo time (TE) = 4.31 ms with asymmetric echo 40%, receiver bandwidth = 260 Hz/pixel, averages = 1, and total acquisition time (TA) = 8 min 13 sec.
In vivo MR imaging tracking
Four 5-month healthy male New Zealand Rabbits were used to track labeled TSCs in vivo using MR imaging. Briefly, window defects (rectangular, size of 2 mm × mm) were created on rabbit patellar tendons, followed by filling the defects with rabbit PRP gels containing labeled or non-labeled TSCs. After healing for two and three weeks, defects in repaired patellar tendons were examined using the same protocol as for the in vitro experiments to track the labeled TSCs. Rabbits were kept still for ~40 min during the MR imaging by anesthesia injections of both ketamine hydrochloride (20 mg/kg) and xylazine hydrochloride (4 mg/kg).
The primary challenge to visualize tendons using MRI is the magic angle effect 13. Tendons usually appear dark (low signal intensity) on MR images, as they are commonly positioned parallel to the main magnetic field (or an orientation of 0° relative to the main magnetic field). This is not a favorable position to produce a contrast between tendons and SPIO-labeled cells, as both are in low MR signal intensity. However, tendons can be bright (high signal intensity) if they are positioned at the magic angle of 54.7°. This is an ideal position to track SPIO-labeled cells in a tendon. To capture this angle’s view, experimental rabbits were specially positioned in this study, so that the patellar tendons of the rabbits were aligned to the main magnetic field at an angle that was as close as possible to the magic angle. An angle of 45° was achieved under the experimental set-up in this study. Each rabbit was rotated 90° from its usual anterior-posterior position into a special position, or right lateral-decubitus position. Then, the receive coil with a rabbit inside was also rotated to produce an angle for the patellar tendons close to the magic angle.
Histochemical analysis
Three weeks after implantation, rabbit patellar tendon tissues were harvested and placed in pre-labeled base molds filled with frozen section medium (Neg 50; Richard-Allan Scientific; Kalamazoo, MI). Tissue samples in the base mold were quickly immersed in 2-methylbutane chilled in liquid nitrogen and allowed to solidify completely. The tissue blocks were then placed on dry ice and subsequently stored in a deep freezer (−80°C) until used for histological analysis.
The tissue block was sectioned at a thickness of 10 μm, and sections were placed on glass slides and allowed to dry overnight at room temperature. Prussian blue staining was used to detect SPIO-labeled cells in the tissue sections.
Statistical analysis
All data were expressed in means and standard deviations, unless otherwise noted. Student t-test was used for statistical analysis of data on cell viability, PDT, and gene expression. In addition, MRI signals were quantified and then regression analysis was performed on the values. A P-value of less than 0.05 was considered to show a statistically-significant difference between two compared groups (e.g. labeled group vs. non-labeled group).
RESULTS
The efficiency of SPIO labeling of TSCs
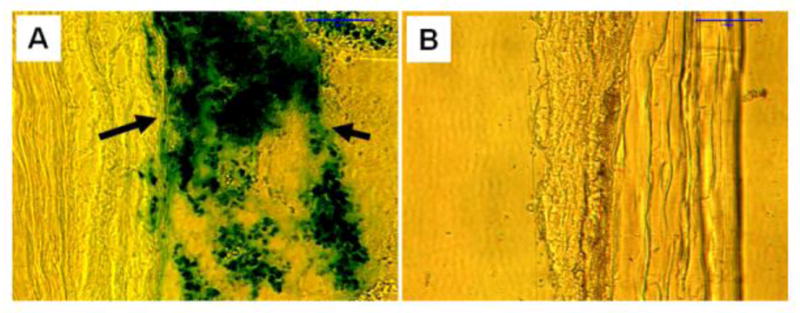
To obtain TSCs for cell culture experiments, we first isolated the cells from rabbit patellar tendons and verified their stemness using immuno-staining (see below), as shown in our previous study 38. Using these TSCs, we proceeded to test labeling efficiency. We found that SPIO particles entered TSCs, as evidenced by blue-green staining, which indicated that SPIO particles were present in cytoplasms, mostly around the nuclei. The labeling efficiency at concentrations of g/ml of SPIO was close to 100%. Moreover, SPIO labeling did not apparently alter cell morphology (Fig. 1).
FIGURE 1.
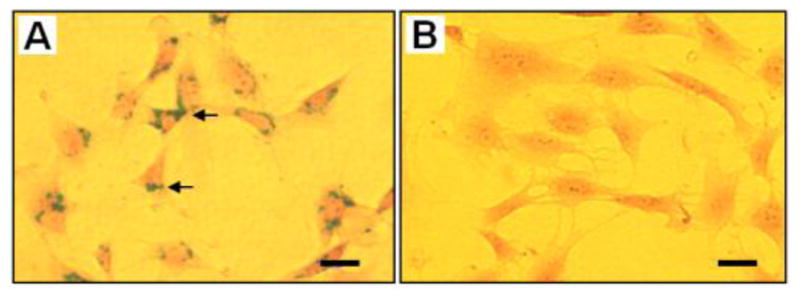
The efficiency of labeling TSCs with SPIO. SPIO particles with Prussian blue staining were present in the cytoplasm of labeled cells, mostly around the nuclei (A, black arrow). No blue-green staining was seen in non-labeled cells (B). Note that SPIO labeling did not induce apparent changes in cell morphology. Bar: 50 m.
Stem cell marker expression of SPIO-labeled TSCs
We then proceeded to determine whether SPIO labeling affected the stemness of TSCs. Using qRT-PCR, we found that, both Oct-4 and Nanog gene expression in the labeled group was not significantly different from the non-labeled group on days 4, 7, and 14 post-labeling (P > 0.05) (Supplementary material 1).
Using immunocytochemical staining, we further showed that both labeled and non-labeled TSCs expressed nucleostemin and Nanog, two known stem cell markers. In both groups, the rates of positive staining were around 90%, and there was no significant difference between the two groups (P > 0.05) in the number of cells positively stained for the two stem cell marker proteins, nuleostemin and Nanog (Fig. 2).
FIGURE 2.

The stem cell marker expression of SPIO-labeled TSCs vs. non-labeled TSCs. The labeled TSCs expressed NS (A, B, pink) and Nanog (C, D, pink). Compared to non-labeled cells (E, gray column), there were no significant differences in NS and Nanog expression after labeling (P-value = 0.21 and 0.52, respectively). Insets show enlarged views of the expressed NS and Nanog in pink. NS: nucleostemin; Bar: 50 m.
Cell viability
Having determined that SPIO labeling did not affect the stemness of TSCs, we next used trypan blue exclusion tests to determine the effects of SPIO labeling on TSC viability. We noticed that both SPIO-labeled and non-labeled groups exhibited about 90% viabilities (Fig. 3). Moreover, at all three time points (days 2, 4, and 7) viability of labeled cells was not significantly different from that in non-labeled cells (P > 0.05).
FIGURE 3.
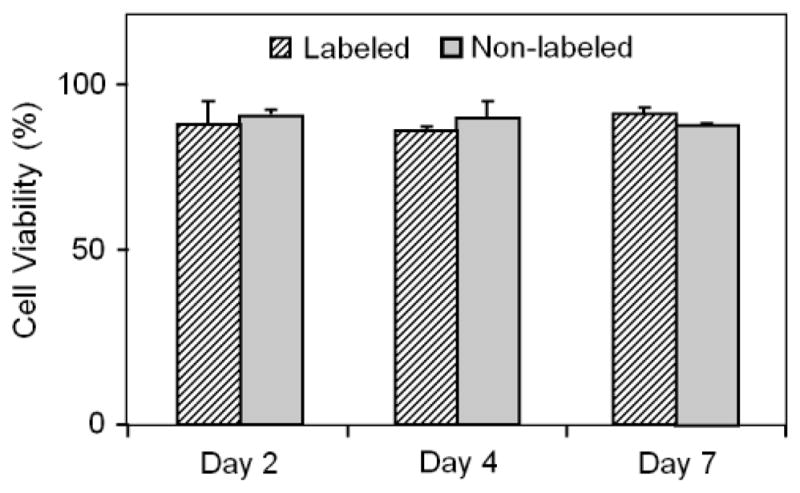
The viability of SPIO-labeled TSCs vs. non-labeled TSCs. Compared with non-labeled cells (gray column), the viability of labeled cells did not significantly change at days 2, 4, and 7 post-labeling (P > 0.05). On average, the viability for both labeled and non-labeled cells was around 90%.
Cell proliferation
The proliferation of SPIO-labeled and non-labeled TSCs were measured by population doubling time (PDT). We found that compared to non-labeled cells, the PDT of labeled cells was not significantly different (P > 0.05) (Fig. 4), indicating that SPIO labeling did not affect the proliferation of SPIO-labeled TSCs.
FIGURE 4.
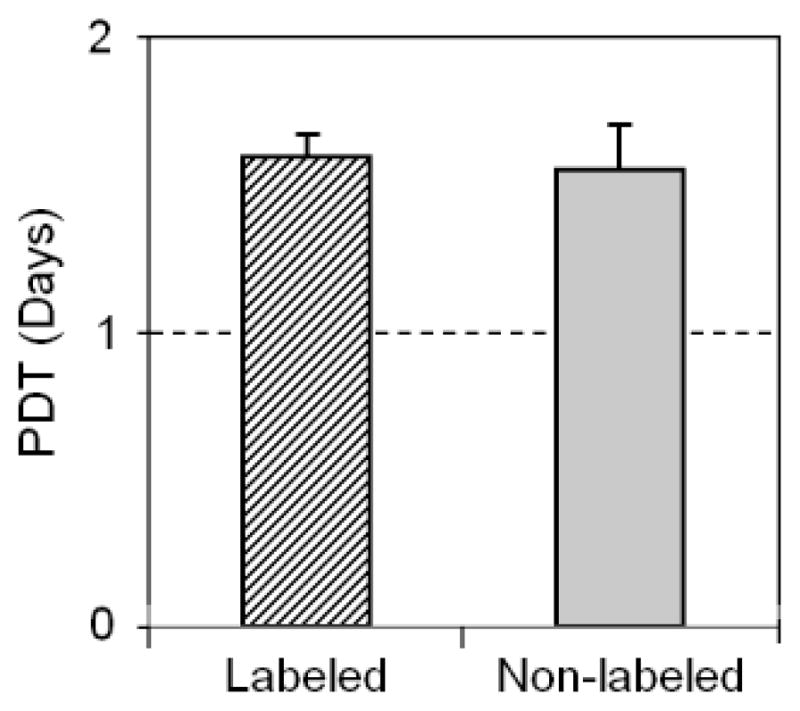
Proliferation of SPIO-labeled TSCs vs. non-labeled TSCs. The population doubling time (PDT) of labeled cells was not significantly different from that of non-labeled cells (P-value = 0.78).
Differentiation potentials of TSCs labeled with SPIO
Next, we determined the effects of SPIO labeling on multi-differentiation potentials of TSCs. Our results showed that when TSCs were cultured in adipogenic differentiation medium for 21 days, numerous lipid droplets were detected in both labeled and non-labeled cell cultures with approximately 63% of TSCs testing positive for lipid vesicles (Fig. 5A, D). Similarly, after culturing in chondrogenic medium for 21 days, both labeled and non-labeled TSCs stained positive for GAG-rich matrix (Fig. 5B, E). In addition, when both labeled and non-labeled TSCs were cultured in osteogenic medium for 21 days, calcium deposits were stained extensively (Fig. 5C, F). Semi-quantification showed that there was no significant difference in stained area between labeled and non-labeled cells in any of the three non-tenocyte differentiations (Fig. 5G). Finally, after 21 days induction, no significant differences were found in the expression of genes PPAR (marker for adipogenesis), Sox9 (marker for chondrogenesis), and Runx2 (marker for osteogenesis) (P > 0.05) (Fig. 6).
FIGURE 5.

The assessment of multi-differentiation potentials of SPIO-labeled TSCs and non-labeled cells. Labeled TSCs were cultured in adipogenic induction medium, chondrogenic induction medium, and osteogenic induction medium for 21 days. The cell differentiation was assessed by Oil red O assay, Safranin O assay, and Alizarin red S assay, respectively. There were no apparent differences in each of three cellular differentiations, as evidenced by respective chemical staining for adipocytes (A, D), chondrocytes (B, E), and osteoblasts (C, F). By semi-quantitative measurement, the extent of each of these three differentiations in labeled cells was not significant compared to that in non-labeled cells (G). (P-value = 0.76, 0.08, and 0.76, respectively). Bar: 500 μm.
FIGURE 6.
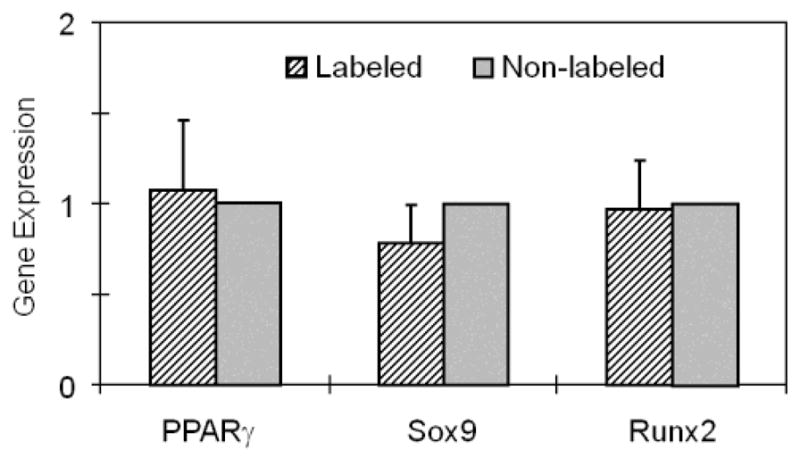
Gene expression analysis of SPIO-labeled TSCs and non-labeled cells. The expression levels of genes PPAR, Sox9, and Runx2 (adipogenic, chondrogenic, and osteogenic markers, respectively) in labeled cells were found not to be different from those in non-labeled cells (P-value = 0.78, 0.21, and 0.85, respectively).
MR imaging of SPIO-labeled TSCs in vitro and in vivo
In vitro study of the labeled TSCs tested by a 3T MR scanner resulted in a marked MR signal (dark) of labeled cells when compared to non-labeled controls (Fig. 7A); the signals were closely related to the density of labeled cells (Fig. 7B, C). In vivo study showed that the intact patellar tendon had bright MR signal of SNR 25.6 (Fig. 7D). Compared to non-labeled cells with SNR 15.8 (Fig. 7E), the labeled TSCs in vivo had similar MR signals of SNR 3.6 in Fig. 7F and 4.2 in Fig. 7G; these labeled cells could be tracked on weeks 2 and 3 post-injury (Fig. 7F, G).
FIGURE 7.

Tracking labeled TSCs in vitro (A–C) and in vivo by MR imaging (D–G). In vitro, the labeled TSCs resulted in a marked MR signal (A1) when compared to non-labeled control (A2), and the intensity of MR signal (gray value, measured by NIH ImageJ) was proportional to the density of labeled cells (B, B1-6: 30, 60, 125, 250, 500, and 1000 labeled TSCs per μl, respectively. The total cell-PRP gel volume was 1 ml. For detailed imaging parameters, see the section In vitro MR imaging test in Materials and Methods). In addition, it is seen that the MR imaging signal (or imaging intensity with an arbitrary unit) changed linearly with SPIO-labeled cell number (C). In vivo tests showed the intact patellar tendon had bright MR signal due to special positioning used in this study (D). Compared with non-labeled control cells in platelet-rich plasma (PRP) (E), the labeled TSCs in PRP in vivo exhibited black MR signals at two weeks (F, arrow) and three weeks after repair (G, arrow).
Prussian blue staining of tendon sections treated with/without SPIO-labeled TSCs
Three weeks after implantation, rabbit patellar tendons were collected and SPIO-labeled cells in the wound area were tested by Prussian blue staining. Histochemical results showed that SPIO-labeled cells remained in the patellar tendon tissues, as evidenced by a strong blue-green staining on tissue sections (Fig. 8A). In contrast, the same rabbits implanted with non-labeled cells were not stained by Prussian blue (Fig. 8B).
FIGURE 8.
Prussian blue staining on rabbit patellar tendon sections after 3 weeks of implantation with SPIO-labeled cells in PRP gel (A) or non-SPIO-labeled cells in PRP gel (B). Frozen section results showed that SPIO-labeled cells were kept in the right place (A, arrows) and stained by vivid blue-green. However, no blue-green was found in the tissue sections with non-SPIO-labeled cells (B). Bar: 100 μm.
DISCUSSION
TSCs are a newly discovered tendon cell type, and they may be an ideal cell source to repair injured tendons. However, to ensure the success of such cell therapy, it is necessary to label cells before their transplantation and then track their fates in vivo. In this study, we were able to show that TSCs could be successfully labeled with SPIO nanoparticles with high efficiency. Moreover, compared to non-labeled TSCs, SPIO-labeled TSCs did not change their stemness, cell viability, cell proliferative potential, or multi-differentiation potential. Finally, our in vitro and in vivo study demonstrated that MR imaging can be used to track SPIO-labeled TSCs.
Previous studies have reported that BMSCs 1, 8, 16, 31, ADSCs 26, 35, NSCs 7, 11, 32, ESCs 5, 9, 10, and peripheral blood endothelial progenitor cells (EPCs) 20,6 could be labeled with SPIO. This study is the first to demonstrate that rabbit TSCs can be labeled successfully with SPIO and that the labeled TSCs can be tracked by MRI.
TSCs can be easily labeled by incubation when the cells exhibit higher endocytosis activity in their undifferentiated stage. There are several methods of labeling such as transfection with either ferumoxide-protamine sulfate complex (FE-Pro) 32 or ferumoxides (FE)-poly-l-lysine (PLL) complexes 2. We used incubation to label TSCs; besides avoiding risks associated with transfections, incubation is much simpler and safer than transfection. However, not all types of cells can be labeled by incubation. We find that only TSCs retaining strong endocytosis abilities in a healthy, non-differentiation state can be SPIO-labeled by incubation. The mechanism of SPIO cellular uptake is likely through receptor-mediated endocytosis 28, 36 and therefore maintaining the cells’ endocytosis capabilities is very important 5.
This study showed that TSCs could be effectively labeled at concentrations of 50 μg Fe/ml of SPIO. To obtain longitudinal MR signal benefits of SPIO contrast reagent in cells, the cells must be labeled with sufficient loading of the contrast reagent 5. However, we found that because of cell proliferation, daughter cells of SPIO labeled cells tend to lose some SPIO labeling; as a result, the initial high labeling efficiency could not be maintained from one passage to the next, especially when SPIO concentration was low. A previous study showed that the dilution of intracellular iron is about 50% per passage 5, a phenomenon we also confirmed in this study (data not shown). In general, higher the SPIO dosage, longer labeling efficiency will be maintained. However, high doses of SPIO may have detrimental effects on cells, such as reduction in cell viability. Therefore, the balance between labeling efficiency, cell viability, and MRI signal should be considered when labeling cells 12, 20,22. Comparing the results from using 100, 50 and 25 μg Fe/ml of SPIO, we found that high labeling efficiency without causing apparent changes to cell morphology can be achieved at 50 μg Fe/ml of SPIO concentrations. In addition, we found that TSCs labeled at the concentration of 50 μg Fe/ml of SPIO exhibited good MR signal both in vitro and in vivo. Therefore, we presume that 50 μg Fe/ml of SPIO is optimal to label TSCs under the experimental conditions used in this study.
MRI tracking of SPIO-labeled TSCs for the repair of tendon defects is still full of challenges. SPIO-labeled TSCs have strong dark signals, while intact tendons are also dark in usual MR imaging. To distinguish normal tendons from damaged tendons repaired with SPIO-labeled TSCs, we used special positioning to take advantage of the magic angle effect, and successfully showed the intact tendons brightly on MR images. While tendon defects repaired with SPIO-labeled TSCs remained dark 24 indicating that these cells remained “labeled” for a prolonged time in vivo, and that majority of the cells, if not all, remained at the tendon injury site. Consequently, this technique has a potential to be translated into clinical applications, as normal tendons have been shown in this study to be distinguishable from damaged tendons repaired with SPIO-labeled TSCs using this MRI technique.
Additionally, MRI tracking in our study showed that labeled TSCs remained in the tendon defect site without migrating to surrounding host tissues two and three weeks after implantation. This finding suggests that PRP is an excellent scaffold; it is known to have chemo-attractant properties 14, 29 and, as a result, can hold cells in the place implanted. Although it is likely that implanted TSCs may have differentiated into progenitor cells, tenocytes or both, our previous study showed that PRP can accelerate TSCs to differentiate into active tenocytes 38. Therefore, PRP, as an autologous blood product, may be used as an excellent scaffold in TSC therapy to effectively repair injured tendons. One limitation of this study is that MRI does not have sufficient resolution to detect individual cells and differentiate the “status” of labeled cells, such as those undergoing phagocytosis, apoptosis, or necrosis. Another limitation is that we do not know the final outcomes of the SPIO-labeled TSCs, including the fate of labeled TSCs, or the metabolism of SPIO nanoparticles in vivo both short and long term. Also note that the in vivo tracking experiment in this study is preliminary and the contributions of these SPIO labeled cells to the healing of injured tendons in vivo were not investigated. Therefore, future study will focus on tracking the long-term outcomes of labeled TSCs in vivo by MRI, and also performing histological, immunochemical, and biomechanical studies to obtain data needed for the clinical application of TSC therapy for injured tendons.
Supplementary Material
The gene analysis of SPIO-labeled TSCs and non-labeled cells. The expression of two stem cell genes, Oct-4 and Nanog, were measured using qRT-PCR. It was found that the expression levels of Oct-4 and Nanog in labeled TSCs were not significantly different from those in non-labeled cells at days 4, 7, and 14 days post-labeling (Oct-4 gene: P-value = 0.24, 0.52, and 0.29, respectively; Nanog gene: P-value = 0.31, 0.79, and 0.97, respectively). Note that the gene expression level of SPIO-labeled cells was normalized with respect to control group (i.e. non-labeled cells) whose gene expression was set to be one.
Acknowledgments
The funding support from NIH (AR049921, AR061395, and AR060920) for this work is gratefully acknowledged (JHW).
References
- 1.Addicott B, Willman M, Rodriguez J, Padgett K, Han D, Berman D, Hare JM, Kenyon NS. Mesenchymal stem cell labeling and in vitro MR characterization at 1.5 T of new SPIO contrast agent: Molday ION Rhodamine-B™. Contrast Media Mol Imaging. 2011;6:7–18. doi: 10.1002/cmmi.396. [DOI] [PMC free article] [PubMed] [Google Scholar]
- 2.Arbab AS, Bashaw LA, Miller BR, Jordan EK, Bulte JW, Frank JA. Intracytoplasmic tagging of cells with ferumoxides and transfection agent for cellular magnetic resonance imaging after cell transplantation: methods and techniques. Transplantation. 2003;76:1123–1130. doi: 10.1097/01.TP.0000089237.39220.83. [DOI] [PubMed] [Google Scholar]
- 3.Bi Y, Ehirchiou D, Kilts TM, et al. Identification of tendon stem/progenitor cells and the role of the extracellular matrix in their niche. Nat Med. 2007;13:1219–1227. doi: 10.1038/nm1630. [DOI] [PubMed] [Google Scholar]
- 4.Bulte JW. In vivo MRI cell tracking: clinical studies. Am J Roentgenol. 2009;193:314–325. doi: 10.2214/AJR.09.3107. [DOI] [PMC free article] [PubMed] [Google Scholar]
- 5.Castaneda RT, Boddington S, Henning TD, Wendland M, Mandrussow L, Liu S, Daldrup-Link H. Labeling human embryonic stem-cell-derived cardiomyocytes for tracking with MR imaging. Pediatr Radiol. 2011;41:1384–1392. doi: 10.1007/s00247-011-2130-3. [DOI] [PubMed] [Google Scholar]
- 6.Castaneda RT, Khurana A, Khan R, Daldrup-Link HE. Labeling Stem Cells with Ferumoxytol, an FDA-Approved Iron Oxide Nanoparticle. J Vis Exp. 2011:e3482. doi: 10.3791/3482. [DOI] [PMC free article] [PubMed] [Google Scholar]
- 7.Chang NK, Jeong YY, Park JS, et al. Tracking of neural stem cells in rats with intracerebral hemorrhage by the use of 3T MRI. Korean J Radiol. 2008;9:196–204. doi: 10.3348/kjr.2008.9.3.196. [DOI] [PMC free article] [PubMed] [Google Scholar]
- 8.Cheng JL, Yang YJ, Li HL, Wang J, Wang MH, Zhang Y. In vivo tracing of superparamagnetic iron oxide-labeled bone marrow mesenchymal stem cells transplanted for traumatic brain injury by susceptibility weighted imaging in a rat model. Chin J Traumatol. 2010;13:173–177. [PubMed] [Google Scholar]
- 9.Chung J, Kee K, Barral JK, et al. In vivo molecular MRI of cell survival and teratoma formation following embryonic stem cell transplantation into the injured murine myocardium. Magn Reson Med. 2011;66:1374–1381. doi: 10.1002/mrm.22929. [DOI] [PMC free article] [PubMed] [Google Scholar]
- 10.Chung J, Yamada M, Yang PC. Magnetic resonance imaging of human embryonic stem cells. Curr Protoc Stem Cell Biol. 2009;Chapter 5(Unit 5A):3. doi: 10.1002/9780470151808.sc05a03s10. [DOI] [PubMed] [Google Scholar]
- 11.Cohen ME, Muja N, Fainstein N, Bulte JW, Ben-Hur T. Conserved fate and function of ferumoxides-labeled neural precursor cells in vitro and in vivo. J Neurosci Res. 2010;88:936–944. doi: 10.1002/jnr.22277. [DOI] [PMC free article] [PubMed] [Google Scholar]
- 12.Crabbe A, Vandeputte C, Dresselaers T, et al. Effects of MRI contrast agents on the stem cell phenotype. Cell Transplant. 2010;19:919–936. doi: 10.3727/096368910X494623. [DOI] [PubMed] [Google Scholar]
- 13.Fullerton GD, I, Cameron L, Ord VA. Orientation of tendons in the magnetic field and its effect on T2 relaxation times. Radiology. 1985;155:433–435. doi: 10.1148/radiology.155.2.3983395. [DOI] [PubMed] [Google Scholar]
- 14.Jiang ZQ, Liu HY, Zhang LP, Wu ZQ, Shang DZ. Repair of calvarial defects in rabbits with platelet-rich plasma as the scaffold for carrying bone marrow stromal cells. Oral Surg Oral Med Oral Pathol Oral Radiol. 2012;113:327–333. doi: 10.1016/j.tripleo.2011.03.026. [DOI] [PubMed] [Google Scholar]
- 15.Li L, Jiang Q, Qu CS, et al. Transplantation of marrow stromal cells restores cerebral blood flow and reduces cerebral atrophy in rats with traumatic brain injury: in vivo MRI study. J Neurotrauma. 2011;28:535–545. doi: 10.1089/neu.2010.1619. [DOI] [PMC free article] [PubMed] [Google Scholar]
- 16.Li YG, Wei JN, Lu J, Wu XT, Teng GJ. Labeling and tracing of bone marrow mesenchymal stem cells for tendon-to-bone tunnel healing. Knee Surg Sports Traumatol Arthrosc. 2011;19:2153–2158. doi: 10.1007/s00167-011-1506-0. [DOI] [PubMed] [Google Scholar]
- 17.Liu G, Xia C, Wang Z, Lv F, Gao F, Gong Q, Song B, Ai H, Gu Z. Magnetic resonance imaging probes for labeling of chondrocyte cells. J Mater Sci Mater Med. 2011;22:601–606. doi: 10.1007/s10856-010-4227-x. [DOI] [PubMed] [Google Scholar]
- 18.Lui PP, Chan KM. Tendon-Derived Stem Cells (TDSCs): From Basic Science to Potential Roles in Tendon Pathology and Tissue Engineering Applications. Stem Cell Rev. 2011;7:883–897. doi: 10.1007/s12015-011-9276-0. [DOI] [PubMed] [Google Scholar]
- 19.Lyons SK. Advances in imaging mouse tumour models in vivo. J Pathol. 2005;205:194–205. doi: 10.1002/path.1697. [DOI] [PubMed] [Google Scholar]
- 20.Mai XL, Ma ZL, Sun JH, Ju SH, Ma M, Teng GJ. Assessments of proliferation capacity and viability of New Zealand rabbit peripheral blood endothelial progenitor cells labeled with superparamagnetic particles. Cell Transplant. 2009;18:171–181. doi: 10.3727/096368909788341306. [DOI] [PubMed] [Google Scholar]
- 21.Ni M, Lui PP, Rui YF, et al. Tendon-derived stem cells (TDSCs) promote tendon repair in a rat patellar tendon window defect model. J Orthop Res. 2011 doi: 10.1002/jor.21559. [DOI] [PubMed] [Google Scholar]
- 22.Nohroudi K, Arnhold S, Berhorn T, Addicks K, Hoehn M, Himmelreich U. In vivo MRI stem cell tracking requires balancing of detection limit and cell viability. Cell Transplant. 2010;19:431–441. doi: 10.3727/096368909X484699. [DOI] [PubMed] [Google Scholar]
- 23.Peng C, Yang K, Xiang P, et al. Effect of transplantation with autologous bone marrow stem cells on acute myocardial infarction. Int J Cardiol. 2013;162:158–165. doi: 10.1016/j.ijcard.2011.05.077. [DOI] [PubMed] [Google Scholar]
- 24.Qian Y, Williams AA, Chu CR, Boada FE. High-resolution ultrashort echo time (UTE) imaging on human knee with AWSOS sequence at 3.0 T. J Magn Reson Imaging. 2012;35:204–210. doi: 10.1002/jmri.22639. [DOI] [PMC free article] [PubMed] [Google Scholar]
- 25.Rad AM, Arbab AS, Iskander AS, Jiang Q, Soltanian-Zadeh H. Quantification of superparamagnetic iron oxide (SPIO)-labeled cells using MRI. J Magn Reson Imaging. 2007;26:366–374. doi: 10.1002/jmri.20978. [DOI] [PMC free article] [PubMed] [Google Scholar]
- 26.Rice HE, Hsu EW, Sheng H, Evenson DA, Freemerman AJ, Safford KM, Provenzale JM, Warner DS, Johnson GA. Superparamagnetic iron oxide labeling and transplantation of adipose-derived stem cells in middle cerebral artery occlusion-injured mice. Am J Roentgenol. 2007;188:1101–1108. doi: 10.2214/AJR.06.0663. [DOI] [PubMed] [Google Scholar]
- 27.Rui YF, Lui PP, Li G, Fu SC, Lee YW, Chan KM. Isolation and characterization of multipotent rat tendon-derived stem cells. Tissue Eng Part A. 2010;16:1549–1558. doi: 10.1089/ten.TEA.2009.0529. [DOI] [PubMed] [Google Scholar]
- 28.Schulze E, Ferrucci JT, Jr, Poss K, Lapointe L, Bogdanova A, Weissleder R. Cellular uptake and trafficking of a prototypical magnetic iron oxide label in vitro. Invest Radiol. 1995;30:604–610. doi: 10.1097/00004424-199510000-00006. [DOI] [PubMed] [Google Scholar]
- 29.Sell SA, Wolfe PS, Ericksen JJ, Simpson DG, Bowlin GL. Incorporating platelet-rich plasma into electrospun scaffolds for tissue engineering applications. Tissue Eng Part A. 2011;17:2723–2737. doi: 10.1089/ten.tea.2010.0663. [DOI] [PMC free article] [PubMed] [Google Scholar]
- 30.So PW, Kalber T, Hunt D, Farquharson M, Al-Ebraheem A, Parkes HG, Simon R, Bell JD. Efficient and rapid labeling of transplanted cell populations with superparamagnetic iron oxide nanoparticles using cell surface chemical biotinylation for in vivo monitoring by MRI. Cell Transplant. 2010;19:419–429. doi: 10.3727/096368910X498250. [DOI] [PubMed] [Google Scholar]
- 31.Sun JH, Zhang YL, Qian SP, Yu XB, Xie HY, Zhou L, Zheng SS. Assessment of biological characteristics of mesenchymal stem cells labeled with superparamagnetic iron oxide particles in vitro. Mol Med Report. 2012;5:317–320. doi: 10.3892/mmr.2011.637. [DOI] [PubMed] [Google Scholar]
- 32.Thu MS, Najbauer J, Kendall SE, et al. Iron labeling and pre-clinical MRI visualization of therapeutic human neural stem cells in a murine glioma model. PLoS One. 2009;4:e7218. doi: 10.1371/journal.pone.0007218. [DOI] [PMC free article] [PubMed] [Google Scholar]
- 33.van Buul GM, Kotek G, Wielopolski PA, et al. Clinically translatable cell tracking and quantification by MRI in cartilage repair using superparamagnetic iron oxides. PLoS One. 2011;6:e17001. doi: 10.1371/journal.pone.0017001. [DOI] [PMC free article] [PubMed] [Google Scholar]
- 34.Wang JH, Guo Q, Li B. Tendon Biomechanics and Mechanobiology-A Minireview of Basic Concepts and Recent Advancements. J Hand Ther. 2012;25:133–140. doi: 10.1016/j.jht.2011.07.004. [DOI] [PMC free article] [PubMed] [Google Scholar]
- 35.Wang L, Deng J, Wang J, et al. Superparamagnetic iron oxide does not affect the viability and function of adipose-derived stem cells, and superparamagnetic iron oxide-enhanced magnetic resonance imaging identifies viable cells. Magn Reson Imaging. 2009;27:108–119. doi: 10.1016/j.mri.2008.05.013. [DOI] [PubMed] [Google Scholar]
- 36.Wang YX, Hussain SM, Krestin GP. Superparamagnetic iron oxide contrast agents: physicochemical characteristics and applications in MR imaging. Eur Radiol. 2001;11:2319–2331. doi: 10.1007/s003300100908. [DOI] [PubMed] [Google Scholar]
- 37.Zhang J, Li B, Wang JH. The role of engineered tendon matrix in the stemness of tendon stem cells in vitro and the promotion of tendon-like tissue formation in vivo. Biomaterials. 2011;32:6972–6981. doi: 10.1016/j.biomaterials.2011.05.088. [DOI] [PMC free article] [PubMed] [Google Scholar]
- 38.Zhang J, Wang JH. Characterization of differential properties of rabbit tendon stem cells and tenocytes. BMC Musculoskelet Disord. 2010;11:10. doi: 10.1186/1471-2474-11-10. [DOI] [PMC free article] [PubMed] [Google Scholar]
- 39.Zhang JWJ. Platelet-rich plasma releasate promotes differentiation of tendon stem cells into active tenocytes. Am J Sports Med. 2010;38:2477–2486. doi: 10.1177/0363546510376750. [DOI] [PubMed] [Google Scholar]
Associated Data
This section collects any data citations, data availability statements, or supplementary materials included in this article.
Supplementary Materials
The gene analysis of SPIO-labeled TSCs and non-labeled cells. The expression of two stem cell genes, Oct-4 and Nanog, were measured using qRT-PCR. It was found that the expression levels of Oct-4 and Nanog in labeled TSCs were not significantly different from those in non-labeled cells at days 4, 7, and 14 days post-labeling (Oct-4 gene: P-value = 0.24, 0.52, and 0.29, respectively; Nanog gene: P-value = 0.31, 0.79, and 0.97, respectively). Note that the gene expression level of SPIO-labeled cells was normalized with respect to control group (i.e. non-labeled cells) whose gene expression was set to be one.