

Abstract
Rapidly proliferating and neoplastically transformed cells generate the energy required to support rapid cell division by increasing glycolysis and decreasing flux through the oxidative phosphorylation pathway (OXPHOS), usually without alterations in mitochondrial function. In contrast, little is known of the metabolic alterations, if any, which occur in cells harboring mutations that prime their neoplastic transformation. To address this question, we used a Pten-deficient mouse model to examine thyroid cells where a mild hyperplasia progresses slowly to follicular thyroid carcinoma. Using this model, we report that constitutive PI3K activation caused by PTEN deficiency in non-transformed thyrocytes results in a global down-regulation of Krebs cycle and OXPHOS gene expression, defective mitochondria, reduced respiration and an enhancement in compensatory glycolysis. We found that this process does not involve any of the pathways classically associated with the Warburg effect. Moreover, this process was independent of proliferation but contributed directly to thyroid hyperplasia. Our findings define a novel metabolic switch to glycolysis driven by PI3K-dependent AMPK inactivation with a consequent repression in the expression of key metabolic transcription regulators.
Keywords: Thyroid, Pten, AMPK, TCA cycle, Mouse model
INTRODUCTION
Highly proliferative conditions, such as embryonic development, tissue regeneration, lymphocyte activation, and neoplastic transformation, require a complex reorganization of energy metabolism to feed cell growth and division (1). A major feature of this metabolic remodeling is the switch from oxidative phosphorylation to aerobic glycolysis, a phenomenon that was first observed by Warburg (2). As a consequence, highly proliferating cells exhibit an increase in the amount of lactate production regardless of oxygen availability (3).
It is widely accepted that several oncogenes, including MYC, HIF-1α, and AKT (4–6), drive this switch by increasing the expression and activity of glycolytic genes, including Hexokinase II, Lactate Dehydrogenase A, Pyruvate Kinase M2, and Pyruvate Dehydrogenase Kinase 1 (7–9).
The reduced flux through the tricarboxylic acid cycle (TCA cycle) and oxidative phosphorylation (OXPHOS) is not accompanied by compromised mitochondrial function, and is not associated with alterations in the expression levels of genes involved in oxidative metabolism. One exception to this notion is represented by those tumors in which FH, SDH, or IDH are mutated (10).
To characterize the molecular changes resulting from constitutive activation of the PI3K pathway in tissues where this genetic alteration is causally linked to neoplastic transformation, we have generated a mouse model in which loss of the Pten tumor suppressor gene is targeted to the follicular epithelium of the thyroid gland (11). Thyrocyte-specific deletion of Pten constitutively activates the PI3K signaling cascade, leading to hyperplastic thyroid glands at birth, to the development of thyroid follicular adenomas by 6–8 months of age (11), and of metastatic follicular carcinomas after one year of age (12). The progression to neoplastic transformation is dramatically accelerated by simultaneous Cdkn1b deletion (12), activation of Kras (13), or Tp53 deletion (14).
By analyzing the molecular and metabolic alterations found in thyroids from young, tumor-free Ptenthyr−/− mice, we have discovered a novel mechanism responsible for the active repression of TCA cycle and OXPHOS in pre-neoplastic thyrocytes. This pathway is independent of both proliferation and of the known pathways classically associated with the Warburg effect. We show in fact that PI3K activation induces, through the inactivation of AMPK, a coordinated repression of the expression of TCA cycle and respiratory genes, which favors aerobic glycolysis at the expense of OXPHOS.
MATERIALS AND METHODS
Animals
The PtenL/L and TPO-Cre strains have been previously described (11). PDKL/L mice were kindly provided by Dr. Dario Alessi (15). All strains were backcrossed in the 129Sv background for at least ten generations, and littermates were used as controls. RAD001 (Everolimus, kindly provided by Novartis Institutes for Biomedical Research, Basel, Switzerland) was given daily by p.o. gavage at a dose of 10 mg/kg body weight for 2 weeks, starting at age 4 weeks. AICAR (TRC, Toronto, Canada) was injected i.p. at 400 mg/kg/day, for 4 weeks, starting at age 4 weeks.
Measurement of Glucose Uptake by PET
Wild type and Ptenthyr−/− mice were fasted overnight before a tail vein injection of [18F] fluorodeoxyglucose (300 μCi). One hour after injection, mice were subjected to positron emission tomography (PET) scanning with the Concorde Microsystems R4 microPET Scanner. Animals were imaged while anesthetized by inhalation with isoflurane. Image acquisition was done using the MicroPET Manager with the ASPIRO dedicated software.
Primary Cultures
Thyroid glands were minced and resuspended in Ham’s F12/10% FBS with 100 U/ml type I collagenase (Sigma, St. Louis, MO) and 1 U/ml dispase (Roche, Indianapolis, IN). Enzymatic digestion was carried out for 90 min at 37°C. After digestion, follicles were seeded in Ham’s F12 containing 40% Nu-Serum IV (Collaborative Biomedical, Bedford, MA), gly-his-lys (10ng/ml, Sigma), and somatostatin (10ng/ml, Sigma) and allowed to spread for 24–36h before performing the experiments.
Proliferation Analysis
Anti-Ki67-stained thyroid sections were photographed at x400 magnification and analyzed using the ImageJ software. Between 1500 and 3000 cells per slide were analyzed. For BrdU incorporation experiments, mice were injected i.p. with BrdU (10 mg/Kg, Sigma) dissolved in PBS 2 hours before sacrifice. Anti-BrdU-stained sections were analyzed as above.
Lactate Assay
Lactate levels were assayed using a commercially available kit (Biovision, Mountain View, CA). Lactate levels were normalized to the amount of DNA or proteins extracted from each tissue fragment or primary culture.
Oxygen consumption rate and Extracellular acidification rate
Freshly isolated thyroid follicles from pools of 12 wild type or 3 mutant mice were plated as described in “Primary cultures”, and oxygen consumption rate (OCR) was measured using the Seahorse XF24 instrument (Seahorse Biosciences) under basal conditions, in the presence of the mitochondrial inhibitor oligomycin (1 μg/ml), the mitochondrial uncoupler FCCP (1μM) and the respiratory chain inhibitors antimycin A (2mM) and rotenone (0.1 μM).
Flow cytometry analysis of mitochondrial membrane potential
Primary thyroid cells were treated with solvent or 20 μM Carbonyl cyanide 4-(trifluoromethoxy)phenylhydrazone (FCCP) for 10 min prior to staining with 100 nM Tetramethylrhodamine, ethyl ester (TMRE, Invitrogen) for 20 min. Cells were rinsed in DPBS, trypsinized, and analyzed for TMRE staining by flow cytometry.
Western Blot Analysis
Thyroids and cells were homogenized on ice in RIPA buffer supplemented with Complete protease inhibitor tablet (Roche Diagnostics, Indianapolis, IN). Western blot analysis was carried out using 20–40 μg proteins using antibodies from Cell Signaling Technology (Danvers, MA), except for Aconitase 2, Isocitrate dehydrogenase 3a, HIF1α, and Succinate dehydrogenase b (Santa Cruz Biotechnology, Santa Cruz, CA) and β-actin (Sigma-Aldrich, St. Louis, MO).
Cell Lines and Drug Treatments
FTC-133 cells (kindly donated by Dr. Matthew Ringel, Ohio State University) were maintained in Dulbecco’s modified Eagle’s medium (DMEM) with 10% fetal bovine serum (FBS) at 37°C in 5% CO2. 8505c cells (kindly donated by Dr. Sareh Parangi, Massachusetts General Hospital) and THJ16T cells (kindly donated by Dr. John A. Copland, Mayo Clinic) were grown in RPMI medium with 10% FBS. All cell lines were validated prior to starting the experiments by amplifying and sequencing genomic fragments encompassing their known mutations (FTC133: PTEN R130*,8505c: BRAF V600E, THJ16T: PIK3CA E545K).
Pharmacological inhibitors of PKA (H89, Cell Signaling Technologies), and PI3K (BKM120, Selleck Chemicals, Boston, MA) or AMP analog (AICAR, TRC) were added 24h after plating. After 30 min, samples were collected and prepared for Western blot. For luciferase and qPCR experiments, samples were collected after 72h.
Real Time PCR
Total RNA was extracted with Trizol and reverse transcribed using the Thermoscript kit (Life Technologies, Carlsbad, California). qRT-PCR was performed on a StepOne Plus apparatus using the Absolute Blue qPCR Rox Mix (Thermo Scientific, Waltham, MA) and TaqMan expression assays (Applied Biosystems, Carlsbad, CA). Each sample was run in triplicate and GusB or β-actin was used to control for input RNA. Data analysis was based on the Ct method, and experiments were repeated at least three times using at least two independent thyroid pools (at least five mice/pool).
AMP, ADP, ATP level determination
AMP, ADP, and ATP levels were assayed using three independent thyroid pools (ten mice/pool). Approximately 30 mg of tissue was extracted in 210 μl of extraction solvent, 40%/40%/20% Acetonitrile/Methanol/0.1% FA in water containing a 15N_AMP extraction standard. The column [Sequent ZIC-cHILIC ( 3.5 um, 100 mm × 2.1 mm i.d.)] was run with a gradient of 90% acetonitrile/10% water containing 10 mM Ammonium Formate, pH 3.0 to 10 mM Ammonium Formate, pH 3.0, at 0.2 ml/min using an Aquity UPLC attached to a Waters Xevo triple quadruple MS.
Transient transfection assays
Cells were transfected with 1 μg PGC-1α WT or T177A/S538A plasmid (#1026, #18093, Addgene, Cambridge, MA). After 24h, cells were treated with 1mM AICAR (TRC) for 48h and collected for RNA isolation.
Dual Luciferase Assay
Cells were co-transfected with 10ng phRG-TK plasmid (Promega, Madison, WI) and 2 μg PGC-1α promoter luciferase plasmid (#8887, Addgene, Cambridge, MA). After 24h, cells were treated with inhibitors for 48h and collected for dual-luciferase reporter assay (Promega).
Transmission Electron Microscopy
Thyroid glands were fixed with 2% paraformaldehyde and 2.5% glutaraldehyde in 0.1 M sodium cacodylate buffer, postfixed with 1% osmium tetroxide followed by 1% uranyl acetate, dehydrated through a graded series of ethanol and embedded in LX112 resin (LADD Research Industries, Burlington VT). Ultrathin (80 nm) sections were cut on a Reichert Ultracut UCT, stained with uranyl acetate followed by lead citrate, and viewed on a JEOL 1200EX transmission electron microscope at 80kv.
Proteomic Analysis
Sets of thyroid extracts (100 μg) from 3-month old wild type and mutant mice were subjected to 2D gel electrophoresis (pH 4–11) and Sypro Ruby gel staining as described in (16). About thirty differentially expressed spots were selected for cutting and in-gel tryptic digestion. MALDI TOF peptide mass fingerprinting was performed as described in (16). LC/MS/MS peptide sequencing was performed as described in (17). All analyses were conducted by the Fox Chase Cancer Center Proteomics Facility.
Statistical Analysis
Experiments were performed at least three times. Data were analyzed using the Prism software package. Differences with P-values <0.05 were considered statistically significant.
RESULTS
Constitutive PI3K activity results in transcriptional repression of TCA cycle and OXPHOS genes
The thyroids of Ptenthyr−/− mice are enlarged from birth due to an increase in the thyrocytes’ proliferative index associated with constitutive PI3K signaling. However, these glands do not display any functional alteration or signs of neoplastic transformation until the mice are at least 10 months of age (12).
To identify early molecular changes that may favor or contribute to the development of thyroid tumors in aging mice, we have initially used a small-scale proteomic approach to detect proteins differentially expressed in thyroids from 3 month-old wild type and Ptenthyr−/− mice. Several spots, with significantly different intensity between normal and mutant thyroids, were selected and excised from 2D gels, and thirty-five proteins were identified using MALDI-TOF and LC/MS/MS. Surprisingly, seven of twenty-eight proteins found down-regulated in mutant thyroids were enzymes involved in the TCA cycle (Table 1). In order to validate these findings, we measured by real time PCR the mRNA levels of the genes encoding these proteins, and found that Cs, Aco2, Idh3a, Dld, Pdhb, and SdhA expression in mutant thyroids was reproducibly 20–50% lower compared to that of wild type glands, while the expression of the glucose transporter Glut1 was slightly increased (Figure 1A). Down-regulation of these genes was also confirmed by Western blotting analysis using antibodies specific for Aconitase 2, Isocitrate dehydrogenase 3a, and Succinate dehydrogenase b (Figure 1B).
Table 1.
Proteomic identification of differentially regulated TCA cycle enzymes.
| Swiss-Prot Name | Protein Name | Expression (WT vs. −/−) | ID Method | Score | Coverage | Queries matched |
|---|---|---|---|---|---|---|
| DHSA | Succinate dehydrogenase | 2.71 | MALDI-TOF | 74 | 16 | N/A |
| IDH3A | Isocitrate dehydrogenase | 34.13 | MALDI-TOF | 71 | 25 | N/A |
| MDHM | Malate dehydrogenase | 2.27 | MALDI-TOF | 106 | 30 | N/A |
| ACON | Aconitate hydratase | WT only | LC/MS/MS | 382 | N/A | 15 |
| DLDH | Dihydrolipoyl dehydrogenase | 3.22 | LC/MS/MS | 283 | N/A | 14 |
| ODPB | Pyruvate dehydrogenase | 6.00 | LC/MS/MS | 150 | N/A | 6 |
| CISY | Citrate synthase | 4.01 | LC/MS/MS | 132 | N/A | 9 |
Figure 1. Metabolic reprogramming in Ptenthyr−/− mice.

(A) Relative expression of the indicated genes in wild type and mutant thyroids. Bars represent mean ± SD of triplicate measurements. Asterisks indicate significant (P<0.05) differences. (B) Western blot showing down-regulation of representative TCA cycle enzymes in mutant glands. (C) TCA cycle diagram showing the genes down-regulated in Ptenthyr−/− thyroids. The color scale reflects changes calculated from the Affymetrix data. Genes circled in red have been validated by qPCR. (D) Heat map showing the repression of TCA cycle genes in Ptenthyr−/− thyroids and in follicular carcinomas (FTC) arising in older mice. (E) DNA content-based assessment of mitochondria number in 3 month-old wild type and mutant mice (top panel). Expression levels of selected mitochondrial genes in the thyroids of wild type and mutant mice (bottom panel). Bars represent mean ± SD of triplicate measurements. Asterisks indicate significant (P<0.05) differences. (F) Mitochondrial damage (swelling, clarification, cristae disruption) in Pten−/− glands detected by transmission electron microscopy. (G) Oxygen consumption rates (OCR) in control and mutant primary thyrocytes cells in response to 1 μg/ml Oligomycin, 1 μM Fluoro-carbonyl cyanide phenylhydrazone (FCCP) or 2 μM Antimycin A + 2 μM Rotenone. (H) Extracellular acidification rate (ECAR) in control and mutant primary thyrocytes cells. P= 0.004). (I) Mitochondrial membrane polarization was measured in primary thyrocytes by flow cytometry using TMRE. FCCP pretreatment of wt cells was used to determine the baseline.
To determine to what extent metabolic genes are transcriptionally deregulated upon PI3K activation, we interrogated our Affymetrix gene expression dataset (14) to extend the analysis to all the genes directly involved in the TCA cycle and glycolysis. Interestingly, while none of the glycolytic enzymes was transcriptionally deregulated in the mutant glands (with the exception of a modest increase in the Glucokinase mRNA levels), the expression of 22 out of 28 genes encoding enzymes associated with the TCA cycle was significantly repressed in Pten−/− thyroids (Figure 1C and data not shown). About 60% of these genes were still repressed in the metastatic follicular carcinomas developing in older Ptenthyr−/− mice (Figure 1D).
Furthermore, when we quantitated citrate and isocitrate in the thyroids of control and Ptenthyr−/− mice by GC/MS, we found significantly reduced levels of these metabolites in the mutant glands (citrate: 2,577±525 pmol/mg in the wt and 985±302 in the mutants, isocitrate 217±42 pmol/mg in the wt and 80±26 in the mutants).
The tight connection existing between TCA cycle, oxidative phosphorylation (OXPHOS), and mitochondrial fitness prompted us to test whether this global down-regulation of TCA cycle genes is accompanied by alterations of the expression of mitochondria-encoded OXPHOS genes, as well as by changes in the number of mitochondria. We first used real time PCR to measure the relative mitochondrial genome copy number by amplifying four different mitochondrially encoded genes and one reference nuclear gene from total (genomic and mitochondrial) DNA isolated from wild type and mutant thyroids. No significant differences were found between control and mutants, suggesting that constitutive PI3K activation does not alter mitochondrial mass in the mouse thyroid (Figure 1E). Conversely, the expression of most mitochondria-encoded genes was heavily down-regulated in Pten−/− thyroids (Figure 1E). Furthermore, electron microscopy analysis of control and mutant thyroid sections showed that Pten loss caused profound morphological defects in the mitochondria, including swelling, matrix clarification, and disruption of the cristae (Figure 1F). All these features are commonly associated with reduced mitochondrial oxidative capacity (18).
To test whether the aforementioned findings reflect an impairment in mitochondrial function, we measured oxygen consumption rates (OCR) as well as extracellular acidification rate (ECAR) in primary cultures of control and Pten−/− thyrocytes. Strikingly, Pten−/− thyrocytes exhibited significantly reduced spare respiratory capacity, i.e. lower maximal rate of respiration (Figure 1G) and increased ECAR (Figure 1H). Finally, we used flow cytometry to compare the mitochondrial membrane potential in primary cultures of control and Pten−/− thyrocytes using the cationic potential-sensitive dye, tetramethylrhodamine-ethyl-ester (TMRE), which accumulates in intact mitochondria. The main population of mutant cells displayed reduced mitochondrial membrane potential compared to control thyrocytes (about 50% of wild type levels, note the logarithmic scale, Figure 1I), while a second population of mutant cells was characterized by even lower potential, similar to that of cells treated with the uncoupler FCCP.
Taken together, these data demonstrate that constitutive PI3K activation in the mouse thyroid results in the coordinated down-regulation of the expression of genes encoding members of both the TCA cycle and OXPHOS pathways, in extensive mitochondrial damage, and in severe impairment of mitochondrial function.
A glycolytic switch in pre-neoplastic Pten−/− thyrocytes
Since the expression changes described above result in reduced efficiency of the TCA cycle/OXPHOS metabolic pathway, the mutant cells might have to increase their glycolytic rate to meet their energetic needs.
As a proxy for the thyrocytes’ glycolytic rate, we assessed the amount of lactate present in thyroids from 3-month old wild type and mutant mice. Strikingly, Pten−/− thyroids displayed a three-fold increase in normalized lactate content, suggesting a higher metabolic flux through glycolysis (Figure 2A). Along the same line, we measured the lactate secretion rate in primary thyrocyte cultures. Mutant cells produced 3- to 5-fold more lactate than their wild type counterparts (Figure 2B), strongly indicating that glycolysis is indeed up-regulated to compensate the PI3K-mediated repression of the TCA cycle/OXPHOS pathway. Finally, to validate this hypothesis, we performed 18FDG-PET imaging on control and Ptenthyr−/− mice, and found that the hyperplastic Pten−/− thyroids showed strong 18FDG uptake, while no uptake was detected in wild type mice (Figure 2C).
Figure 2. Enhanced glycolysis in Pten−/− thyroids.

(A) Lactate levels in the thyroids of 3 month-old wild type and mutant mice. Bars represent mean ± SD (n=4 per pool). (B) Lactate production rate in primary cultures of wild type and mutant thyrocytes. (C) 18FDG microPET analysis showing increased glucose uptake in 3 month-old mutant mice compared to wild type controls. The inset shows a transverse section centered on the thyroid. (D) Expression levels of the indicated genes in wild type and mutant thyroids. Bars represent mean ± SD of triplicate experiments. (E) Western blot showing no deregulation of Hif1α and PKM2 in mutant glands. Asterisks indicate significant (P<0.05) differences.
These data show that, in response to constitutive PI3K activation, thyroid epithelial cells undergo a glycolytic switch, which is functionally reminiscent of the Warburg effect observed in cancer cells, as well as in highly proliferating cells such as activated lymphocytes.
The Warburg effect is usually driven by a set of “master genes”, including c-MYC, AKT, mTOR, and HIF1α, which control the expression, localization and function of both glucose transporters and glycolytic enzymes (5, 19). Up-regulation of Hexokinase 2, Pyruvate kinase M2, and Lactate dehydrogenases A and B are hallmarks of this glycolytic switch.
The establishment of a glycolytic switch in slowly proliferating, non-neoplastic (i.e. non-transformed) cells, and the absence of glycolytic genes up-regulation in our expression profiling data would argue against a mechanism involving the classical Warburg effect-related master regulators. In fact, we did not detect significant alterations in the expression levels of Hif1α, c-Myc, Hk2, Pkm2, Ldha, or Ldhb both at the RNA and protein level (Figure 2D, E and data not shown).
These data suggest that PI3K activation in non-transformed thyroid epithelial cells induces a glycolytic switch through a novel molecular mechanism.
Pdk1 drives TCA cycle/OXPHOS gene repression downstream of PI3K, independent of mTOR
Pdk1 is an essential member of the PI3K cascade, since it phosphorylates Akt on T308 and S6k1 on T229, allowing their full activation (20). To test to what extent the TCA cycle gene repression observed in Pten−/− thyroids depends on the Pdk1/Akt/mTOR cascade, we first crossed Ptenthyr−/− mice to Pdk1 conditional mutants (21), obtaining simultaneous thyroid-specific deletion of these two genes. Combined loss of Pten and Pdk1 rescued both the repression of the TCA cycle genes (Figure 3A) and that of mitochondrially-encoded OXPHOS genes (Figure 3B). Interestingly, mtDNA-encoded gene expression in the compound mutants was higher than in wild type controls. Furthermore, simultaneous inactivation of Pten and Pdk1 restored lactate production in the thyroid to wildtype levels (Figure 3C).
Figure 3. TCA cycle/OXPHOS gene repression depends on Pdk1 but not mTOR.

(A, B) Loss of Pdk1 restores normal levels of TCA cycle (A) and mitochondrial (B) gene expression in Ptenthyr−/− mice. Bars represent mean ± SD of triplicate assays. (C) Loss of Pdk1 restores normal levels of lactate in Ptenthyr−/− thyroid glands. Bars represent mean ± SD (n=4 per genotype). (D) Scheme of RAD001 administration to 3-month old mice and western blot verification of effective inhibition of mTOR activity. (E) mTOR inhibition suppresses thyrocyte proliferation. Bars represent mean ± SD (n=5 per genotype). (F, G) mTOR inhibition fails to restore normal TCA cycle (F) and mitochondrial (G) gene expression. Bars represent mean ± SD of triplicate assays. (H) mTOR inhibition fails to rescue lactate increase in mutant mice. Bars represent mean ± SD (n=4 per genotype). Asterisks indicate significant (P<0.05) differences.
Constitutive PI3K activation in the thyroid follicular cells results in mTOR activation (22), and mTOR activity has been proposed to play a key role in establishing the glycolytic switch (23). To test the role of the PI3K/Akt/mTOR axis in the metabolic phenotype of Ptenthyr−/− mice, we treated 3-month old wild type and mutant mice (n=5/group) daily for 2 weeks with the mTOR inhibitor RAD001 or placebo (Figure 3D). As previously shown by our group, this treatment is sufficient to inhibit mTOR activity and drastically reduce proliferation in mutant thyroids (22) (Fig, 3D, E). Strikingly, despite the clear inhibition of the thyrocytes’ proliferation rate, RAD001 treatment had no effect on the repression of TCA cycle genes (Figure 3F), on the repression of mitochondrial genes (Figure 3G), or on thyroid lactate production (Figure 3H).
These data strongly suggest that PI3K activation in thyroid cells induces a glycolytic switch independent of mTOR activity. Furthermore, they show that the increase in glycolysis in Ptenthyr−/− mice is not a direct consequence of the increased proliferative rate observed in the hyperplastic glands.
PI3K/AKT inhibit AMPK, leading to decreased OXPHOS metabolism in pre-neoplastic thyrocytes
The expression of nucleus- and mitochondria-encoded respiratory proteins is controlled by a number of nucleus-encoded transcription factors and co-activators that modulate mitochondrial function in response to extra- and intracellular signals.
In order to identify the mechanism through which loss of Pten results in a coordinated reprogramming of the expression of respiratory genes, we initially measured in thyroids from 3 month-old wild type and Ptenthyr−/− mice the expression levels of the transcription factors and cofactors involved in the regulation of TCA cycle/OXPHOS. While the expression levels of ERRβ, PRC, NRF-1 and -2, and TFAM were not altered by constitutive PI3K activation, Ptenthyr−/− thyroids had significantly lower expression of ERRγ, PGC-1α and –β, and, to a lesser extent, ERRα (Figure 4A). These data suggest that PI3K activation might alter the expression or activity of a common master regulatory gene.
Figure 4. AMPK is repressed in Ptenthyr−/− thyroids.
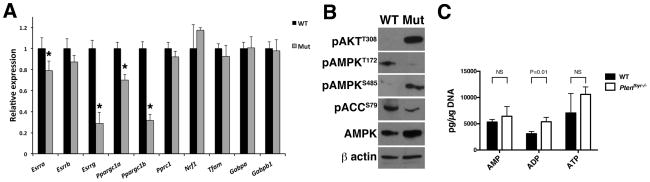
(A) qPCR profiling of metabolic transcriptional regulators in the thyroids of control and mutant mice. Bars represent mean ± SD of triplicate assays. Asterisks indicate significant (P<0.05) differences. (B) Western blotting analysis of AMPK activation in wild type and mutant glands. (C) AMP, ADP, and ATP levels in thyroids from wild type and Ptenthyr−/− mice. Bars represent mean ± SD (n=3 pools of 10 thyroids per genotype).
Recently published data have directed our attention on AMPK as a candidate for this role. AMPK contributes to the control of respiratory genes in muscle cells (24) and phosphorylates PGC-1α on T177 and S538 to increase its transcriptional activity, including its ability to transactivate its own promoter (25). In addition, the ESRRA promoter contains a PGC-1α/ERRα-responsive regulatory element that can also be recognized and activated by ERRβ and ERRγ (26). Furthermore, in certain cell types, AKT can phosphorylate AMPK on S485, preventing LKB1 from phosphorylating (on T172) and activating AMPK (27, 28). Indeed, we found that thyroids from Ptenthyr−/− mice have drastically reduced pT172- and higher pS485-AMPK, compared to wild type controls, and reduced levels of phosphorylated ACC (Figure 4B). Since it is theoretically possible that the reduced levels of pT172-AMPK in the mutant glands might be due to a low AMP/ATP ratio, we measured AMP, ADP, and ATP levels in extracts from wild type and mutant glands. AMP and ATP levels in mutant glands were comparable to wild type controls, while ADP levels were slightly higher on the mutant glands. These data indicate that PI3K inhibits AMPK despite AMP/ATP and ADP/ATP ratios that would stimulate AMPK activation, as in wild type glands (Figure 4C).
To test the hypothesis that PI3K activation represses TCA cycle/OXPHOS gene expression through the inhibition of AMPK, we treated wild type and Ptenthyr−/− mice with the AMPK activator AICAR for four weeks, and then isolated their thyroid glands. AICAR treatment increased pT172-AMPK levels not only in wild type mice, but also (and to the same levels) in Ptenthyr−/− mice, despite the persistent AKT activation and inhibitory AMPK phosphorylation on S485 (Figure 5A). Furthermore, AICAR-activated AMPK restored ACC phosphorylation on Ser79 (Figure 5D).
Figure 5. AICAR-mediated AMPK activation reverts the metabolic switch in Ptenthyr−/− thyroids.

(A) Top panel: Scheme of AICAR administration: 3 month-old mice were injected IP with AICAR (400 mg/kg/day) for 4 weeks. Bottom panel: Western blotting analysis of the effect of in vivo AICAR treatment on the phosphorylation of AMPK. (B, C) Expression levels of selected metabolic transcriptional regulators (B) and TCA cycle genes (C) upon in vivo AICAR treatment. Bars represent mean ± SD of triplicate assays. (D) Western blotting showing that in vivo AICAR treatment rescues TCA cycle enzymes expression. (E) Expression levels of mitochondrial genes in the thyroids of control and AICAR-treated mice. Bars represent mean ± SD of triplicate assays. (F) Transmission electron microscopy showing mitochondria structure in the thyroids of wild type, Pten−/− and AICAR-treated Pten−/− mice. (G) Effect of the in vivo AICAR treatment on lactate production. Bars represent mean ± SD (n=4 per genotype). (H) Thyroid weight in wild type, mutant, and AICAR treated mutant mice. (I) Proliferation index of thyroids from wild type, mutant, and AICAR treated mutant mice as measured by BrdU incorporation. Asterisks indicate significant (P<0.05) differences.
We next measured the expression of ERRα ERRγ, PGC-1α and PGC-1β in the thyroids of control, mutant, and AICAR-treated mutant mice. Strikingly, AICAR treatment increased the mRNA levels of all four transcription factors and co-factors to near-wild type levels (Figure 5B). To verify that the increase in transcriptional regulator levels translates in a restoration of normal TCA cycle/OXPHOS gene expression, we measured by qPCR and Western blotting the expression levels of selected TCA cycle genes, and found that AICAR treatment had completely rescued the PI3K-dependent repression of Aco2, Idh3a, and Pdhb (Figure 5C, D). However, when we tested the expression of the mitochondria-encoded OXPHOS genes, we could only detect a partial rescue upon AICAR treatment (Figure 5E). Furthermore, the extent of mitochondrial damage observed in Ptenthyr−/− thyrocytes was only mildly reduced by AICAR treatment (Figure 5F). Despite the persistence of some mitochondrial damage, enforced AMPK activation reversed the glycolytic switch induced by constitutive PI3K activation, as shown by the reduction of lactate content to wild type levels in AICAR-treated Ptenthyr−/− mice (Figure 5G).
These data strongly suggest that PI3K/AKT-mediated AMPK inhibition is responsible for the repression of oxidative metabolism gene expression observed in Ptenthyr−/− mice.
AMPK inhibition actively contributes to thyroid hyperplasia
To test whether the glycolytic switch observed in Ptenthyr−/− mice plays an active role in the hyperproliferative and pro-tumorigenic phenotype of mutant thyrocytes, we compared the weight and proliferative index of wild type, Ptenthyr−/−, and AICAR-treated mutant thyroid glands. During the four weeks of enforced AMPK reactivation, mutant glands grew at a much slower rate compared to untreated mutants, so that the weight of the mutant thyroids at the end of the treatment was significantly reduced compared to untreated Ptenthyr−/− mice (−34%, Figure 5H). This size reduction was associated with decreased proliferation: the thyrocyte proliferation index in AICAR-treated mice, determined by BrdU incorporation, was drastically reduced, compared to that of untreated mutant mice (−53%, Figure 5I). Thus, it is possible that that the glycolytic switch caused by PI3K-mediated AMPK inhibition actively contributes to the development of thyroid hyperplasia in Ptenthyr−/− mice.
The PI3K/AMPK mediated repression of oxidative metabolism is maintained in human thyroid cancer cells and involves AMPK-mediated phosphorylation of PGC-1α
Having established in a relevant in vivo system that sustained PI3K activation redirects energy metabolism towards glycolysis by repressing the expression of TCA cycle and OXPHOS genes in mouse thyrocytes, we sought to extend these studies to the human setting. We have initially used the PTEN−/− follicular thyroid cancer cell line, FTC-133: untreated, normally growing cells displayed almost undetectable pT172-AMPK, and strong pS485-AMPK. In keeping with the mouse data, AICAR treatment increased pT172-AMPK, as well as pS79-ACC (a direct AMPK target) in a dose-dependent manner (Figure 6A). Furthermore, enforced reactivation of AMPK led to significantly increased expression of the TCA cycle genes ACO2, IDH3A, and PDHB (Figure 6B).
Figure 6. The AKT/AMPK/PGC1α/TCA cycle axis is conserved in human thyroid cancer cells.

(A) Western blotting analysis of the effect of AICAR treatment on AMPK phosphorylation status in FTC-133 cells. (B) Expression analysis of representative TCA cycle genes in FTC-133 cells upon AICAR treatment. Bars represent mean ± SD of triplicate assays. (C) AICAR-induced increase in the expression levels of representative TCA cycle genes in FTC-133 cells transfected with wild type or mutant (AA) PGC1α. On the top, western blotting analysis showing comparable expression levels of transfected wild type and mutant (AA) PGC1α (specific band marked with an asterisk). (D) Western blotting analysis of the effect of H89, BKM120, and their combination on AMPK phosphorylation in FTC-133 cells. (E) Expression levels of representative metabolic transcriptional regulators and TCA cycle genes upon H89, BKM120, and their combination treatment in FTC-133 cells. Bars represent mean ± SD of triplicate assays. (F) Luciferase assay showing PGC1α promoter activity in FTC-133 cells after treatment with the indicated inhibitors. Bars represent mean ± SD (n=3 per treatment). (G) Western blotting analysis of the effect of AICAR treatment of THJ16T and 8505c cells on AMPK phosphorylation status. (H) Western blotting analysis of the effect of H89, BKM120 and their combination on AMPK phosphorylation status in THJ16T and 8505c cells. (I) Expression levels of the ESRRG and PPARGC1B metabolic transcriptional regulators upon H89, BKM120, and their combination treatment in THJ16T and 8505c cells. Bars represent mean ± SD of triplicate assays. Asterisks indicate significant (P<0.05) differences. (J) Proliferation of mouse and human thyroid cancer cells treated with 1mM AICAR and counted after 72h. Bars represent mean ± SD of triplicate assays.
As mentioned above, AMPK might control the expression and function of metabolic transcription factors and enzymes by modulating PGC-1α activity via phosphorylation on PGC-1α T177 and S538 (25). To test whether this pathway, discovered in skeletal muscle cells, is also active in thyrocytes, we transfected FTC-133 cells with an expression vector encoding wild type or phosphorylation defective PGC-1α (PGC-1α-AA), treated the cells with vehicle or AICAR to reverse the inhibition of AMPK, and extracted mRNA to measure the expression of a group of TCA cycle genes. AMPK reactivation increased the expression of ACO2, IDH3A, and PDHB in cells transfected with wild type PGC-1α but not, or to a much lower extent, in those transfected with the PGC-1α mutant that cannot be phosphorylated (Figure 6C). Thus, PGC-1α acts as a conduit for AMPK to control the expression of metabolic genes.
In order to test whether AMPK repression in human cells is directly associated with PI3K activation, we treated FTC-133 cells with the pan-PI3K inhibitor BKM120. Surprisingly, PI3K inhibition at a BKM concentration that has no off-target effects (1μM) was not sufficient to abolish S485 phosphorylation, or to induce T172 phosphorylation (Figure 6D). However, higher BKM120 concentrations could achieve these effects (data not shown) suggesting that other related kinases might contribute to S485 phosphorylation and AMPK inhibition.
PKA has been shown to phosphorylate S485-AMPK in the insulin-secreting cell line, INS-1 (29). Furthermore, in mouse adipocytes, PKA can phosphorylate AMPK on S173, inhibiting T172 phosphorylation, likely through steric hindrance (30). Thus, we tested whether PKA inhibition could synergize with PI3K inhibition to restore AMPK activity and respiratory gene expression. Strikingly, while FTC-133 treatment with the PKA inhibitor H89 alone did not result in alterations of the phosphorylation status of AMPK, simultaneous inhibition of PI3K and PKA abolished pS485-AMPK and drastically increased pT172-AMPK (Figure 6D). Accordingly, while single-inhibitor treatment of FTC-133 failed to increase the expression of TCA cycle genes, or PGC-1α and PGC-1β, combined treatment significantly increased their mRNA levels (Figure 6E). Combined inhibition of PI3K and PKA was also more effective than either kinase inhibition in increasing the expression of a luciferase reporter driven by the promoter region of PGC- 1α, further supporting the role of AMPK in the control of PGC-1α activity and expression (Figure 6F).
These data suggest that the PI3K/AKT axis controls AMPK activity also in PTEN−/− human thyroid cancer cells; however, in these cells, PKA contributes to the metabolic reprogramming through an overlapping pathway.
To test whether this signaling cascade is also active in human anaplastic thyroid cancer, we used two cell lines representative of the most common driver pathways in this aggressive and genetically complex tumor type: THJ16T, harboring an activating PIK3CA mutation (E545K), and 8505c, harboring the BRAF oncogenic allele V600E.
Both cell lines displayed low to undetectable pT172-AMPK, as well as strong pS485-AMPK, suggesting that AMPK inhibition is a common theme in thyroid cancer (Figure 6G). AICAR treatment restored T172 phosphorylation, more effectively in the cell line harboring the PI3K oncogenic mutation (Figure 6G).
When we treated these cells with PI3K and PKA inhibitors, alone and in combination, we found that simultaneous PI3K and PKA inhibition effectively re-activated AMPK and increased the expression of metabolic regulators such as ERRγ and PGC-1β in cells with constitutively active PI3K; however, they did not affect AMPK activation or ERRγ and PGC-1β expression in the BRAFV600E cell line (Figure 6H, I). Similar to the in vivo model, AMPK reactivation reduced proliferation of a panel of mouse and human thyroid cancer cell lines carrying PI3K activating mutations (Figure 6J).
Thus, in well-differentiated and undifferentiated human thyroid cancer cells, constitutive activation of PI3K, in cooperation with PKA, alters the expression of genes involved in respiratory metabolism by inhibiting AMPK.
TCA cycle gene repression in neoplastic lesions is also observed in other human tissues
To extend our findings to human tumors other than those arising in the thyroid, we interrogated the Oncomine™ database for datasets showing significant simultaneous down-regulation of both PTEN and TCA cycle genes. Although this approach does not account for other, more common, PI3K-activating mechanisms, it represents the only direct way to identify, within large expression datasets, tumors with activated PI3K signaling, in the absence of validated “PI3K activation” signatures.
Considering the inherent low power of our search, it is remarkable that we found a very strong association between PTEN loss and TCA cycle repression in two datasets, derived from dedifferentiated liposarcoma and from early stage colon cancer (Suppl. Figure 1). Thus, other human tumor types display global down-regulation of TCA cycle genes in association with PTEN loss and PI3K activation, warranting future studies to experimentally validate this association.
DISCUSSION
The existence of a tight link between PI3K signaling and rerouting of energy metabolism is well established in cancer cells, where activation of PI3K contributes to the switch from oxidative to glycolytic pathways through several of its downstream effectors, including AKT, mTOR, and HIF1α (31). In turn, these effectors increase the expression and/or activity of a variety of glycolytic enzymes, such as Hexokinase II (32), Phosphofructokinase 2 (33), the GLUT family of glucose transporters (34), Lactate dehydrogenases (35, 36), and the M2 isoform of Pyruvate kinase (23). Thus, in fully transformed cells, the Warburg effect is achieved through an increase in glycolytic flux, while mitochondrial metabolism is unaffected.
Little is known of the mechanism(s) regulating energy metabolism in normal and pre-neoplastic (i.e. carrying single mutations and not yet transformed) cells. There is a consensus that in normal cells the glycolytic switch is linked to high proliferation rates, as shown for embryonic tissues and activated lymphocytes (37). While an elegant study has recently established that activated lymphocytes rely mainly on MYC to transcriptionally reprogram their metabolism (38), much less is known when it comes to epithelial cells.
Our data, generated in a relevant in vivo model, support the hypothesis that, in response to PI3K activation, non-transformed thyroid epithelial cells increase metabolic flux through glycolysis, as indicated by the dramatic increase in lactate production observed in mutant cells; however this metabolic switch is independent of thyrocyte proliferation. Metabolic reprogramming of thyroid epithelial cells is achieved through a previously unknown mechanism, involving the coordinated down-regulation of the expression of TCA cycle and OXPHOS genes, and leading to dysfunctional mitochondria and reduced ability to perform respiratory metabolism. While we did not observe any significant increase in the expression of glycolytic genes (with the exception of Glk) upon Pten loss, we found a reproducible up-regulation of the Glut1 transporter. Accordingly, a strong connection between loss of PTEN expression and increased expression of GLUT1 has been recently reported in thyroid tumors discovered during unrelated 18FDG-PET scans (39).
Our data are in partial agreement with those recently reported by the Pandolfi group using a mouse model with enforced whole-body overexpression of Pten (40). MEFs from these mice display a metabolic shift towards OXPHOS, decreased lactate production, and increased expression of PGC-1α-target genes. However, in striking contrast with our model, cells overexpressing Pten have increased mitochondria number and up-regulate PKM2 through mTOR. While these differences might be linked to tissue-specificity of some of the controlling pathways, they might also be the consequence of overexpressing Pten, which completely abolishes PI3K signaling. Notably, the expression of OXPHOS genes in Pten, Pdk1thyr−/− mice (in which PI3K signaling is drastically repressed, like in the Pten transgenic strain) was higher than in wild type control, supporting the latter hypothesis.
From a mechanistic standpoint, our data support a model in which PI3K activation initiates the remodeling of energy metabolism through the phosphorylation of AMPK on S485 and its consequent inactivation. AMPK is a kinase known to play critical roles in growth, metabolism, autophagy, and cell polarity (41, 42). Its activation requires phosphorylation on T172 by LKB1 (41). Such phosphorylation can be inhibited by the AKT- and PKA-mediated phosphorylation of S485 (29, 43) and by PKA-mediated phosphorylation of S173 (30). A recent report has shown that also S6K1 can inhibit AMPK by phosphorylating S485 (44). However, the fact that RAD001 treatment of mutant mice does not rescue any of the metabolic phenotypes despite the complete ablation of S6K activity argues against a role for S6K1 in the phosphorylation of AMPK, at least in the thyroid. For the same reason, although mTOR was found to be central to the glycolytic switch in Tsc2−/− mouse kidney tumors and in Pten−/− MEFs (23), our in vivo data clearly show that mTOR activation is dispensable for the metabolic remodeling of the pre-neoplastic thyroid.
AMPK has been recently shown to suppress the Warburg effect in Myc-driven lymphomas, and its genetic inactivation induces a glycolytic shift in mouse embryonic fibroblasts (MEF) via normoxic stabilization of HIF-1α (45). Conversely, we do not detect changes in HIF-1α protein levels in the thyroids of Ptenthyr−/− mice, nor up-regulation of Ldha or Aldoa. More importantly, acute AMPK ablation did not affect OCR in both lymphomas and MEFs, suggesting the absence of any detrimental effects on the TCA cycle. These differences with our model might be related to the complete loss of AMPK vs. its decreased phosphorylation, or reflect tissue-specific wiring of the metabolic pathways.
ERRs and PGC-1 are major regulators of the expression of TCA cycle/OXPHOS genes, and their loss or overexpression have been shown to lead to repression or induction of these metabolic targets, respectively (24, 46, 47).
Inactivation of AMPK by AKT results in its inability to transactivate PGC-1α (25), which in turn leads to lower levels of ERRα (26). Less clear, instead, is how AMPK controls the expression of PGC-1β, which lacks the two residues phosphorylated by AMPK in PGC-1α, and that of ERRγ. While ERRγ down-regulation might be directly responsible for the reduced levels of PGC-1β (24), its link to PI3K and AMPK is still unclear. It has been recently reported that ERBB2 up-regulates (likely through PI3K) miR-378* expression in breast cancer cells (48). In turn, miR378* targets ERRγ, leading to down-regulation of TCA cycle genes, reduced respiration rate, and increased glycolysis. Future studies will evaluate whether PI3K activation in thyroid cells targets ERRγ through miR-378*, and whether AMPK plays a role in this pathway.
The fact that AICAR treatment rescued only partially the expression of mtDNA-encoded genes and the altered mitochondria morphology in Ptenthyr−/− mice might be a consequence of the extensive damage sustained by these organelles. Alternatively, additional PI3K-driven pathways might contribute to this aspect of the phenotype. An additional still open question is why PKA affects AMPK activity in thyroid cancer cell lines, but does not appear to do so in vivo, in mouse thyrocytes. Further work will be needed to clarify these issues.
One important aspect of our findings is that the metabolic remodeling appears to contribute directly to the hyperproliferative phenotype, since AICAR-mediated restoration of normal levels of TCA cycle enzymes and reduction of glycolytic rate in vivo drastically reduces thyrocyte proliferation. However, we cannot completely exclude that the reduced proliferation in AICAR-treated mice is also the consequence of an energy-deprived status due to persistent mitochondrial damage and dysfunction in conditions (i.e. AICAR treatment) that decrease the metabolic flux through glycolysis.
It is tempting to propose that the non-canonical glycolytic switch that takes place in pre-neoplastic PTEN−/− cells might contribute to the neoplastic transformation of thyroid, breast, and colon epithelial cells in Cowden Disease patients, carrying germline PTEN mutations. Similar to SDHB or SDHD mutation carriers, PTEN mutant Cowden Disease patients have recently been found to have elevated plasma succinate (49). The down-regulation of Succinate dehydrogenases expression observed in the thyroids of Pten mutant mice also results in increased succinate levels (Antico et al., manuscript in preparation). A similar pro-transforming contribution might also take place in endometrial epithelial cells in sporadic type I (endometrioid) endometrial cancer, where loss of PTEN is the earliest recognized genetic alteration (50).
Since the analysis of early hyperplastic lesions with PI3K activation in human tissues is not easily feasible, and relevant expression datasets are not publicly available, to extend our model to additional human tissues we used the Oncomine™ database, and found several datasets in which PTEN down-regulation coexists with global repression of TCA cycle genes. Interestingly, one of these datasets is derived from early stage colorectal cancer (51), supporting our hypothesis that these metabolic changes may take place well before full neoplastic transformation. Finally, a recent proteomic and metabolomic study of gastric cancer, a tumor type often associated with PI3K activation, found extensive repression of TCA cycle genes (52).
In conclusion, our characterization of an in vivo model of PI3K activation in thyroid epithelial cells has led to the discovery of a novel pathway, in which the glycolytic switch is not achieved through direct up-regulation of glycolytic enzyme expression and activity, but rather through the active inhibition of AMPK and the consequent repression of the expression of TCA cycle and OXPHOS genes, leading to impairment of mitochondrial metabolism.
Supplementary Material
Acknowledgments
This work was supported by the Albert Einstein Cancer Center Core Grant, and by NIH grants to ADC (CA128943 and CA167839). ADC is a recipient of the Irma T. Hirschl Career Scientist Award. ATP, ADP and AMP LC/MS assays were established in the Stable Isotope and Metabolomics Core of the Diabetes Research and Training Center (DRTC), supported by NIH grant P60DK020541.
References
- 1.Fritz V, Fajas L. Metabolism and proliferation share common regulatory pathways in cancer cells. Oncogene. 2010;29:4369–77. doi: 10.1038/onc.2010.182. [DOI] [PMC free article] [PubMed] [Google Scholar]
- 2.Warburg O. On the origin of cancer cells. Science. 1956;123:309–14. doi: 10.1126/science.123.3191.309. [DOI] [PubMed] [Google Scholar]
- 3.Ortega AD, Sanchez-Arago M, Giner-Sanchez D, Sanchez-Cenizo L, Willers I, Cuezva JM. Glucose avidity of carcinomas. Cancer letters. 2009;276:125–35. doi: 10.1016/j.canlet.2008.08.007. [DOI] [PubMed] [Google Scholar]
- 4.Elstrom RL, Bauer DE, Buzzai M, Karnauskas R, Harris MH, Plas DR, et al. Akt stimulates aerobic glycolysis in cancer cells. Cancer research. 2004;64:3892–9. doi: 10.1158/0008-5472.CAN-03-2904. [DOI] [PubMed] [Google Scholar]
- 5.Levine AJ, Puzio-Kuter AM. The control of the metabolic switch in cancers by oncogenes and tumor suppressor genes. Science. 2010;330:1340–4. doi: 10.1126/science.1193494. [DOI] [PubMed] [Google Scholar]
- 6.Duvel K, Yecies JL, Menon S, Raman P, Lipovsky AI, Souza AL, et al. Activation of a metabolic gene regulatory network downstream of mTOR complex 1. Molecular cell. 2010;39:171–83. doi: 10.1016/j.molcel.2010.06.022. [DOI] [PMC free article] [PubMed] [Google Scholar]
- 7.Qing G, Skuli N, Mayes PA, Pawel B, Martinez D, Maris JM, et al. Combinatorial regulation of neuroblastoma tumor progression by N-Myc and hypoxia inducible factor HIF-1alpha. Cancer research. 2010;70:10351–61. doi: 10.1158/0008-5472.CAN-10-0740. [DOI] [PMC free article] [PubMed] [Google Scholar]
- 8.Koppenol WH, Bounds PL, Dang CV. Otto Warburg’s contributions to current concepts of cancer metabolism. Nature reviews Cancer. 2011;11:325–37. doi: 10.1038/nrc3038. [DOI] [PubMed] [Google Scholar]
- 9.Israel M, Schwartz L. The metabolic advantage of tumor cells. Molecular cancer. 2011;10:70. doi: 10.1186/1476-4598-10-70. [DOI] [PMC free article] [PubMed] [Google Scholar]
- 10.Raimundo N, Baysal BE, Shadel GS. Revisiting the TCA cycle: signaling to tumor formation. Trends in molecular medicine. 2011;17:641–9. doi: 10.1016/j.molmed.2011.06.001. [DOI] [PMC free article] [PubMed] [Google Scholar]
- 11.Yeager N, Klein-Szanto A, Kimura S, Di Cristofano A. Pten loss in the mouse thyroid causes goiter and follicular adenomas: insights into thyroid function and Cowden disease pathogenesis. Cancer Res. 2007;67:959–66. doi: 10.1158/0008-5472.CAN-06-3524. [DOI] [PubMed] [Google Scholar]
- 12.Antico-Arciuch VG, Dima M, Liao XH, Refetoff S, Di Cristofano A. Cross-talk between PI3K and estrogen in the mouse thyroid predisposes to the development of follicular carcinomas with a higher incidence in females. Oncogene. 2010;29:5678–86. doi: 10.1038/onc.2010.308. [DOI] [PMC free article] [PubMed] [Google Scholar]
- 13.Miller KA, Yeager N, Baker K, Liao XH, Refetoff S, Di Cristofano A. Oncogenic Kras requires simultaneous PI3K signaling to induce ERK activation and transform thyroid epithelial cells in vivo. Cancer Res. 2009;69:3689–94. doi: 10.1158/0008-5472.CAN-09-0024. [DOI] [PMC free article] [PubMed] [Google Scholar]
- 14.Antico Arciuch VG, Russo M, Dima M, Kang KS, Dasrath F, Liao XH, et al. Thyrocyte-specific inactivation of p53 and Pten results in anaplastic thyroid carcinomas faithfully recapitulating human tumors. Oncotarget. 2011:2. doi: 10.18632/oncotarget.380. [DOI] [PMC free article] [PubMed] [Google Scholar]
- 15.Lawlor MA, Mora A, Ashby PR, Williams MR, Murray-Tait V, Malone L, et al. Essential role of PDK1 in regulating cell size and development in mice. Embo J. 2002;21:3728–38. doi: 10.1093/emboj/cdf387. [DOI] [PMC free article] [PubMed] [Google Scholar]
- 16.Patel BB, Li XM, Dixon MP, Blagoi EL, Seeholzer SH, Chen Y, et al. Searchable High-Resolution 2D Gel Proteome of the Human Colon Crypt. J Proteome Res. 2007 doi: 10.1021/pr060641e. [DOI] [PubMed] [Google Scholar]
- 17.Ke E, Patel BB, Liu T, Li XM, Haluszka O, Hoffman JP, et al. Proteomic analyses of pancreatic cyst fluids. Pancreas. 2009;38:e33–42. doi: 10.1097/MPA.0b013e318193a08f. [DOI] [PMC free article] [PubMed] [Google Scholar]
- 18.Bonnard C, Durand A, Peyrol S, Chanseaume E, Chauvin MA, Morio B, et al. Mitochondrial dysfunction results from oxidative stress in the skeletal muscle of diet-induced insulin-resistant mice. J Clin Invest. 2008;118:789–800. doi: 10.1172/JCI32601. [DOI] [PMC free article] [PubMed] [Google Scholar]
- 19.Cairns RA, Harris IS, Mak TW. Regulation of cancer cell metabolism. Nature reviews. 2011;11:85–95. doi: 10.1038/nrc2981. [DOI] [PubMed] [Google Scholar]
- 20.Pearce LR, Komander D, Alessi DR. The nuts and bolts of AGC protein kinases. Nat Rev Mol Cell Biol. 2010;11:9–22. doi: 10.1038/nrm2822. [DOI] [PubMed] [Google Scholar]
- 21.Bayascas JR, Sakamoto K, Armit L, Arthur JS, Alessi DR. Evaluation of approaches to generation of tissue-specific knock-in mice. J Biol Chem. 2006;281:28772–81. doi: 10.1074/jbc.M606789200. [DOI] [PubMed] [Google Scholar]
- 22.Yeager N, Brewer C, Cai KQ, Xu XX, Di Cristofano A. Mammalian target of rapamycin is the key effector of phosphatidylinositol-3-OH-initiated proliferative signals in the thyroid follicular epithelium. Cancer Res. 2008;68:444–9. doi: 10.1158/0008-5472.CAN-07-3030. [DOI] [PubMed] [Google Scholar]
- 23.Sun Q, Chen X, Ma J, Peng H, Wang F, Zha X, et al. Mammalian target of rapamycin up-regulation of pyruvate kinase isoenzyme type M2 is critical for aerobic glycolysis and tumor growth. Proc Natl Acad Sci U S A. 2011;108:4129–34. doi: 10.1073/pnas.1014769108. [DOI] [PMC free article] [PubMed] [Google Scholar]
- 24.Narkar VA, Fan W, Downes M, Yu RT, Jonker JW, Alaynick WA, et al. Exercise and PGC-1alpha-independent synchronization of type I muscle metabolism and vasculature by ERRgamma. Cell Metab. 2011;13:283–93. doi: 10.1016/j.cmet.2011.01.019. [DOI] [PMC free article] [PubMed] [Google Scholar]
- 25.Jager S, Handschin C, St-Pierre J, Spiegelman BM. AMP-activated protein kinase (AMPK) action in skeletal muscle via direct phosphorylation of PGC-1alpha. Proc Natl Acad Sci U S A. 2007;104:12017–22. doi: 10.1073/pnas.0705070104. [DOI] [PMC free article] [PubMed] [Google Scholar]
- 26.Giguere V. Transcriptional control of energy homeostasis by the estrogen-related receptors. Endocr Rev. 2008;29:677–96. doi: 10.1210/er.2008-0017. [DOI] [PubMed] [Google Scholar]
- 27.Mankouri J, Tedbury PR, Gretton S, Hughes ME, Griffin SD, Dallas ML, et al. Enhanced hepatitis C virus genome replication and lipid accumulation mediated by inhibition of AMP-activated protein kinase. Proc Natl Acad Sci U S A. 2010;107:11549–54. doi: 10.1073/pnas.0912426107. [DOI] [PMC free article] [PubMed] [Google Scholar]
- 28.Horman S, Vertommen D, Heath R, Neumann D, Mouton V, Woods A, et al. Insulin antagonizes ischemia-induced Thr172 phosphorylation of AMP-activated protein kinase alpha-subunits in heart via hierarchical phosphorylation of Ser485/491. J Biol Chem. 2006;281:5335–40. doi: 10.1074/jbc.M506850200. [DOI] [PubMed] [Google Scholar]
- 29.Hurley RL, Barre LK, Wood SD, Anderson KA, Kemp BE, Means AR, et al. Regulation of AMP-activated protein kinase by multisite phosphorylation in response to agents that elevate cellular cAMP. Journal of Biological Chemistry. 2006;281:36662–72. doi: 10.1074/jbc.M606676200. [DOI] [PubMed] [Google Scholar]
- 30.Djouder N, Tuerk RD, Suter M, Salvioni P, Thali RF, Scholz R, et al. PKA phosphorylates and inactivates AMPKalpha to promote efficient lipolysis. EMBO J. 2010;29:469–81. doi: 10.1038/emboj.2009.339. [DOI] [PMC free article] [PubMed] [Google Scholar]
- 31.Robey RB, Hay N. Is Akt the “Warburg kinase”?-Akt-energy metabolism interactions and oncogenesis. Semin Cancer Biol. 2009;19:25–31. doi: 10.1016/j.semcancer.2008.11.010. [DOI] [PMC free article] [PubMed] [Google Scholar]
- 32.Kim JW, Gao P, Liu YC, Semenza GL, Dang CV. Hypoxia-inducible factor 1 and dysregulated c-Myc cooperatively induce vascular endothelial growth factor and metabolic switches hexokinase 2 and pyruvate dehydrogenase kinase 1. Mol Cell Biol. 2007;27:7381–93. doi: 10.1128/MCB.00440-07. [DOI] [PMC free article] [PubMed] [Google Scholar]
- 33.Deprez J, Vertommen D, Alessi DR, Hue L, Rider MH. Phosphorylation and activation of heart 6-phosphofructo-2-kinase by protein kinase B and other protein kinases of the insulin signaling cascades. Journal of Biological Chemistry. 1997;272:17269–75. doi: 10.1074/jbc.272.28.17269. [DOI] [PubMed] [Google Scholar]
- 34.Barthel A, Okino ST, Liao J, Nakatani K, Li J, Whitlock JP, Jr, et al. Regulation of GLUT1 gene transcription by the serine/threonine kinase Akt1. J Biol Chem. 1999;274:20281–6. doi: 10.1074/jbc.274.29.20281. [DOI] [PubMed] [Google Scholar]
- 35.Zha X, Wang F, Wang Y, He S, Jing Y, Wu X, et al. Lactate dehydrogenase B is critical for hyperactive mTOR-mediated tumorigenesis. Cancer Res. 2011;71:13–8. doi: 10.1158/0008-5472.CAN-10-1668. [DOI] [PubMed] [Google Scholar]
- 36.Semenza GL, Jiang BH, Leung SW, Passantino R, Concordet JP, Maire P, et al. Hypoxia response elements in the aldolase A, enolase 1, and lactate dehydrogenase A gene promoters contain essential binding sites for hypoxia-inducible factor 1. J Biol Chem. 1996;271:32529–37. doi: 10.1074/jbc.271.51.32529. [DOI] [PubMed] [Google Scholar]
- 37.Lunt SY, Vander Heiden MG. Aerobic glycolysis: meeting the metabolic requirements of cell proliferation. Annual review of cell and developmental biology. 2011;27:441–64. doi: 10.1146/annurev-cellbio-092910-154237. [DOI] [PubMed] [Google Scholar]
- 38.Wang R, Dillon CP, Shi LZ, Milasta S, Carter R, Finkelstein D, et al. The transcription factor Myc controls metabolic reprogramming upon T lymphocyte activation. Immunity. 2011;35:871–82. doi: 10.1016/j.immuni.2011.09.021. [DOI] [PMC free article] [PubMed] [Google Scholar]
- 39.Morani F, Pagano L, Prodam F, Aimaretti G, Isidoro C. Loss of expression of the oncosuppressor PTEN in thyroid incidentalomas associates with GLUT1 plasmamembrane expression. Panminerva medica. 2012;54:59–63. [PubMed] [Google Scholar]
- 40.Garcia-Cao I, Song MS, Hobbs RM, Laurent G, Giorgi C, de Boer VC, et al. Systemic elevation of PTEN induces a tumor-suppressive metabolic state. Cell. 2012;149:49–62. doi: 10.1016/j.cell.2012.02.030. [DOI] [PMC free article] [PubMed] [Google Scholar]
- 41.Mihaylova MM, Shaw RJ. The AMPK signalling pathway coordinates cell growth, autophagy and metabolism. Nature cell biology. 2011;13:1016–23. doi: 10.1038/ncb2329. [DOI] [PMC free article] [PubMed] [Google Scholar]
- 42.Hardie DG, Ross FA, Hawley SA. AMPK: a nutrient and energy sensor that maintains energy homeostasis. Nature reviews Molecular cell biology. 2012;13:251–62. doi: 10.1038/nrm3311. [DOI] [PMC free article] [PubMed] [Google Scholar]
- 43.Ning J, Xi G, Clemmons DR. Suppression of AMPK activation via S485 phosphorylation by IGF-I during hyperglycemia is mediated by AKT activation in vascular smooth muscle cells. Endocrinology. 2011;152:3143–54. doi: 10.1210/en.2011-0155. [DOI] [PMC free article] [PubMed] [Google Scholar]
- 44.Dagon Y, Hur E, Zheng B, Wellenstein K, Cantley LC, Kahn BB. p70S6 kinase phosphorylates AMPK on serine 491 to mediate leptin’s effect on food intake. Cell Metab. 2012;16:104–12. doi: 10.1016/j.cmet.2012.05.010. [DOI] [PMC free article] [PubMed] [Google Scholar]
- 45.Faubert B, Boily G, Izreig S, Griss T, Samborska B, Dong Z, et al. AMPK is a negative regulator of the Warburg effect and suppresses tumor growth in vivo. Cell Metab. 2013;17:113–24. doi: 10.1016/j.cmet.2012.12.001. [DOI] [PMC free article] [PubMed] [Google Scholar]
- 46.Alaynick WA, Kondo RP, Xie W, He W, Dufour CR, Downes M, et al. ERRgamma directs and maintains the transition to oxidative metabolism in the postnatal heart. Cell Metab. 2007;6:13–24. doi: 10.1016/j.cmet.2007.06.007. [DOI] [PubMed] [Google Scholar]
- 47.Scarpulla RC. Metabolic control of mitochondrial biogenesis through the PGC-1 family regulatory network. Biochim Biophys Acta. 2011;1813:1269–78. doi: 10.1016/j.bbamcr.2010.09.019. [DOI] [PMC free article] [PubMed] [Google Scholar]
- 48.Eichner LJ, Perry MC, Dufour CR, Bertos N, Park M, St-Pierre J, et al. miR-378( *) mediates metabolic shift in breast cancer cells via the PGC-1beta/ERRgamma transcriptional pathway. Cell Metab. 2010;12:352–61. doi: 10.1016/j.cmet.2010.09.002. [DOI] [PubMed] [Google Scholar]
- 49.Hobert JA, Mester JL, Moline J, Eng C. Elevated plasma succinate in PTEN, SDHB, and SDHD mutation-positive individuals. Genetics in medicine : official journal of the American College of Medical Genetics. 2012 doi: 10.1038/gim.2011.63. [DOI] [PMC free article] [PubMed] [Google Scholar]
- 50.Mutter GL, Lin MC, Fitzgerald JT, Kum JB, Baak JP, Lees JA, et al. Altered PTEN expression as a diagnostic marker for the earliest endometrial precancers. J Natl Cancer Inst. 2000;92:924–30. doi: 10.1093/jnci/92.11.924. [DOI] [PubMed] [Google Scholar]
- 51.Hong Y, Downey T, Eu KW, Koh PK, Cheah PY. A ‘metastasis-prone’ signature for early-stage mismatch-repair proficient sporadic colorectal cancer patients and its implications for possible therapeutics. Clinical & experimental metastasis. 2010;27:83–90. doi: 10.1007/s10585-010-9305-4. [DOI] [PubMed] [Google Scholar]
- 52.Cai Z, Zhao JS, Li JJ, Peng DN, Wang XY, Chen TL, et al. A combined proteomics and metabolomics profiling of gastric cardia cancer reveals characteristic dysregulations in glucose metabolism. Molecular & cellular proteomics : MCP. 2010;9:2617–28. doi: 10.1074/mcp.M110.000661. [DOI] [PMC free article] [PubMed] [Google Scholar]
Associated Data
This section collects any data citations, data availability statements, or supplementary materials included in this article.