

Abstract
The pedunculopontine nucleus (PPN), the cholinergic arm of the reticular activating system, regulates waking and rapid eye movement (REM) sleep. Here, we demonstrate immunohistochemical labeling of the leptin receptor signaling isoform in PPN neurons, and investigated the effects of G-protein modulation and the leptin triple antagonist (TA) on the action of leptin in the PPN. Whole-cell patch clamp recordings were performed in rat brainstem slices from 9–17 day old pups. Previous results showed that leptin caused a partial blockade of sodium (INa) and h-current (IH) in PPN neurons. TA (100 nM) reduced the blockade of INa (~50% reduction) and IH (~93% reduction) caused by leptin. Intracellular GDPβ (a G-protein inhibitor) significantly reduced the effect of leptin on INa(~60% reduction) but not on IH (~25% reduction). Intracellular GTPγS (a G-protein activator) reduced the effect of leptin on both INa (~80% reduction) and IH (~90% reduction). These results suggest that the effects of leptin on the intrinsic properties of PPN neurons are leptin receptor- and G-protein-dependent. We also found that leptin enhanced NMDA receptor-mediated responses in single neurons and in the PPN population as a whole, an effect blocked by TA. These experiments further strengthen the association between leptin dysregulation and sleep disturbances.
Keywords: arousal, GDPβ, GTP γS, hyperpolarization-activated cation current, sodium current
Introduction
Arousal and rapid eye movement (REM) sleep are regulated by the cholinergic arm of the reticular activating system (RAS), the pedunculopontine nucleus (PPN)(Shouse and Siegel 1992, Steriade et al. 1990, Datta and Prutzman 2005, Garcia-Rill et al. 2008). Several studies have shown that short sleep duration is correlated with decreased leptin levels in both animal and human models (Aldabal and Bahammam 2011, Spiegel et al. 2005, Taheri et al. 2004). Leptin, a hormone that regulates appetite and energy expenditure, is increased in obese individuals, although these individuals often exhibit leptin resistance(Ahima and Flier 2000). Importantly, obesity is characterized by sleep/wake disturbances, such as excessive daytime sleepiness in the absence of sleep-disordered breathing, increased rapid eye movement (REM) sleep, increased nighttime arousals, increased total wake time, and decreased percentage of total sleep(Dixon et al. 2007, Vgontzas et al. 1998). We recently showed that leptin caused a partial blockade of Na+ channel conductance and h-current (IH) in PPN cells, leading to decreased activity in the PPN(Beck et al. 2013). In the present study, we demonstrate the presence of immunohistochemical labeling of the leptin receptor ObRb (the long, signaling receptor isoform) in PPN neurons. In addition, we investigated some of the intracellular mechanisms by which leptin may act on PPN neurons in brainstem slices from 9–17day-old rat pups using whole-cell patch clamp recordings, and whether these effects can be blocked by the super-active leptin triple antagonist [SLAN-4, referred to as triple antagonist (TA) (Shpilman M Fau - Niv-Spector et al. 2011)].
The goal of this project was to determine the nature of some of the intracellular mechanisms of leptin action in the PPN, and thus the possible link between leptin dysregulation and related sleep disorders. We hypothesize that leptin normally acts via the leptin receptor and, at least in part, via activation of G-protein-associated intracellular pathways to reduce PPN neuronal activity (by down regulating INa and IH) resulting in an overall inhibition of the PPN, therefore reducing waking and REM sleep. We examined the effect of G-protein modulation on the actions of leptin using guanosine 5′-[β-thio]diphosphate trilithium salt(GDPβ), and G-protein inhibitor, and guanosine 5′-[γ-thio]triphosphate tetralithium salt(GTPγS), a G-protein activator. The effect of leptin on Na+ currents (INa) was blocked by intracellular GDPβ, but the effect of leptin on IH was not reduced by GDPβ. The effects of leptin on both IH and INa were reduced by intracellular GTPγS. We also found that the effect of leptin on both INa and IH was blocked by the leptin TA. That is, the effects of leptin on the intrinsic properties of neurons in the PPN are leptin receptor-mediated and G-protein-dependent.
Moreover, we found that leptin enhanced NMDA-induced population responses in the PPN. We also found that leptin increased the frequency (but not amplitude) of miniature excitatory postsynaptic currents (mEPSCs), suggesting this hormone also has presynaptic effects. The increase in mEPSC frequency caused by leptin was blocked by pretreatment of the leptin TA. We speculate that leptin normally decreases activity in the PPN via G-protein-mediated mechanisms. In obesity, the effect of leptin is blunted due to leptin resistance, possibly leading to increased arousals and REM sleep drive. Our results provide a potential area of future research to determine if this intracellular mechanism is involved in the development of leptin resistance.
Methods
Immunohistochemistry of leptin receptors in the PPN
Fresh brain tissue from anesthetized and decapitated rats was sliced on a vibratome (Leica VT1200S) in 100 μm sections and post-fixed in methanol for 10 min. Sections were washed 3 times for 5 min in 0.01M phosphate buffered saline pH 7.4 (PBS) followed by a blocking step of 1 hr with 5% BSA fraction V in PBS. Primary antibodies for the leptin receptor (Sigma Aldrich L-9536, goat polyclonal, working concentration of 5μg/mL in PBS), and bNOS (NOS1 (52) Santa Cruz sc-136006, mouse monoclonal, working concentration of 5ng/mL in PBS), which is known to selectively label PPN cholinergic neurons (Garcia-Rill et al. 2008), were co-incubated at 4°C for 72 hr. Sections were washed 3 times for 5 min with PBS and secondary antibodies were co-incubated for 2 hr at room temperature using 10 μg/mL Invitrogen A11055, Alexa Fluor 488 donkey anti-goat IgG (H+L) and10 μg/mL Invitrogen A21201, Alexa Fluor 594 chicken anti-mouse IgG (H+L)in PBS. Sections were washed 3 times for 5 min, mounted on gelatin coated glass slides and cover slipped with Fluoromount™ aqueous mounting medium (Sigma Aldrich F4680).
Slice preparation
Rat pups of both sexes aged 9–17 days from adult timed-pregnant Sprague-Dawley rats (280–350g, Harlan Laboratories, Indianapolis, IN, USA) were anesthetized with ketamine (70 mg/kg, I.M.) until the tail pinch reflex was absent. Pups were decapitated and the brain was rapidly removed and cooled in oxygenated sucrose-artificial cerebrospinal fluid (sucrose-aCSF). The sucrose-aCSF consisted of (in mM): 233.7 sucrose, 26 NaHCO3, 3 KCl, 8 MgCl2, 0.5 CaCl2, 20 glucose, 0.4 ascorbic acid, and 2 sodium pyruvate. Sagittal sections (400 μm) containing the PPN were cut and slices were allowed to equilibrate in normal aCSF at room temperature for 1 hr. The aCSF was composed of (in mM): 117 NaCl, 4.7 KCl, 1.2 MgCl2, 2.5 CaCl2, 1.2 NaH2PO4, 24.9 NaHCO3 and 11.5 glucose. Slices were recorded at 37°C while perfused (1.5 ml/min) with oxygenated (95% O2- 5% CO2) aCSF in an immersion chamber for patch clamp studies. All experimental protocols were approved by the Institutional Animal Care and Use Committee of the University of Arkansas for Medical Sciences, and were in agreement with the National Institutes of Health guidelines for the care and use of laboratory animals.
Whole-cell patch clamp recordings
To assess the effect of leptin on PPN neuronal intrinsic membrane properties, we used the whole-cell patch clamp method in an environment that mimics the natural milieu of these cells. Sodium currents and h-currents were examined to investigate the firing properties of PPN neurons before and after leptin treatment. Glutamate-induced miniature excitatory postsynaptic currents (mEPSCs) were examined to investigate the effect of leptin on the spontaneous release of glutamate. Differential interference contrast optics was used to visualize neurons using an upright microscope (Nikon FN-1, Nikon, USA). Whole-cell recordings were performed using borosilicate glass capillaries pulled on a P-97 puller (Sutter Instrument Company, Novato, CA). Glass pipettes were filled with a high-K+ intracellular solution, designed to mimic the intracellular electrolyte concentration, which consisted of (in mM): 124 K-gluconate, 10 HEPES, 10 phosphocreatine di tris, 0.2 EGTA, 4 Mg2ATP, 0.3 Na2GTP, in order to test intrinsic membrane properties, In some experiments, the pipettes were filled with a high cesium ion (Cs+) intracellular solution designed to block potassium channels from the intracellular side (to study INa) and consisted of (in mM): 120 CsMeSO3, 20 HEPES, 1 EGTA, 10 TEA-Cl, 4 Mg-ATP, 0.4 mM GTP, 10 Phosphocreatine, 2 MgCl2. The osmolarity of the intracellular solution was adjusted to ~270–290 mOsm and pH to 7.3. Pipettes with a resistance of 2–5 MΩ when filled were used to form of a tight seal (>1 GΩ) in voltage-clamp configuration mode. The membrane potential was held at −60 mV (i.e. near the average resting membrane potential of PPN neurons). For the mEPSC experiments, the membrane potential was held at −70 mV to prevent the occurrence of action potentials. Whole-cell access was accomplished by rupturing the membrane. Capacitance (Cm) transients were cancelled using computer-controlled circuitry. Fast compensation was used to maintain the series resistance values below12 MΩ, and were compensated 30–40% (i.e., final series resistance values were ≤ 8–9 MΩ in all experiments).
Resting membrane potential (RMP) values were not significantly affected by leptin exposure (n=40, Paired sample t-test, p ≥ 0.05). The RMP values before leptin were −61.5 ± 0.9 mV, and −60.9±1.0 mV after leptin.
In current-clamp configuration, IH current-mediated membrane potential changes (in mV) were obtained using a voltage-current (V-I) curve protocol. Slices were bathed in aCSF extracellular solution containing the synaptic receptor antagonists gabazine (GBZ, a GABAA receptor antagonist, 10 μM), strychnine (STR, a glycine receptor antagonist, 10 μM), 6-cyano-7-nitroquinoxaline-2,3-dione (CNQX, an AMPA/kainate glutamate receptor antagonist, 10 μM), and 2-amino-5-phosphonovaleric acid (APV, a NMDA receptor antagonist, 20 μM).
IH-current-mediated membrane potential (Vm) deflections were measured in current-clamp using 500 msec hyperpolarizing steps of −180 pA. Direct IH amplitudes in voltage-clamp were measured using 500 msec hyperpolarizing square steps of −50 mV.
Standard sodium (INa) current–voltage (I–V) curves were obtained using the high cesium chloride pipette solution. Slices were bathed in extracellular aCSF solution containing synaptic blockers, tetraethyl ammonium chloride (TEA-Cl 20 mM; to block potassium channels), cadmium chloride (CdCl2 0.2 mM) and nickel chloride (NiCl2 0.2 mM; (to block calcium channels). A low concentration of tetrodotoxin (TTX 3–10 nM) was used to partially block INa in order to allow better clamping control of sodium currents. The membrane potential of each cell was held at −60 mV. A series of 5 msec depolarizing test pulses to voltages that ranged from −55 mV to +65 mV in 5 mV increments were used to obtain I-V and associated conductance-mediated activation curves. All recordings were made using a Multiclamp 700B amplifier (Molecular Devices, Sunnyvale, CA) in both current and voltage clamp mode. Analog signals were low-pass filtered at 2 kHz, and digitized at 5 kHz using a Digidata-1440A interface and pClamp10.3 software (Molecular Devices). No significant rundown due to intracellular dialysis of recorded neuronal activity was observed during the recording period for all three types of PPN neurons (up to 40 min). The same methods were employed in a previous study of leptin action on INa and IH (Beck et al. 2013).
Population Response Recordings
For population recording studies, slices containing the PPN were placed in a BSC-1 interface chamber (Automate Science, Berkeley, CA). The slices were visualized with a Wild dissection microscope, and local field potentials were recorded using glass microelectrodes. Local field potentials represent the firing activity of neuronal groups around the electrode, providing information on the response of the PPN population as a whole, before and after drug treatment. Recordings were made with borosilicate glass capillaries pulled to a 1–2 μm tip with 1–2 MΩ resistance and filled with aCSF. Recordings were amplified with a Grass Instrument (Quincy, MA) P511 amplifier, filtered at 1 Hz to 1 kHz, digitized with a Digidata-1332A at a rate of 10 kHz, stored on computer hard drive, and averages and power spectra were analyzed using pClamp10 software.
Drug application
Bath-applied drugs were administered to the slice via a peristaltic pump (Cole-Parmer, Vernon Hills, IL), and a three-way valve system such that solutions reached the slice 1.5 min after the start of application. Perfusion time shown throughout the article considers such a time difference. The synaptic blockers described above were purchased from Sigma (St. Louis, MO, USA). Potassium and calcium channel blockers were purchased from either Peptide International (Pepnet.com, KY, USA) or Alomone labs (Alomone.com, Israel). The direct effects of leptin on single cell intrinsic membrane propertieswere studied using a high-potassium pipette solution and aCSF extracellular solution containing synaptic receptor antagonists GBZ, STR, CNQX, and APV. Guanosine 5′-[β-thio]diphosphate trilithium salt(referred to in the text and figures as GDPβ, 500 μM), or Guanosine 5′-[γ-thio]triphosphate tetralithium salt (referred to in the text and figures as GTPγS, 400 μM) were added to the intracellular solution for the G-protein experiments and were purchased from Sigma (St. Louis, MO, USA). For the mEPSC studies, GBZ and STR were used to prevent the occurrence of inhibitory postsynaptic currents. Leptin (rat recombinant) was purchased from Sigma (St. Louis, MO, USA). Leptin was dissolved in 20 mM Tris (pH 8) solution. All experiments were conducted with 100 nM leptin. Previous studies had determined a dose-response curve for leptin on PPN neurons (Beck et al. 2013).
Data Analysis
Off-line analyses were performed using Clampfit software (Molecular Devices, Sunnyvale, CA). Differences were considered significant at values of p ≤ 0.05. All results are presented as mean ± S.E.M. For single cell (IH and INa currents) recordings, OriginLab (OriginLab Corporation, Northamptom, MA, USA) was used for statistical comparisons using analysis of variance (ANOVA), with either Bonferroni or Dunn’s post hoc testing for multiple comparisons. For mEPSC studies, the amplitude and inter-event intervals were measured using Mini Analysis software (Synaptosoft, Decatur, GA, USA).
For the population studies, power spectra were obtained and consisted of 20 sec windows every 1 min prior to drug application, during the peak effect, and after the agent had washed. These analyses generated power spectra for a particular point in time, e.g., at the peak of a response. Essentially, amplitudes of power spectra for each group of 4slices were tabulated at 5–55 Hz, and a mean of the amplitudes at each frequency was calculated for each group of slices; e.g., control, neuroactive agent, wash. Statistical comparisons were carried out using a two-way ANOVA, with either Bonferroni or Dunn’s post hoc testing for multiple comparisons. Treatment x frequency range comparison was used to compare power spectra values. Plots of the event related spectral perturbation (ERSP) for each population response were generated with MatLab software (The MathWorks, Natick, MA(Delorme and Makeig 2004). These analyses generated power spectra for continuous points in time, e.g., during and after application of an agent or washout. These graphs plot frequency of activity over time, and the amplitude of the frequency shown are color-coded such that background (control) appears light green, and higher amplitudes appear progressively more yellow, then red. The various peaks in the power spectrum at a single time point are represented as more intense colors at only one time point in the ERSP plot, and can be thought of as a running power spectrum over time.
Results
Immunohistochemistry of leptin receptors in the PPN
Figure 1 shows a fluorescence photomicrograph of a section through the PPN after processing for bNOS and leptin receptor immunohistochemical labeling. bNOS labeling was evident in PPN cells, specifically cholinergic neurons, as solid red cytoplasm (rhodamine filter). Leptin receptor labeling was evident as punctiform green label (FITC filter). This merged view shows that all PPN cholinergic cells manifested both bNOS and leptin receptor labeling, while non-cholinergic cells showed only leptin receptor labeling evident as green punctiform label without bNOS labeling. This suggests that all cholinergic cells in the PPN bear leptin receptors, and that many non-cholinergic cells also bear leptin receptors.
Figure 1. Immunohistochemical labeling.
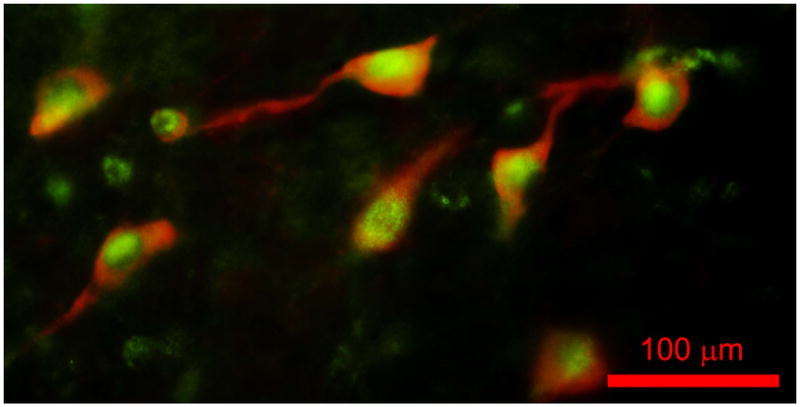
Merged view of a fluorescence photomicrograph for both bNOS and leptin receptor immunohistochemical labeling of a section through the PPN of the rat. bNOS labeled cholinergic PPN cells as solid red cytoplasm (rhodamine filter). Leptin receptor labeling was evident as punctiform green label (FITC filter). This suggests that all or most cholinergic cells in the PPN bear leptin receptors, and that many non-cholinergic cells also bear leptin receptors. Calibration bar: 100 μm.
Single-cell recordings
Whole-cell patch clamp recordings of single PPN neurons were conducted to determine whether pretreatment with extracellular TA would affect the action of leptin on PPN cells (i.e. the established effect of leptin’s partial blockade of both INa and IH). We also examined whether the addition of either GDPβ or GTPγS in the intracellular pipette solution would affect the action of leptin on PPN cells. Finally, we examined the effect of leptin on NMDA- and AMPA-induced mEPSCs. A total of 80 PPN neurons were studied.
Leptin caused a partial INa blockade of 60±5 % and a partial IH blockade of 44±7 % in PPN neurons, confirming previous results (Beck et al. 2013). We examined the effect of pretreatment with the TA (100 nM) on this blockade by leptin. The percentage of INa block by leptin following pretreatment with TA was 33±4 % (n=6, Student’s t-test, t= 4.5, df=10, p < 0.001, compared to leptin alone 60±5 %). The percentage of IH block by leptin following pretreatment with TA was 3±10 % (n=10, Student’s t-test, t= 3.589, df= 17, p= 0.002, compared to leptin alone 44±7 %). Therefore, pretreatment with TA significantly reduced or eliminated the partial blockade of leptin on both INa and IH (Fig. 2A). This result suggests that the effects of leptin on INa and IH were leptin receptor-mediated.
Figure 2. Intracellular mechanisms of leptin action during single-cell recordings of PPN neuron.

A) Percentage of block of whole-cell patch clamp recorded sodium current (INa,left graph) and h-current (IH, right graph) by leptin alone (black columns) compared to leptin + triple antagonist (TA 100 nM, white columns). B) Percentage of sodium current block (left) and h-current block (right) by leptin alone (black columns) compared to leptin + intracellular GDPβ (white columns). C) Percentage of sodium current block (left) and h-current block (right) by leptin alone (black columns) compared to leptin + GTPγS (white columns). Vertical bars represent Mean ± S.E.M. Cell numbers shown in parentheses inside bars. All recordings were performed in the presence of gabazine (10 μM) and strychnine (10 μM).
Next, we examined the effect of intracellular GDPβ or GTPγS on the action of leptin in the PPN. The partial blockade of INa caused by leptin after the addition of intracellular GDPβ was 26±6 % (n=16, Student’s t-test, t= 3.53, df=21, p=0.002, compared to leptin alone 60±5 %). The partial blockade of IH caused by leptin after the addition of intracellular GDPβ was 33±12 % (n=10, Mann-Whitney Rank Sum non-parametric test, p=0.521, compared to leptin alone 44±7 %). The partial blockade of INa caused by leptin after the addition of intracellular GTPγS was 11±10 % (n=7, Student’s t-test, t=4.336, df=12, p<0.001, compared to leptin alone 60±5 %). The partial blockade of IH caused by leptin after the addition of intracellular GTPγS was 5±15 % (n= 6, Mann-Whitney Rank Sum non-parametric test, p=0.023, compared to leptin alone 44±7 %). Therefore, addition of intracellular GDPβ blocked the effect of leptin on INa but not IH (Fig. 2B); and the addition of intracellular GTPγS blocked the effect of leptin on both INa and IH (Fig. 2C). These results suggest that leptin’s effects on PPN cell INa and IH were G-protein-mediated.
Population response recordings
We studied the effects of leptin on the PPN population as a whole using an interface chamber to record the overall neuronal activity. Multiple pre-drug control recordings were carried out to establish a background level of activity (<10 μV). Twenty seconds of population activity was recorded at the beginning of every minute after the start of each drug application.
To test the effect of leptin on the NMDA response of the PPN population, we bath applied NMDA alone (10 μM), leptin alone (100 nM), NMDA+leptin, leptin+TA (50 nM), and NMDA +leptin +TA, and recorded the population activity (4 slices for leptin/NMDA experiments and 4 slices for TA/leptin/NMDA experiments). When comparing the NMDA response to the NMDA+leptin response or the TA+leptin+NMDA response, we chose the same minute of drug exposure for both. We first obtained multiple control baseline recordings, then bath applied NMDA, and then a washout with aCSF until the activity returned to baseline. Next, we applied leptin for 20 min, then applied leptin+NMDA. For the leptin antagonist experiments, after the washout, the TA+leptin were then applied for 20 min, and then TA+leptin+NMDA were applied.
We measured the peak power amplitude after each treatment and compared that data to the pre-drug/baseline condition within the following frequency ranges: 5–10 Hz (theta), 10–20 Hz (alpha), 20–30 Hz (beta), and 30–55Hz (gamma). Figure 3A shows the power spectrum amplitude change at each frequency range after NMDA (black columns), leptin 20 min (solid gray columns), and leptin+NMDA (hatched gray columns). Figure 3B shows the power spectrum amplitude change after leptin+TA (white columns), and after NMDA+leptin+TA (solid gray columns). Table 1 shows the mean power spectrum change across treatments for each frequency range, represented as Mean ±S.E.M. (n=4 for all treatments). Two-way ANOVA (treatment x frequency range) showed significant differences for both dependent measures: F(4,79) = 52.3, p<0.001. Bonferroni post-hoc test showed significant differences across all treatments and frequencies, as shown in Table 2. These results suggest that leptin potentiated the effects of NMDA on PPN population responses, effects blocked by the TA.
Figure 3. Effects of leptin on PPN population response recordings.

A) Power spectrum amplitude change (after/before treatment ratio) within frequency ranges 5–10 Hz, 10–20 Hz, 20–30 Hz, and 30–55 Hz compared to baseline population activity after NMDA (10 μM, black bars), after leptin (100 nM, solid gray bars), and after NMDA+leptin (gridded gray bars). B) Power spectrum amplitude change within frequency ranges 5–10 Hz, 10–20 Hz, 20–30 Hz, and 30–55 Hz compared to baseline population activity after triple antagonist (50 nM) + leptin (white bars), and triple antagonist + leptin + NMDA (plaid gray bars). C) Power spectrum of PPN activity from a representative slice at control (black), NMDA alone (6 min, red), leptin alone (20 min, olive), and leptin+NMDA (6 min, pink). D) ERSP (see methods) generated from the power spectrum data from slice in “C” showing how leptin+NMDA increased activity at all frequencies from 5–55 Hz, while the largest potentiation by leptin was in lower frequency ranges (<20 Hz). See Table 1 for statistical comparisons across groups.
Table 1. Comparative quantification of population response recordings.
Mean power spectrum change across treatments from population responses in the PPN shown in frequency ranges 5–10 Hz, 10–20 Hz, 20–30 Hz, and 30–55 Hz after NMDA or leptin or NMDA +leptin (left, n=4 slices); and after leptin + triple antagonist (TA) or NMDA + leptin + triple antagonist (TA, 50 nM) (right, n=4 slices). Results are represented as mean ± S.E.M.
| Mean power spectrum change | |||||
|---|---|---|---|---|---|
| Frequency Range (Hz) | Without TA (n=4) | With TA (n=4) | |||
| NMDA | Leptin | NMDA+leptin | Leptin | NMDA+leptin | |
| 5–10 | 3.3±1.3 | 4.1±0.9 | 26.6±11.3 | 22.1±8.4 | 237±124 |
| 10–20 | 3.9±0.7 | 4.0±1.4 | 35.5±11.7 | 17.6±8.4 | 105±48.1 |
| 20–30 | 4.0±1.1 | 3.1±1.1 | 29.1±10 | 17.6±5.7 | 84.2±20.4 |
| 30–60 | 2.6±0.5 | 2.5±1.1 | 23.6±8.6 | 16.4±6.8 | 75.1±31.6 |
Table 2. Statistical comparisons of population response power spectra.
Comparisons across all or specific frequency ranges with t and p values.
| Frequency Range (Hz) | Treatment | vs. | Treatment | t value | p value |
|---|---|---|---|---|---|
| All | NMDA+leptin | vs. | leptin | 7.3 | 0.001 |
| All | NMDA+leptin | vs. | NMDA7.1 | 0.001 | |
| All | NMDA+leptin+TA | vs. | leptin+TA | 6.4 | 0.001 |
| 5–10 | NMDA+leptin | vs. | leptin | 3.6 | 0.01 |
| 5–10 | NMDA+leptin | vs. | NMDA3.5 | 0.01 | |
| 5–10 | NMDA+leptin+TA | vs. | leptin+TA | 3.9 | 0.01 |
| 10–20 | NMDA+leptin | vs. | leptin | 4.1 | 0.01 |
| 10–20 | NMDA+leptin | vs. | NMDA3.8 | 0.01 | |
| 10–20 | NMDA+leptin+TA | vs. | leptin+TA | 3.2 | 0.01 |
| 20–30 | NMDA+leptin | vs. | leptin | 3.9 | 0.01 |
| 20–30 | NMDA+leptin | vs. | NMDA3.3 | 0.05 | |
| 20–30 | NMDA+leptin+TA | vs. | leptin+TA | 2.9 | 0.05 |
| 30–60 | NMDA+leptin | vs. | leptin | 3.9 | 0.01 |
| 30–60 | NMDA+leptin | vs. | NMDA3.5 | 0.01 | |
| 30–60 | NMDA+leptin+TA | vs. | leptin+TA | 2.7 | 0.05 |
Clampfit™ (Axon Instruments, Molecular Devices, CA, USA) was used to generate a power spectrum (Fig. 3C) and MatLab was used to generate an ERSP (Fig. 3D) from a 20 sec recording of population activity for each different treatment from a representative slice. The protocol used for these recordings was: baseline, NMDA 6 min, washout, leptin 20 min, leptin+NMDA 6 min. NMDA alone increased activity at all frequencies from 5–55 Hz (Fig. 3C, red line). Leptin alone induced increased activity mostly in the theta and alpha ranges (Fig. 3C, olive line). Leptin+NMDA induced increased activity at all frequencies from 5–55 Hz, although the largest potentiation by leptin was in lower frequency ranges (<20 Hz), indicating that leptin preferentially induced lower frequency activity in the PPN, suggestive of lowered arousal levels (Fig. 3C, pink line and Fig. 3D). Power spectra values for all frequencies were enhanced in the presence of TA, suggesting a dis-inhibitory synaptic mechanism.
Spontaneous miniature excitatory postsynaptic currents (mEPSCs)
We also examined the effect of leptin on NMDA- and AMPA-induced miniature excitatory postsynaptic currents (mEPSCs). Figure 4A shows an example of a single cell recording of mEPSCs with TTX, GBZ and STR in the bath. Figure 4B is a recording from the same cell after the addition of leptin. We analyzed the median amplitudes and median inter-event intervals of mEPSCs before (Fig. 4, black circles/bars) and after bath application of leptin (Fig. 4, red circles/bars). Figure 4C,D include representative cumulative amplitude and inter-event interval plots for the cell shown in Fig. 4A, B. Representative median values for both control and leptin conditions are denoted by dotted lines. The mean median inter-event interval before leptin was 4.1±1.1 sec and 1.8±0.3 sec after leptin (n=9 neurons, Paired t-test, t=3.78, df=8, p=0.005). The mean amplitude of mEPSCs before leptin was 17±1 pA and 18±1 pA after leptin (Fig. 4E, n=8, Paired t-test, t= −1.05, df=7, p =0.327). Therefore, these results suggest that leptin caused an increase in the frequency (Fig. 4D, F), but not the amplitude (Fig. 4C, E), of mEPSCs in PPN neurons. Pretreatment with TA (100 nM) reduced the median inter-event intervals (Fig. 4F, n=6; Mann-Whitney Rank Sum Test, p=0.016), failing to prevent the leptin effect on inter-event intervals (Fig. 4F, n=6; Mann-Whitney Rank Sum Test, p=0.517). Median amplitudes of mEPSCs obtained in the presence of TA were not significant in the absence, compared to the presence of leptin (Fig. 4E, ANOVA, F(3,27)=0.15, p=0.93). Therefore, leptin increased the frequency, but not the amplitude, of mEPSCs, suggesting that this hormone also acts pre-synaptically enhancing spontaneous glutamate release. In addition, pretreatment with only TA confirmed that leptin had presynaptic effects.
Figure 4. Leptin effects on spontaneous miniature excitatory postsynaptic current (mEPSC) recordings of PPN neurons.

A) Single-cell voltage clamp recording of mEPSCs in the presence of gabazine (GBZ, 10 μM) and strychnine (STR, 10 μM), along with TTX (3 μM). B) Recordings from the same cell shown in “A” after 15 min leptin (100 nM). C, D) Cumulative amplitude and inter-event intervals for the cell shown in A, B for control (black circles) and leptin (red circles) conditions. Median values for control (black) and leptin (red) conditions are denoted using dotted lines. E, F) Average median amplitudes and inter-event-intervals during control (black), leptin (solid red), triple antagonist (TA 100 nM, striped black), and leptin+TA conditions (striped red). The mean median inter-event interval before leptin was 8±0.2sec and 7.4±0.2 sec after leptin (n=9 neurons, paired t-test, t=3.78, df=8, p =0.005). The mean amplitude of mEPSCs before leptin was 17±1 pA and 18±1 pA after leptin (Fig. 4E, n=8, Paired t-test, t= −1.05, df=7, p =0.327). Therefore, leptin caused an increase in the frequency, but not amplitude of mEPSCs in PPN neurons.
Discussion
Summary of findings
Briefly, the results of these studies demonstrate, a) the presence of immunohistochemical labeling of leptin ObRb in PPN neurons (both cholinergic and non-cholinergic), b) leptin caused a partial blockade of sodium (INa) and h-currents (IH) in PPN neurons, confirming previous results, c) the leptin triple antagonist (TA) significantly reduced the blockade of INa and IH caused by leptin, d) intracellular GDPβ (a G-protein inhibitor) reduced the effect of leptin on INa but not on IH, e) intracellular GTPγS (a G-protein activator) reduced the effect of leptin on both INa and IH, f) leptin enhanced NMDA receptor-mediated responses in single neurons and in the PPN population as a whole, an effect blocked by TA, and g) leptin caused an increase in the frequency, but not the amplitude, of mEPSCs in PPN neurons.
The presence of leptin receptors has been shown to be widespread throughout the brain, not just exclusively within the hypothalamus. Indeed, leptin receptors are expressed in extra-hypothalamic regions including the cortex, hippocampus, cerebellum, and brainstem (Harvey 2007). We used leptin receptor primary antibodies and bNOS, which is known to selectively label PPN cholinergic neurons, to illustrate the presence of leptin receptors in PPN neurons (both cholinergic, bNOS-containing, and non-cholinergic). These results showed that leptin receptors are located on cholinergic as well as non-cholinergic PPN cells, suggesting a global influence in a cell group modulating waking and REM sleep.
We previously showed that leptin significantly decreased action potential amplitude and frequency, sodium current (INa) conductance, and h-current (Beck et al. 2013). H-current (IH) is a hyperpolarization-activated depolarizing current mediated by channels that are permeable to both K+ and Na+. IH plays a role in mediating resting membrane potential, the response to hyperpolarization, and pacemaker potentials controlling rhythmic oscillations. The average decrease in Na+ conductance by leptin was ~40%. These previous results suggested that leptin normally decreases activity in the PPN by reducing IH and INa currents, an effect found on every cell studied, in keeping with the results showing leptin receptor labeling on most PPN cells. We proposed that, in obesity, this effect may be blunted due to leptin resistance, leading to increased arousals and REM sleep drive.
In the present studies, we examined whether these effects of leptin were receptor-mediated. We repeated the former experiments before and after the application of the super-active leptin antagonist (TA). We show that the addition of TA significantly reduced the effects of leptin on INa and IH in PPN neurons, indicating that leptin is acting on PPN neurons via the leptin receptor. Moreover, slices pretreated with TA also showed abnormally higher, pre-synaptically mediated, frequency of excitatory mEPSCs, suggesting the existence of non-specific synaptic effects of this antagonist. Future experiments will be needed in order to clarify the full effects of TA on glutamatergic synaptic transmission.
We found that addition of intracellular GDPβ (a G-protein activator) reduced the effect of leptin on INa but not IH; and the addition of intracellular GTPγS (a G-protein inhibitor) reduced the effect of leptin on both INa and IH. These results suggest that leptin was acting through G-proteins to cause a blockade of INa and IH in PPN neurons. Differential effects of GDPβ on the effects of leptin suggests that only INa currents were blocked by rapid activation of G-proteins, while its effects on IH might involve the activation of multiple downstream second messengers, including cAMP (Hille 1994, Luthi and McCormick 1998). The fact that GTPγS affected leptin’s blockade of both INa and IH highlights the central role of G-protein activation underlying leptin modulation of PPN neurons. Future experiments are still needed to further clarify which other intracellular pathways may be affected (see below).
We also examined the effect of leptin on the PPN population as a whole and found that leptin enhanced NMDA receptor-mediated responses causing a 7 to 9-fold increase in PPN activity at all frequencies from 5 to 55 Hz, which was blocked by TA. We also examined the effect of leptin on NMDA responses in single cells and found that leptin increased the frequency of NMDA- and AMPA-induced mEPSCs. These results suggest that leptin was also having a presynaptic effect on glutamate release. TA was also able to mimic the leptin effects, suggesting that synaptic modulation by leptin might share several non-specific intracellular pathways (e.g., perhaps through the activation of several subtypes of G-proteins).
The studies described here have limitations in that they address only the effects of leptin on brain slices from normal animals. We assume that the neuronal responses in rodents may be similar in humans, although this has not been established at the cellular level. We also assume that leptin resistance would occur in animal models, but this also has not been established. Most animal models use leptin or leptin receptor knockouts, but these animals are quite ill, with dysregulation/disease in multiple organ systems. In fact, it is not clear that these models would be useful for the study of leptin resistance since there is no recurrent leptin signal (assumed to be required in order to develop leptin resistance) in models lacking the hormone or the receptor. On the other hand, animal studies do suggest administration of leptin induces changes in arousal and sleep patterns in the direction of our results (decreased arousals and REM sleep) (Sinton et al. 2012), which would be expected in the normal condition.
Synaptic and intracellular effects mediated by leptin
Leptin is known best for its role in decreasing appetite and increasing energy expenditure via hypothalamic neurons (Ahima and Flier 2000). Recently, there has been extensive research on leptin’s widespread effects throughout the brain. In both the hippocampus and hypothalamus, leptin has been shown to modulate glutamatergic transmission and glutamate-dependent synaptic plasticity (Shanley et al. 2001, Durakoglugil et al. 2005, Shanley et al. 2002). Additionally, the actions of leptin in the hippocampus appear to occur predominantly through the modulation of NMDA receptors (Harvey 2007, Moult and Harvey 2009, O’Malley et al. 2005). Therefore, we investigated the effects of leptin on glutamatergic transmission in the PPN, and found that leptin increased the spontaneous release of glutamate. PPN neurons are robustly innervated by glutamatergic afferents and the expression of NMDA receptors in the PPN undergo marked developmental changes (Simon et al. 2011). These developmental changes coincide with a leptin surge that occurs postnatally, possibly indicating a role for leptin in the developmental modulation of the PPN (Cottrell et al. 2009).
The activation of G-protein-coupled receptors has been described to cross-modulate NMDA receptors (Aramakis et al. 1997, Tong and Gibb 2008, Liu et al. 2012). Many neurotransmitters and hormones function via the activation of G-proteins resulting in short-term (i.e., modulation of ion channel gating), or long-term effects (i.e., modulation of gene expression and cellular metabolism) (Hille 1994). For example, sodium channel kinetics in nociceptive sensory neurons can be amplified by exposure to intracellular GTPγS, a G-protein activator. Such effects include increased current density (up to 2-fold), slowing of inactivation, and voltage-dependent depolarizing shift of inactivation (Vanoye et al. 2013). The stimulation of janus kinases (JAKs) can lead to the activation of several intracellular enzyme pathways including, but not limited to, the mitogen-activated protein -MAPKinase and phosphoinositide -PI3Kinase pathways (Sahu 2011). The activation of these pathways, in conjunction with G-protein-coupled receptors, can lead to downstream effects such as ion channel modulation, gene expression, and protein synthesis. Activation of the leptin receptor activates the JAK/STAT (signal transducers and activators of transcription) pathway; therefore, we investigated the possibility of a role of G-proteins in the actions of leptin in the PPN. Our results clearly suggest that at least one intracellular mechanism affected by leptin involves G-protein function. Since the most critical issue clinically is the development of leptin resistance with its resulting obesity and sleep disturbances, a fruitful area of investigation on how leptin resistance arises may be via G-protein alterations.
Another intracellular pathway that deserves attention is the suppressor of cytokine signaling-1 (SOCS-3), which represents a negative feedback to the leptin signaling through inhibition of the JAK/STAT pathway (Krebs and Hilton 2000). The SOCS-3 pathway has been proposed as a mediator of leptin resistance (Bjorbaeck et al. 1998). In fact, the induction of leptin resistance induced by SOCS-3 activation involves G-proteins (Fukuda et al. 2011). Another intracellular pathway activated by leptin has been proposed to play a role in the development of leptin resistance, the PI3Kinase-Phosphodiesterade3B-cAMP pathway (PI3K-PDE3B-cAMP). Leptin receptor activation results in the activation of the PI3K pathway, resulting in the activation of PDE3B and inhibition of cAMP production. Inhibition at any level of this pathway reverses leptin’s action within the hypothalamus. Additionally, inhibition of PDE3B reverses the induction of STAT3 activation by leptin, indicating a crosstalk between the PI3K-PDE3B-cAMP and JAK/STAT pathways, possibly through G-proteins (Sahu 2011). The findings described emphasize the need for targeting G-proteins in the study of leptin resistance.
Clinical implications
Leptin has been considered as the “satiety hormone”, as opposed to ghrelin that is considered the “hunger hormone” (Ahima and Flier 2000, Perelló and Zingman, 2012). There is a link between sleep disturbances and decreased leptin levels and leptin resistance (Aldabal and Bahammam 2011, Spiegel et al. 2005, Taheri et al. 2004, Dixon et al. 2007, Vgontzas et al. 1998). Obesity and leptin resistance are epidemic worldwide, and many of these individuals exhibit sleep/wake disturbances in the form of increased nighttime arousals and increased REM sleep (Vgontzas et al. 1998, Dixon et al. 2007). Furthermore, several psychiatric conditions such as schizophrenia, depression, and insomnia exhibit frequent nighttime arousals and increased REM sleep drive in conjunction with leptin dysregulation (Cizza et al. 2012, Vgontzas et al. 1998, Sentissi et al. 2008). Therefore, it is imperative to study the effect of leptin on the region of the brain that controls arousal and REM sleep, the PPN, in order to develop informed therapies for the sleep deficits related to obesity and leptin dysregulation. Indeed, here we designed experiments to identify some of the mechanisms at the intracellular level by which leptin acts in the RAS, and provide information on how sleep dysregulation may arise.
In schizophrenia, anxiety disorders, and bipolar/unipolar depression, increased vigilance/arousal and increased REM sleep drive (in the form of increased REM sleep duration, decreased REM sleep latency, hypervigilance, usually coupled with decreases in slow wave sleep) are major incapacitating symptoms (Caldwell and Domino, 1967; Jus et al. 1973; Garcia-Rill et al. 2009; Ross et al. 1989). Some depressed patients have higher than normal leptin levels (indicative of leptin resistance) (Cizza et al. 2012). The coincidence of hyperphagia in some cases of schizophrenia with hypervigilance (Deckleman et al. 1997), speaks to the meshing of appetite and sleep-wake homeostatic systems in these disorders. In addition, there is evidence that ~80% of schizophrenia, ~90% of panic attacks (one of the anxiety disorders), and ~80% of bipolar depressive disorder have a post-pubertal age of onset (Garcia-Rill et al. 2008, 2009). The role of leptin regulation of GnRH activity and the initiation of puberty during sleep is well established (Israel et al. 2012). These studies point only to parallels between the sleep dysregulation in obesity and that in several psychiatric disorders as being in the same direction of increased arousals and increased REM sleep drive. Thus, the existence of clear leptin dysregulation in these disorders further serves to emphasize the need for further research that might clarify the role of leptin in arousal and REM sleep control. Changes in leptin and sleep-wake control in these disorders may be coincidental, or a common dysregulation, but the issue needs study. In summary, the actions of neurotransmitters and hormones on neurons can result in a number of effects, including, modulation of ion channel gating, gene expression, cellular metabolism, and/or protein synthesis. Our results show that one mechanism by which leptin acts on PPN neurons is through G-proteins (via leptin receptor activation) to result in a number of possible downstream effects, ultimately leading to an overall down regulation of PPN activity. The therapeutic opportunities for the treatment of leptin resistance are expanded by these findings.
Acknowledgments
This study was supported by NIH awards F31 HL10842 (to PB), R01 NS020246, and by core facilities of the Center for Translational Neuroscience supported by P20 GM103425 (to EGR). In addition, Dr. Urbano was supported by FONCyT, Agencia Nacional de Promoción Científica y Tecnológica (http://www.ifibyne.fcen.uba.ar/new/): BID 1728 OC.AR. PICT 2008-2019 and PICT 2012-1769.
Abbreviations
- APV
(2R)-amino-5-phosphonovaleric acid
- AMPA
Alpha-Amino-3-Hydroxy-5-Methyl-4-Isoxazole Propionic Acid
- bNOS
brain nitric oxide synthase
- CNQX
6-cyano-7-nitroquinoxaline-2,3-dione
- ERSP
event related spectral perturbation
- GBZ
gabazine
- GDPβ
guanosine 5′-[β-thio]diphosphate trilithium salt
- GTPγS
Guanosine 5′-[γ-thio]triphosphate tetralithium salt
- IH
h-current
- INa
sodium current
- mEPSC
miniature excitatory postsynaptic current
- PPN
pedunculopontine nucleus
- REM
rapid eye movement
- RMP
resting membrane potential
- STR
strychnine
- TA
triple antagonist
Footnotes
None of the authors have a conflict of interest.
Bibliography
- Ahima RS, Flier JS. Leptin. Annual review of physiology. 2000;62:413–437. doi: 10.1146/annurev.physiol.62.1.413. [DOI] [PubMed] [Google Scholar]
- Aldabal L, Bahammam AS. Metabolic, endocrine, and immune consequences of sleep deprivation. The open respiratory medicine journal. 2011;5:31–43. doi: 10.2174/1874306401105010031. [DOI] [PMC free article] [PubMed] [Google Scholar]
- Aramakis VB, Bandrowski AE, Ashe JH. Activation of muscarinic receptors modulates NMDA receptor-mediated responses in auditory cortex. Experimental brain research. Experimentelle Hirnforschung. Experimentation cerebrale. 1997;113:484–496. doi: 10.1007/pl00005601. [DOI] [PubMed] [Google Scholar]
- Beck P, Urbano FJ, Williams DK, Garcia-Rill E. Effects of leptin on pedunculopontine nucleus (PPN) neurons. Journal of neural transmission (Vienna, Austria: 1996) 2013 doi: 10.1007/s00702-012-0957-x. [DOI] [PMC free article] [PubMed] [Google Scholar]
- Cizza G, Ronsaville DS, Kleitz H, et al. Clinical subtypes of depression are associated with specific metabolic parameters and circadian endocrine profiles in women: the power study. PloS one. 2012;7:e28912. doi: 10.1371/journal.pone.0028912. [DOI] [PMC free article] [PubMed] [Google Scholar]
- Cottrell EC, Cripps RL, Duncan JS, Barrett P, Mercer JG, Herwig A, Ozanne SE. Developmental changes in hypothalamic leptin receptor: relationship with the postnatal leptin surge and energy balance neuropeptides in the postnatal rat. American journal of physiology. Regulatory, integrative and comparative physiology. 2009;296:R631–639. doi: 10.1152/ajpregu.90690.2008. [DOI] [PMC free article] [PubMed] [Google Scholar]
- Datta S, Prutzman SL. Novel role of brain stem pedunculopontine tegmental adenylyl cyclase in the regulation of spontaneous REM sleep in the freely moving rat. Journal of neurophysiology. 2005;94:1928–1937. doi: 10.1152/jn.00272.2005. [DOI] [PMC free article] [PubMed] [Google Scholar]
- Delorme A, Makeig S. EEGLAB: an open source toolbox for analysis of single-trial EEG dynamics including independent component analysis. Journal of neuroscience methods. 2004;134:9–21. doi: 10.1016/j.jneumeth.2003.10.009. [DOI] [PubMed] [Google Scholar]
- Dixon JB, Dixon ME, Anderson ML, Schachter L, O’Brien PE. Daytime sleepiness in the obese: not as simple as obstructive sleep apnea. Obesity (Silver Spring, Md) 2007;15:2504–2511. doi: 10.1038/oby.2007.297. [DOI] [PubMed] [Google Scholar]
- Durakoglugil M, Irving AJ, Harvey J. Leptin induces a novel form of NMDA receptor-dependent long-term depression. Journal of neurochemistry. 2005;95:396–405. doi: 10.1111/j.1471-4159.2005.03375.x. [DOI] [PMC free article] [PubMed] [Google Scholar]
- Garcia-Rill E, Charlesworth A, Heister D, Ye M, Hayar A. The developmental decrease in REM sleep: the role of transmitters and electrical coupling. Sleep. 2008;31:673–690. doi: 10.1093/sleep/31.5.673. [DOI] [PMC free article] [PubMed] [Google Scholar]
- Harvey J. Leptin regulation of neuronal excitability and cognitive function. Current opinion in pharmacology. 2007;7:643–647. doi: 10.1016/j.coph.2007.10.006. [DOI] [PMC free article] [PubMed] [Google Scholar]
- Hille B. Modulation of ion-channel function by G-protein-coupled receptors. Trends in neurosciences. 1994;17:531–536. doi: 10.1016/0166-2236(94)90157-0. [DOI] [PubMed] [Google Scholar]
- Liu SB, Zhang N, Guo YY, et al. G-protein-coupled receptor 30 mediates rapid neuroprotective effects of estrogen via depression of NR2B-containing NMDA receptors. The Journal of neuroscience: the official journal of the Society for Neuroscience. 2012;32:4887–4900. doi: 10.1523/JNEUROSCI.5828-11.2012. [DOI] [PMC free article] [PubMed] [Google Scholar]
- Luthi A, McCormick DA. H-current: properties of a neuronal and network pacemaker. Neuron. 1998;21:9–12. doi: 10.1016/s0896-6273(00)80509-7. [DOI] [PubMed] [Google Scholar]
- Moult PR, Harvey J. Regulation of glutamate receptor trafficking by leptin. Biochemical Society transactions. 2009;37:1364–1368. doi: 10.1042/BST0371364. [DOI] [PMC free article] [PubMed] [Google Scholar]
- O’Malley D, Irving AJ, Harvey J. Leptin-induced dynamic alterations in the actin cytoskeleton mediate the activation and synaptic clustering of BK channels. FASEB journal: official publication of the Federation of American Societies for Experimental Biology. 2005;19:1917–1919. doi: 10.1096/fj.05-4166fje. [DOI] [PubMed] [Google Scholar]
- Perelló M, Zigman JM. The role of ghrelin in reward-based eating. Biological psychiatry. 2012;72:347–353. doi: 10.1016/j.biopsych.2012.02.016. [DOI] [PMC free article] [PubMed] [Google Scholar]
- Sahu A. Intracellular leptin-signaling pathways in hypothalamic neurons: the emerging role of phosphatidylinositol-3 kinase-phosphodiesterase-3B-cAMP pathway. Neuroendocrinology. 2011;93:201–210. doi: 10.1159/000326785. [DOI] [PMC free article] [PubMed] [Google Scholar]
- Sentissi O, Epelbaum J, Olie JP, Poirier MF. Leptin and ghrelin levels in patients with schizophrenia during different antipsychotics treatment: a review. Schizophrenia bulletin. 2008;34:1189–1199. doi: 10.1093/schbul/sbm141. [DOI] [PMC free article] [PubMed] [Google Scholar]
- Shanley LJ, Irving AJ, Harvey J. Leptin enhances NMDA receptor function and modulates hippocampal synaptic plasticity. The Journal of neuroscience: the official journal of the Society for Neuroscience. 2001;21:RC186. doi: 10.1523/JNEUROSCI.21-24-j0001.2001. [DOI] [PMC free article] [PubMed] [Google Scholar]
- Shanley LJ, O’Malley D, Irving AJ, Ashford ML, Harvey J. Leptin inhibits epileptiform-like activity in rat hippocampal neurones via PI 3-kinase-driven activation of BK channels. The Journal of physiology. 2002;545:933–944. doi: 10.1113/jphysiol.2002.029488. [DOI] [PMC free article] [PubMed] [Google Scholar]
- Shouse MN, Siegel JM. Pontine regulation of REM sleep components in cats: integrity of the pedunculopontine tegmentum (PPT) is important for phasic events but unnecessary for atonia during REM sleep. Brain research. 1992;571:50–63. doi: 10.1016/0006-8993(92)90508-7. [DOI] [PMC free article] [PubMed] [Google Scholar]
- Shpilman M, Fau- Niv-Spector L, Niv-Spector L, Fau-Katz M, Katz M, Fau-Varol C, et al. Development and characterization of high affinity leptins and leptin antagonists. Journal of biological chemistry. 2011;286:4429–4442. doi: 10.1074/jbc.M110.196402. [DOI] [PMC free article] [PubMed] [Google Scholar]
- Simon C, Hayar A, Garcia-Rill E. Responses of developing pedunculopontine neurons to glutamate receptor agonists. Journal of neurophysiology. 2011;105:1918–1931. doi: 10.1152/jn.00953.2010. [DOI] [PMC free article] [PubMed] [Google Scholar]
- Spiegel K, Knutson K, Leproult R, Tasali E, Van Cauter E. Sleep loss: a novel risk factor for insulin resistance and Type 2 diabetes. Journal of applied physiology (Bethesda, Md: 1985) 2005;99:2008–2019. doi: 10.1152/japplphysiol.00660.2005. [DOI] [PubMed] [Google Scholar]
- Steriade M, Datta S, Pare D, Oakson G, Curro Dossi RC. Neuronal activities in brain-stem cholinergic nuclei related to tonic activation processes in thalamocortical systems. The Journal of neuroscience: the official journal of the Society for Neuroscience. 1990;10:2541–2559. doi: 10.1523/JNEUROSCI.10-08-02541.1990. [DOI] [PMC free article] [PubMed] [Google Scholar]
- Taheri S, Lin L, Austin D, Young T, Mignot E. Short sleep duration is associated with reduced leptin, elevated ghrelin, and increased body mass index. PLoS medicine. 2004;1:e62. doi: 10.1371/journal.pmed.0010062. [DOI] [PMC free article] [PubMed] [Google Scholar]
- Tong H, Gibb AJ. Dopamine D1 receptor inhibition of NMDA receptor currents mediated by tyrosine kinase-dependent receptor trafficking in neonatal rat striatum. The Journal of physiology. 2008;586:4693–4707. doi: 10.1113/jphysiol.2008.158931. [DOI] [PMC free article] [PubMed] [Google Scholar]
- Vanoye CG, Kunic JD, Ehring GR, George AL., Jr Mechanism of sodium channel NaV1.9 potentiation by G-protein signaling. The Journal of general physiology. 2013;141:193–202. doi: 10.1085/jgp.201210919. [DOI] [PMC free article] [PubMed] [Google Scholar]
- Vgontzas AN, Bixler EO, Tan TL, Kantner D, Martin LF, Kales A. Obesity without sleep apnea is associated with daytime sleepiness. Archives of internal medicine. 1998;158:1333–1337. doi: 10.1001/archinte.158.12.1333. [DOI] [PubMed] [Google Scholar]