Abstract
Magnetic resonance tagging makes it possible to measure the motion of tissues such as muscles in the heart and tongue. The harmonic phase (HARP) method largely automates the process of tracking points within tagged MR images, permitting many motion properties to be computed. However, HARP tracking can yield erroneous motion estimates due to: (1) large deformations between image frames; (2) through-plane motion; and (3) tissue boundaries. Methods that incorporate the spatial continuity of motion—so-called refinement or floodfilling methods—have previously been reported to reduce tracking errors. This paper presents a new refinement method based on shortest path computations. The method uses a graph representation of the image and seeks an optimal tracking order from a specified seed to each point in the image by solving a single source shortest path problem. This minimizes the potential errors for those path dependent solutions that are found in other refinement methods. In addition to this, tracking in the presence of through-plane motion is improved by introducing synthetic tags at the reference time (when the tissue is not deformed). Experimental results on both tongue and cardiac images show that the proposed method can track the whole tissue more robustly and is also computationally efficient.
Keywords: MR tagging, HARP, motion tracking, shortest path, Dijkstra's algorithm
I. Introduction
Magnetic resonance (MR) imaging is capable of directly imaging motion of soft tissues. Traditional MR images carry information about motion only at the boundaries of tissues because the image intensities of the interior of the tissues is largely homogeneous. MR tagging [1], [2] places non-invasive and temporary markers (tags) inside the soft tissues in a pre-specified pattern, yielding images that carry information about motion within homogeneous tissues. This complements traditional anatomical images, and enables imaging the detailed information about the motion of tissues such as the heart and the tongue throughout the time. Displacement, velocity, rotation, elongation, strain, and twist are just some of the quantities that can be computed from it.
There have been many methods of processing tagged MR images reported in the literature. The first category of methods identifies the location of tag lines in the tissue from the tagged images, and then estimates the motion and strain on the whole tissue using model-based or model-free interpolation and differentiation [3]–[14]. These methods were all originally proposed for cardiac motion tracking and some have been adapted to the tongue [15]. Instead of analyzing the tag lines, the harmonic phase (HARP) method [16]–[18] computes phase images from the sinusoidally tagged MR images by applying bandpass filters in the Fourier domain. The tissue motion field can then be computed using the HARP tracking method, which is based on the fact that the harmonic phases of material points do not change with motion. We note that harmonic phase images can also be computed using Gabor filter banks [19]. Since the tagging phases are available on every image pixel inside the tissue, a dense 2D displacement field is directly achieved without interpolation. HARP processing and HARP tracking has been successfully applied in both the heart [16] and the tongue [20], and has proven to be useful for both scientific and clinical applications.
Two-dimensional (2D) in-plane motion tracking is an important part of the HARP method because other quantities are often computed using these tracking results. HARP tracking (explained below) implicitly assumes that tissue points do not move very far from one time frame to the next. If the tissue moves too fast, the temporal resolution is too low, or the MR tag parameters are selected incorrectly, this assumption is violated, and HARP tracking will fail. HARP tracking may also fail at points close to tissue boundary, and at points moving in or out from the image plane due to through-plane motion. Although such failures are relatively rare in typical well-designed applications, careful scientific studies and robust clinical applications require that the user manually identify and correct mistracked points. This can be very time-consuming, to the point where large research studies take too much time and clinical throughput is too low. In research on tongue motion, there are some utterances in which parts of the tongue move quite fast relative to the temporal resolution of the scan, causing inevitable HARP tracking errors. Efforts to track a very large number of points thereby become extremely time consuming, as manual correction is routinely required.
There have been some previous efforts to identify and automatically correct mistracked points. Khalifa et al. [21] used an active contour model to correct HARP tracking for cardiac motion. The approach is limited to the circular geometry, however, and is therefore not easily generalized for non-cardiac applications such as imaging the tongue in speech. Tecelao et al. [22] proposed an extended HARP tracking method to correct the mistracking caused by through-plane motion and boundary effects, but it did not completely address the mistracking problem. Use of spatial continuity of motion, generically called refinement, was described in Osman et al. [16] as a process that could be employed to alleviate the mistracking described above. At the time, refinement was thought to be overly time consuming to employ on a routine basis. It was also developed on circular geometries, and is not straightforward to extend to arbitrary tissue points.
Recently, we reported a region growing refinement method [23], which automatically tracks the whole tissue after a seed point is manually specified, and does this very rapidly. It has been successfully applied to both tongue and cardiac motion tracking. Although the technique is applied to directly compute motion, the region growing refinement process can also be thought of as an application-specific harmonic phase unwrapping process. With this interpretation, it is clear that the flood-fill algorithm used to unwrap DENSE phase images (cf. [24]), reported in Spottiswoode et al. [25], is another example of a refinement algorithm for improved motion estimation. In both the region growing HARP refinement method and the flood-fill algorithm for DENSE phase unwrapping, tissue points are tracked or phase-unwrapped in an order that is based solely on the local smoothness of the phase images. Because of image noise and the existence of other tissues near to that of primary interest (e.g., the heart or tongue), the spatial paths from the seed to any given points of interest can be quite erratic, and incorrect tracking may result. Though refinement is still a highly desirable strategy, it is clear that better results should be produced if an optimal path from the seed to each point can be found.
In this paper, we propose a new refinement method that represents the image as a graph and solves for the optimal refinement path by solving a single source shortest path problem. In this way, each tissue point will be accessed—i.e., tracked or phase unwrapped—via an optimal path from the seed point (which is assumed to be correctly tracked). Cost functions defined on both the edges and vertices of the (image-based) graph encourage the shortest path to stay within the same tissue region as the seed point so that incorrect estimation from long paths in adjacent regions is much less likely. The proposed method is shown to be very robust and fast. With this technique in hand and by defining a synthetic phase image at the reference time, it becomes possible to automatically track points that may appear and disappear due to through plane motion, providing an extra level of relief from manual intervention.
This paper is organized as follows. Section II reviews the HARP tracking method and describes the cause of HARP mistracking. Section III explains our shortest path based HARP tracking refinement in details, including the use of a reference time frame. Section IV shows the experimental results of our method using numerical simulations, and in vivo images of both the heart and the tongue. Finally, Section V provides a discussion and Section VI gives the conclusion.
II. Background
A. MRI tagging and the HARP method
The spatial modulation of magnetization (SPAMM) [1], [2] is a popular MR tagging protocol. The most basic form of SPAMM, so-called 1-1 SPAMM, generates smoothly varying sinusoidal tag pattern in the tissue using two 90° RF pulses. With a [+90°, +90°] RF pulse pair, the ideal acquired image can be described as
| (1) |
where M0 is the intensity of underlying MR image, e−t/T1 represents the signal decay due to T1 recovery, and ϕ(x, t) is the tagging phase. At the time t0 immediately after the tagging is applied, the tagging phase is a linear function of the point coordinate x
| (2) |
where k is the tagging frequency, e is a unit vector representing the tagging direction, and ϕ0 is an phase offset. When using a [+90°, −90°] RF pulse pair, the image is
| (3) |
In actual image acquisition when only the modulus of reconstructed images is available, phase correction is required to obtain the SPAMM images as described in Eqns. (1) and (3). Alternatively, a [+90°, +/−90°] RF pulse pair can be used to prevents locally inverted magnetization as shown in Kuijer et al. [26]. In order to improve the tag contrast and tag persistency, these two images can be combined together to generate the CSPAMM [27] or MICSR [28] images.
| (4) |
An example of a SPAMM image of the heart is shown in Fig. 1(a).
Fig. 1.
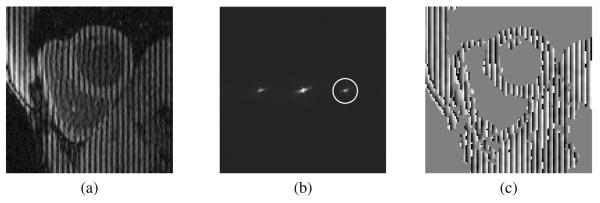
(a) Part of a SPAMM tagged MR image, (b) the magnitude of its Fourier transform, and (c) the HARP image after applying the bandpass filter as in (b). In (c), the image is masked for visualization purpose so that only phases of the tissue points are shown.
The Fourier transform of a 1-1 SPAMM image has two harmonic peaks, as shown in Fig. 1(b). To determine the phase value ϕ(x, t) from the tagged images, the HARP method applies a bandpass filter in the Fourier domain to extract just one of the harmonic peaks. The resulting filtered complex image is given by [16]
| (5) |
where D(x, t) is called the harmonic magnitude image, and ϕ(x, t) is the harmonic phase (HARP) image. The magnitude image reflects the tissue anatomy and the HARP image contains the tissue motion information. Kuijer et al. [26] also applied HARP with CSPAMM images. Because the HARP phase must be computed using an arctangent operation, its value θ(x, t) is the principal value of the true phase, as shown in Fig. 1(c). It is therefore restricted to take on values in the interval [−π, +π), and is related to the true phase by
| (6) |
where W (·) is the wrapping function defined as
| (7) |
The true phase and the harmonic phase are both material properties of the tissue [16]. Thus, the HARP values of a material point do not change as the point moves around in space. This property is called phase invariance and is the basis of HARP motion tracking.
B. HARP motion tracking
The HARP tracking method is described in detail in [16], and we give only a brief description herein. The HARP image θ(x, t) contains information about tissue motion in the tagging direction n. To track the 2D apparent motion of a material point, one needs two HARP images which are generally acquired with orthogonal tagging directions. Let Φ = [ϕ1, ϕ2]T be the tagging phases of the two orthogonally tagged images. For a material point located at x(ti) at time frame ti, we look for a point x(ti+1) at time ti+1 such that
| (8) |
Solving for x(ti+1) is a multidimensional root finding problem, which can be solved iteratively using the Newton-Raphson technique, as follows
| (9) |
with .
Since the corresponding HARP values Θ = [θ1, θ2]T are just the principal values of the true phase Φ, Eq. (9) cannot be used directly. If one assumes, however, that any material point moves less than half of the tag separation from one time frame to the next in both tag orientations—i.e., |ϕk(x(ti), ti+1) − ϕk(x(ti), ti))| < π, k = 1, 2—then it can be shown that
| (10) |
Moreover, the gradient of Φ can be written as
| (11) |
where
| (12) |
for k = 1, 2. Eq. (9) can then be written as
| (13) |
which is computable from the underlying images.
Traditional HARP tracking is therefore just the iteration of Eq. (13) until ‖x(n+1)(ti+1) − x(n)(ti+1)‖ is below a pre-specified small number, or until a specified number of iterations is reached.
C. Mistracking in traditional HARP
Though HARP tracking works well in most scenarios, points can be mistracked when the underlying assumptions are not satisfied. In general, mistracking can be classified into three categories. First, mistracking can occur when a tissue point has a large motion between two successive time frames. In this case, Eq. (13) will converge, but it finds a point that is one or more tag periods away from the truth—this is called a “tag jumping” error. This kind of mistracking can be alleviated by either improving the temporal resolution or decreasing the tag spatial frequency. However, a better temporal resolution comes at the cost of worse image resolution, while the decrease in tag frequency leads to poorer HARP phase estimation. It may be impossible to take either of these steps in some scenarios such as imaging the rapid movement of the tongue in speech.
Second, the tissue point can be mistracked because of through-plane motion. In the Lagrangian framework of HARP tracking, a material point is specified in the first time frame and tracked through all later time frames successively. Because of through-plane motion, the point may disappear in some time frames, and (possibly) re-appear in some later time frames. Because the standard tracking approach moves successively from one time frame to the next, when this occurs HARP tracking will converge to an incorrect point during the lost frames and will not generally find the correct point when it reappears.
Third, mistracking can happen at points close to the tissue boundary. The problem is that the tracking equation (13) must start with an initial “guess” as to where the point goes in the second frame in order to initialize the iterative process. If that initial guess happens to be outside the tissue in the second frame, then phase noise, caused by the lack of sufficient signal, will yield highly erratic, usually erroneous results.
In scientific and clinical applications, mistracked points must be manually identified and corrected by the user. This can be very time-consuming especially when tracking a large number of points in rapidly moving tissue. For routine clinical applications and large-scale scientific studies, it is therefore imperative to find a method that can correctly track all tissue points including these three classes of points that are mistracked in standard HARP tracking.
III. Method
Standard HARP tracking relies on the temporal continuity of a point trajectory—i.e., that a point should not move much from one time frame to the next. The idea of using spatial continuity of motion was first proposed by Osman et al. [16] and was called HARP refinement. In HARP refinement, points are tracked on concentric “circles” that are placed manually within the left ventricular (LV) myocardium, as shown in Fig. 2(a). One point on this geometric construct is manually identified as an “anchor point”—the asterisk in Fig. 2(b)—which we will refer to as a seed point. This point generally has a very small displacement over the entire cardiac cycle and can be certified by the user to be correctly tracked by standard HARP. Starting from the seed point, an adjacent point (about a pixel away) on the concentric circle is tracked next, wherein it is explicitly assumed that its initial displacement, which defines the initialization of the tracking algorithm (13), is equal to that of the seed point. The entire circle is tracked this way by assuming the initial displacement of a given point is equal to the estimated displacement of the previous point. This process, which is illustrated in Fig. 2(b), can also be applied on radial paths in order to facilitate the tracking of all concentric circles.
Fig. 2.
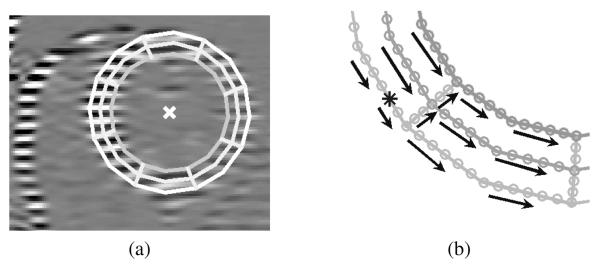
(a) Concentric circles placed on the LV. (b) Processing order for a conventional HARP refinement procedure. The asterisk shows the location of the anchor point.
This refinement method has several limitations. First, its success is overly tied to the locations of the circles. In particular, if a single point on a circle is mistracked, it is very likely that all the remaining points on the circle will also be mistracked. This means that circles placed close to the edges of the myocardium may produce a large fraction of mistracked points despite refinement. Second, correctly tracked points are limited to the circles and radial lines, which means that strain computations must be Lagrangian in nature and are not densely computed on the object of interest. Finally, although the approximately circular shape is useful for the LV, alternative shapes would have to be developed for other objects of interest such as the right ventricle (RV) and the tongue.
To address these limitations, we recently developed a region growing HARP refinement (RG-HR) method and successfully applied it to both cardiac and tongue motion tracking [23]. After a seed is manually picked, the method automatically tracks all pixels in an image by using a region growing algorithm. The order in which pixels are tracked is determined by the local smoothness of the phase images. Unfortunately, the motion estimate computed at any given point may depend on the specific path over which the motion or phase values are estimated from the seed to the given point, and region growing according to local HARP phase smoothness is not enough to promise an optimal path. It is possible, for example, for a point within the free wall of the LV to be assigned a displacement based on a seed in the septum and a path that travels through the liver for some distance rather than entirely through the myocardium. Following such paths may yield incorrect tracking. A very similar strategy was employed to unwrap phase images for motion and strain estimation using the DENSE imaging framework [25], and will therefore likely suffer from the same problem.
A. Shortest path HARP tracking refinement
We posit that the overall region growing strategy is quite good—it covers the entire field of view and is computationally fast. What needs improvement is how the path from the seed to each point is determined. Paths that are unecessarily long or go through multiple tissues should be avoided. So, rather than making local decisions on how the region should be grown relative to the region's current boundary, the entire path from the seed to each point should be determined optimally. In this way, the path's entire length goes through points that are correctly tracked with high reliability. Based on this concept, we developed a new HARP refinement method by formulating the problem as a single source shortest path problem; we call this the shortest path HARP refinement (SP-HR) method.
The shortest path problem is a common problem in graph theory [29]. For a weighted graph, it looks for a path between two given vertices such that the sum of weights (costs) of its constituent edges is minimized. In SP-HR, the image is represented as an undirected graph G = (V, E), where V is the set of vertices (pixels), and E is the set of edges (that connect pixels), as shown in Fig. 3(a). Consider tracking points within an image at time t1 to another time frame t2. Each point (pixel) x(t1) in the image at time t1 is represented as a vertex v in the graph and each edge eij = 〈vi, vj〉 in E corresponds to a neighboring vertex pair vi and vj. Each edge has an edge cost CE(eij), which is non-negative and measures the dissimilarity between the two end vertices that the edge connects. As well, each vertex is associated with a vertex cost CV (v). Both types of costs are defined below. With this framework, the HARP tracking refinement problem can be formulated as a single source shortest path problem, which lends itself to an optimal solution that can be computed very efficiently.
Fig. 3.

A graph representation of shortest path refinement procedure (a) before and (b) after some particular iteration. Diamonds: tracked vertices. Dark ovals: boundary vertices. White ovals: unvisited vertices. The numbers in the rectangles are the edge costs (refer to the text for more detail).
1) Cost functions
We define the edge cost using both the harmonic magnitudes and the implied motions at the two end vertices. Since the motion within a single tissue is smooth, then the displacements of neighboring tissue points should be similar. Accordingly, if xi(t1) and xj(t1) are adjacent tissue points at time t1, and at time t2 they move to xi(t2) and xj(t2), respectively, then the difference between their displacements, |(xi(t2) − xi(t1)) − (xj(t2) − xj(t1))| should be small. If xi(t1) is correctly tracked to xi(t2), then
| (14) |
should be approximately equal to xj(t2). In fact, if then both of their harmonic phase values should be approximately equal and the following phase similarity function
| (15) |
should be small. This function defines that part of the edge cost that depends on the smoothness of harmonic phases.
Pixels that fall outside of tissue—e.g., air or bone—have very weak MR signals and therefore possess unreliable harmonic phases. We use the harmonic magnitude images to determine whether adjacent points are likely to be within tissue or not by defining the weighting functions
| (16) |
| (17) |
where is normalized to the interval [0, 1].
When Δ(xi, xj) is small and both w1(xi, xj) and w2(xi, xj) are large, then the edge cost should be small. Accordingly, we define the edge cost function associated with the two neighboring points xi and xj as
| (18) |
The edge cost function penalizes both a lack of harmonic phase smoothness and edges that cross between tissue and background.
Given a seed vertex v0, we define the vertex cost functionCV (vi) at any other vertex vi as the accumulated edge cost along the shortest path from v0 to vi. The shortest path between two vertices is defined as a path that connects the two vertices and the sum of edge costs of whose constituent edges is minimized. For any path p = ⟨v0, v1, v2, …, vi⟩ in G from v0 to vi, its accumulated edge cost is . Therefore the vertex cost function at vi is
| (19) |
where CV (v0) is set to zero. The vertex cost function serves to establish the best path starting from the seed by which to define the initial estimated displacement at any pixel within the image. The actual estimated displacement at any pixel is found by iterating (13) starting from the initial estimate determined by the best path.
2) Motion tracking via shortest path following
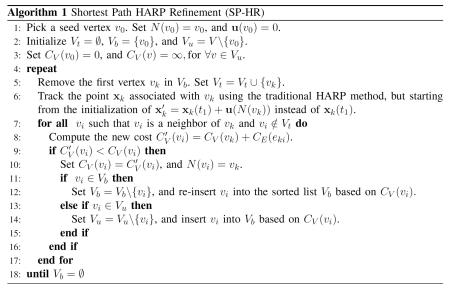
In SP-HR, the shortest path from the single manually specified seed point to every other point is found using Dijkstra's algorithm [30]. The overall algorithm is still a region growing algorithm in the sense that boundary pixels are successively added to the growing list of points comprising a region. But in addition to keeping track of the region itself, for points on the region boundary the vertex costs and the nearest neighbors (toward the seed)—we call them the predecessors—along the shortest paths are also computed and stored. When a point is tracked, the traditional HARP tracking is initialized using the displacement of the point's predecessor on the shortest path.
To carry out Dijkstra's algorithm, the vertices are classified into three disjoint sets: the boundary vertex set Vb, the tracked vertex set Vt, and the unvisited vertex set Vu. The boundary vertices are maintained in a linked list structure that is sequentially sorted based on their vertex costs—i.e., the first vertex in the list has the smallest vertex cost. We denote N(v) to be the predecessor of v on its shortest path, and u(v) = x(t2) − x(t1) to be the displacement of the point x associated with v. Given these notations, the SP-HR tracking refinement algorithm is summarized as in Algorithm 1.
A numerical example is given in Fig. 3(a) and 3(b). In this example, v33 is selected as the seed. Fig. 3(a) shows that at some iteration, four vertices (v22, v32, v43, and v34) besides the seed have been tracked and are marked with diamonds. Among the boundary vertices (marked with dark ovals), v24 has the lowest cost (1.6 + 0.5 = 2.1) via path ⟨v33, v34, v24⟩. Therefore it is tracked, and the edge costs on ⟨v24, v23⟩ and ⟨v24, v14⟩ are computed. The vertex costs of v14 and v23 are updated accordingly, and v24 becomes the predecessor of both vertices. In addition, v14 is changed to a boundary vertex. The edge and vertex costs of the graph at the end of this iteration is shown in Fig. 3(b).
The previous region growing motion estimation method [23] used an edge criterion alone to decide what point to track next. The inherent problem with this approach is that determination of what point to track next depends on what points are currently on the boundary, and these points are (potentially) far from the seed and have no tight relationships with the seed. This permits potentially unnatural effective paths to determine how points in the image are tracked. In contrast, the SP-HR algorithm ties the tracking of every point throughout the image directly to the seed point through its own optimal path determined by motion smoothness and reluctance to cross boundaries. Since the seed's displacement is certified by the user to be correctly tracked, it is far less likely that gross tracking errors will occur within the region of interest defined by the seed—e.g., the myocardium or the tongue. This approach also permits us to correctly track points that are very near to a tissue boundary, because these points will almost always be tied back to the seed through the region of interest defined by the seed.
There is an additional benefit to the SP-HR approach which we exploit below. Suppose that the seed is certified by the user to have undergone a very large displacement. In this case, all neighbors of the seed will be initialized with this displacement in order to find displacements. This overall large displacement can then propagate to all corners of the image, permitting HARP to track very large displacements. Because of this capability, we can then track directly between any pair of images in the image sequence (provided that there is a seed that is correctly tracked throughout the entire sequence). This frees us from the previous modes of operation which were limited to sequentially tracking either forward or backward in time.
B. Reference time frame
Through-plane motion can cause tissues to appear and disappear in an image sequence (cf. [22]). Because of this, it is sometimes problematic to try to track a given point all the way through the sequence. When tracking fails due to disappearing tissue, it is difficult to find a correct correspondence when it appears again later. The authors of [22] addressed this problem by defining active and inactive points corresponding to those that appear and disappear. Here we solve this problem in a much simpler way by using synthetic harmonic images at a reference time and the large-displacement, two-frame tracking procedure mentioned above. We describe this overall approach now.
The reference time t0 is defined as the time immediately after tissue tagging is applied and the tissue has not deformed. At t0, the tagging phase is a linear function of spatial location throughout the entire image (see Eqn. (2)), and the gradient of the phase function is determined by the tagging frequency known from the tagging parameters. Because it takes some time in order to acquire the first image, we can never actually obtain an image of the anatomy at the reference frame. Instead, the phase images at the reference time are represented using synthetic images. In particular, given the two tagging directions n1 and n2, synthetic HARP images can be defined as follows
| (20) |
where k1 and k2 are the (known) tagging frequencies in the e1 and e2 directions, respectively, and and are unknown phase offsets. Fig. 4 shows example synthetic HARP images. The authors of [22] describe an approach to accurately estimate the unknown phases and . In our approach this is not necessary since we simply use this image as a reference frame—not a representation of the true configuration—so we set . With this image in hand, the seed is tracked directly from the first time frame to this reference time frame using traditional HARP tracking, so that the seed now has a position in the reference frame.
Fig. 4.
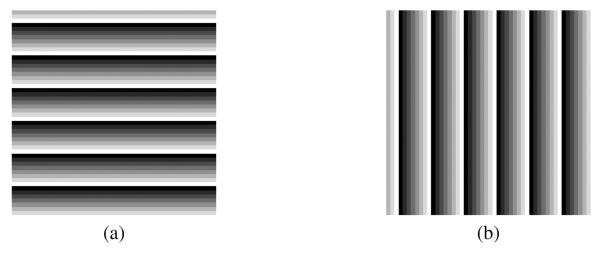
Example synthetic HARP images at the reference time frame for (a) horizontal and (b) vertical tags.
Tracking between any two time frames tj and ti is now performed in two steps. First SP-HR is applied to track directly from time frame tj to the reference time t0. Since the phase value is available everywhere in the reference time, all tissue points at tj can be tracked back to the reference time. In the second step, SP-HR is applied to track directly from t0 to time frame ti. In this step, tissue points can be tracked correctly to ti as long as they have not moved out of the image plane due to through-plane motion. We note that direct tracking quite deliberately means that no intervening time frames are used to establish a smaller motion estimates between each frame. Instead, we rely on knowledge of the motion of the seed throughout all time frames and the spatial continuity and shortest path algorithm to track potentially very large motions between these time frames.
The two-step procedure does not affect the tracking accuracy because HARP tracking and HARP refinement are based on the phase invariance property. For any tissue point p1 at tj, both the two-step tracking and direct tracking will find the same point p2 at ti, which has the same HARP values as p1 at tj.
We see that this two-step procedure does not depend on any particular tracking result except between the reference frame and either frame at times ti or tj. Therefore, if a tissue point disappears and then reappears due to through plane motion, it can still be successfully tracked between ti and tj as long as it appears in both of these images. (Points that appear in one time frame and disappear in another time cannot be tracked between these two times because it is not possible to determine their locations when they are not present in the image.) We also see that the two-step procedure (with SP-HR at its core) makes it possible to directly track between any two time frames, which is generally not possible in the conventional HARP tracking. This changes how one goes about tracking all the points in an image sequence, as we see next.
C. Tracking through an image sequence
So far we have described a process that tracks between pairs of images. When the goal is to track all points in an entire image sequence, three approaches seem reasonable given the general framework we have proposed. First, it might seem that the most general approach would be to stack up all the images as a three-dimensional image and apply the fundamental region-growing strategy to the entire stack. It turns out that this approach is problematic because it is difficult to properly scale the changes in phase and magnitude that one might expect between pixels in the spatial dimensions and pixels in the temporal dimension. We experimented with this technique but soon abandoned the approach entirely.
The second approach to tracking an entire image sequence is to simply track each image pair sequentially through time after having established the validity of the seed's trajectory through all time. This approach has the disadvantage that tissues might appear and disappear throughout the image sequence causing very erroneous tracks to appear. But it has the advantage that every image has a pixel-specific displacement field associated with it. Tracks for any point that might be picked anywhere on the image, including between voxel centers, can be computed using interpolation of this time-varying spatial vector field.
The third approach is to use the reference frame tracking approach described above. In this case, we track the image at every time frame directly to the reference time frame, and also track the reference image directly to every time frame. With these computed motion fields, the motion between any two time frames can be readily achieved using the two-step procedure. For example, by computing the motion from the first time frame to all the later time frames, this approach provides a direct Lagrangian track for each point (pixel) in the first time frame—i.e., this result tells us precisely where these first pixels are at every time frame. It will generate erroneous tracks when the tissue disappears but will pick up the correct positions when the tissue reappears. This approach is ideal for determination of Lagrangian strain over time. With the motion field from every time frame to the reference time frame in hand, this approach also makes it straightforward to compute the Eulerian strain at any time frame.
D. Seed selection
The seed point should lie within the tissue of interest and must be be correctly tracked by conventional HARP tracking through all time frames. For most applications—e.g., scientific and clinical—it is essential that the seed's trajectory be manually checked before applying SP-HR. Trial-and-error is a straightforward approach to finding a suitable seed. In this strategy, the user manually clicks on a point in one image, the point is tracked forward and backward in time using traditional HARP tracking, and then the user verifies the appropriateness of the trajectory by observing the path through all time frames. A slightly more efficient approach to finding a seed is to have the computer suggest a putative seed and then the user needs only verify its appropriateness. We describe an approach in this section that has proven to be 100% reliable in our tests to date.
The approach begins with the user outlining a region of interest, a step that is nearly always carried out in motion analysis anyway. In the heart, the region of interest is usually the LV myocardium; in the tongue, it is the body of the tongue muscle. A list of candidate seeds pi(t1), i = 1, 2, …N within the region of interest is then automatically produced. In the heart, the candidate seeds are equally spaced pixels on the mid-ventricular contour (which is found using morphological thinning of the ventricular wall). In the tongue, the candidate seeds comprise pixels on a coarse rectangular grid.
All candidate seeds are tracked forward to all later times tk, k = 2, 3, …n using traditional HARP tracking. Let the locations of the ith candidate seed at time tk be pi(tk). The points pi(tn) are again tracked backward to the first time frame, yielding the points p′(tk), k = n − 1, n − 2, …, 1. Points that can be correctly tracked with traditional HARP method must satisfy the forward-backward tracking identity . Therefore, all tracked seeds that violate this condition are removed from the candidate seed list.
In order to choose the best point from the remaining seeds, we look at the magnitudes of their second derivatives over time. We note that mistracked points typically involve a sudden displacement at some point in the trajectory, which corresponds to a sudden large acceleration—i.e., second derivative. Therefore, mistracked points tend to have a large second derivative at some point in their trajectory while correctly tracked points tend to have smaller second derivatives throughout, as illustrated in Fig. 5. Following this observation, we pick the seed from the remaining candidate points as the one that has the minimum maximum second derivative over all time, as follows
| (21) |
Numerical finite differences are used to approximate this derivative.
Fig. 5.
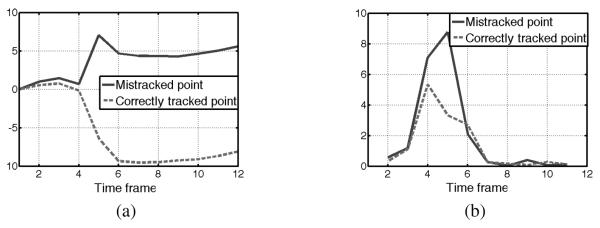
Comparison of correctly tracked and mistracked points in traditional HARP method. (a) The y components of the 2D displacements of a mistracked and a correctly tracked points among 12 time frames, and (b) the L1-norm of their second derivatives.
The seed selection approach assumes that part of the tissue can be correctly tracked over time using traditional HARP. In fact, in both the heart and the tongue there are some parts of the tissues that have small motion and therefore can always be correctly tracked in traditional HARP. The septum of the heart has small motion, and the bottom of the tongue does not move much during speech. Therefore the seed selection approach works even in the case of low temporal resolution seen in scientific and clinical applications.
IV. Experiment Results
A. Numerical Simulation
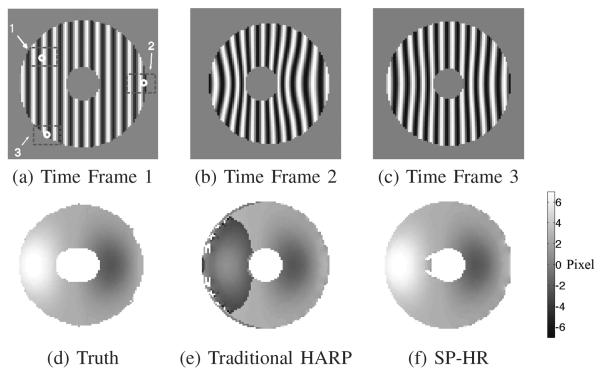
We first demonstrate the effectiveness of our SP-HR method using a simulated image sequence. In this simulation, the tissue is moving only in the left-right direction, so only one tag orientation is used. Three time frames were simulated, as shown in Figs. 6(a)–(c). Both SP-HR and traditional HARP tracking were applied and compared. In SP-HR, the two-step procedure was applied, while in the traditional HARP tracking, the points were tracked sequentially in time. The computed displacement fields from the first to the second time frames are shown in Figs. 6(d)–(f). We observe very large tracking errors in the traditional HARP result [Fig. 6(e)] on the left side of the “tissue,” which were caused by large displacement. These are not present in the SP-HR result [Fig. 6(f)].
Fig. 6.
Tracking results for simulated data, horizontal motion only. Three simulated images at time frames (a) t = 1, (b) t = 2, and (c) t = 3. Displacement fields (horizontal only, in units of pixels) from the first to the second time frames: (d) the true field, (e) that computed using traditional HARP tracking, and (f) that computed using SP-HR.
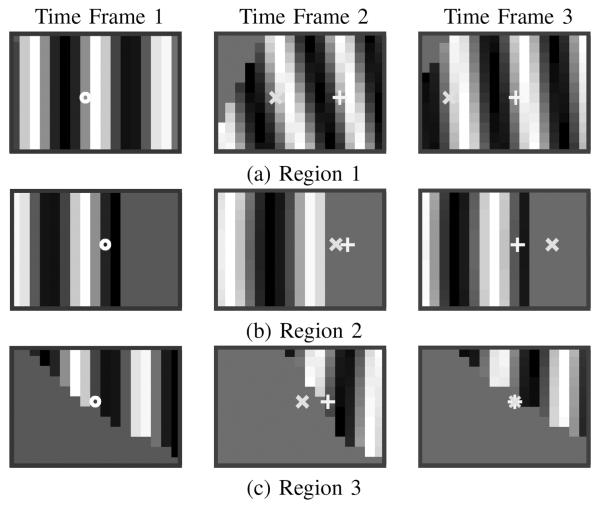
This example also serves to illustrate the three classes of mistracking that occur in traditional HARP. The three rectangular regions 1, 2, and 3 depicted in Fig. 6(a) are expanded and shown in Figs. 7(a), (b), and (c) on the left. The circles shown in Time Frame 1 were tracked to the second and third frames using the two methods and the results are shown in the second and third columns. In Region 1 the point was mistracked in traditional HARP because of a large motion between the frames, but it was correctly tracked using SP-HR. In Region 2 the point moves out of the plane in the second time frame and re-appears in the last frame due to through-plane motion. It was mistracked by both methods in the second time frame because the corresponding point does not exist. It remained mistracked by traditional HARP in Time Frame 3, but was correctly tracked by SP-HR because of its use of the reference frame. In Region 3, the tracked point is very close to the boundary. In this case, traditional HARP failed in the second time frame but recovered in the third, while SP-HR worked in all cases.
Fig. 7.
Examples of the three kinds of mistracking in traditional HARP, depicted in (a) Region 1, (b) Region 2, and (c) Region 3. The circles in Time Frame 1 are tracked into Time Frames 2 and 3 using traditional HARP (“x” symbols) and SP-HR (“+” symbols).
B. Cardiac motion tracking
We applied SP-HR to track the motion of the LV of the human heart. Experiments were carried out on 13 short axis cine tagged image sequences acquired over time from four different normal human subjects covering different parts of the heart. All human subjects data were obtained with informed consent under an approved IRB protocol. All the images were acquired on a Philips 3T Achieva MR scanner (Philips Medical Systems, Best, NL) equipped with a six channel phased array cardiac surface coil using a segmented spiral sequence with ramped flip angle technique. The data acquisitions were performed in an end-expiratory breath-hold with ECG gating. In each case the flip angle was 20 degree, the tag period was 12 mm, and the slice thickness was 8 mm. The numbers of time frames varied from 15 to 25, and the temporal resolutions varied from 20 to 43 ms. The image sizes were all 256 × 256, with FOVs either 300 mm or 320 mm.
To quantitatively evaluate our refinement method, we asked 20 volunteers to delineate the LVs from all the image sequences. We picked one time frame from each of the 13 image sequences. Time frame 4 was picked for 10 image sequences, and time frame 13 was picked for the other 3 image sequences because of better image quality. The first several time frames were not picked because the tag pattern was visible in the blood pool and the myocardium-blood pool boundaries were not clear for manual delineation. After some training (on other images), each volunteer manually drew the epicardial and endocardial contours of the LVs together with two insertion points of the RV on each of the 13 selected images. For each delineation, the myocardium region was automatically divided into epi-, mid- and endo-cardial regions which equally divided the myocardial wall in the radial direction. The septal wall was then automatically divided into two pie-shaped sectors and the free wall was automatically divided into four sectors. An example of the resulting delineation is shown in Fig. 8(a). The manual delineations are used only for quantitative evaluation, and are not used to constrain the region growing process in the SP-HR.
Fig. 8.
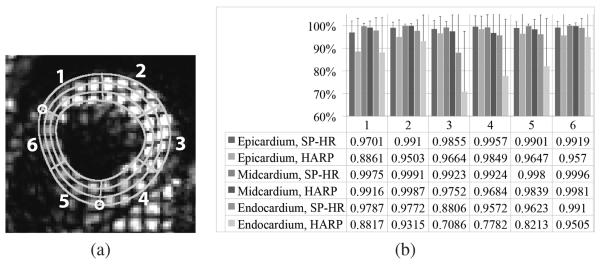
(a) Illustration of the 18 sectors of the LV. The two small circles mark the insertion points between the left and right ventricles. (b) The average ratios of correctly tracked points to total points in all epi-, mid-, and endo-cardial regions over the six sectors, for both SP-HR and traditional HARP tracking. Variances are represented by black lines. The numbers 1–6 represent sector number.
We first compared the performance of SP-HR with traditional HARP tracking in the 18 parts of the LV. The displacement fields from the first time frame to the last time frame in all image sequences were computed using both methods. In SP-HR, the seed was automatically determined as described in Section III-D. For all 260 delineations, we computed the average ratios of correctly tracked points to the total points in each of the 18 parts. The correctly tracked points are defined as points whose computed displacements are similar to their neighbors and do not have tag jumping error. They are identified automatically using a simple region growing process based on the criteria that the computed displacement of a correctly tracked point is close to the mean displacement of its neighbors. The results are shown in Fig. 8(b), and Table I shows the standard deviation over the 13 data sets. It is observed that refinement worked better in all 18 regions although both methods worked almost perfectly in the midwall regions. Traditional HARP tracking generally performs worse in the endocardium than in the epicardium, while the SP-HR works almost equally well in all regions. Regarding sectors, traditional HARP tracking performs most poorly in sectors 3 and 4 on the free wall. This is because the free wall has larger motion both in the in-plane directions as well as in the through-plane direction.
TABLE I.
Standard deviation of the ratio of correctly tracked points in the 13 data sets
| 1 | 2 | 3 | 4 | 5 | 6 | |
|---|---|---|---|---|---|---|
| Epicardium, SP-HR | 0.051 | 0.025 | 0.038 | 0.048 | 0.027 | 0.028 |
| Epicardium, HARP | 0.146 | 0.075 | 0.073 | 0.058 | 0.085 | 0.109 |
| Midcardium, SP-HR | 0.013 | 0.008 | 0.025 | 0.056 | 0.009 | 0.005 |
| Midcardium, HARP | 0.028 | 0.011 | 0.072 | 0.082 | 0.043 | 0.014 |
| Endocardium, SP-HR | 0.056 | 0.048 | 0.198 | 0.093 | 0.085 | 0.040 |
| Endocardium, HARP | 0.154 | 0.116 | 0.267 | 0.250 | 0.210 | 0.101 |
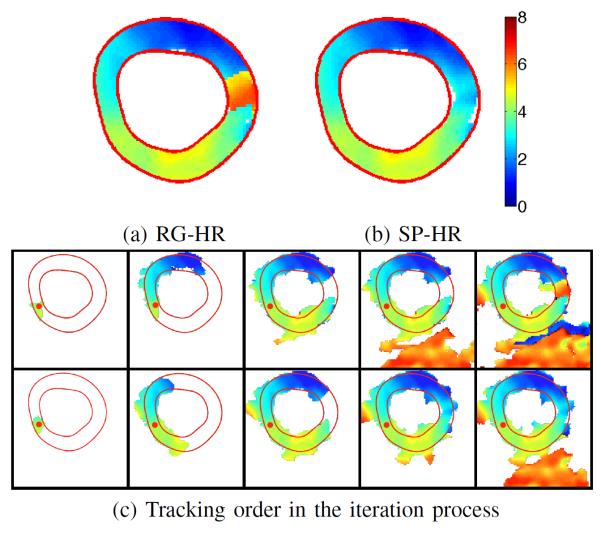
Next, we compared the performance of the SP-HR and the region-growing HARP refinement (RG-HR) methods (cf. [23]). The same seed points were picked in both methods. For each image sequence, the displacement field from the time at which the contours and regions were determined to all other times was computed using both methods. In total each method was applied 208 times. Tracking was considered to be successful if the computed motion field inside LV has no visible abrupt jump. The success rate of RG-HR was 93.8%, while SP-HR was 99.5%. SP-HR only failed on one case in which the image quality was poor and the harmonic magnitude image did not have large values at part of the myocardium. Fig. 9 shows an example in which RG-HR fails while SP-HR succeeds. Figs. 9(a) and (b) show the magnitude of the displacement field inside the LV u sing RG-HR and SP-HR methods, respectively. We observe that RG-HR result contains abrupt jumps of displacement inside the myocardium region, which indicates errors in tracking. In contrast, the SP-HR method result is smooth throughout the whole tissue.
Fig. 9.
The magnitude of the resulting displacement field inside the LV using (a) RG-HR and (b) SP-HR methods. (c) The tracking order of the (top row) RG-HR and (bottom row) SP-HR methods shown from left to right. The red dots mark the seed point.
Fig. 9(c) shows the intermediate results of the two methods on the same example in Figs. 9(a) and (b). The evolution of the tracked regions is depicted as iteration increases from left to right. It is observed that in RG-HR, the liver—at the lower part of the image—is tracked before the LV is completely tracked while in SP-HR, points in the liver are tracked only after nearly all LV points are tracked. Because of the globally defined vertex cost function in SP-HR, the tracked region grows inside the LV with a similar speed on all sides of the seed, which is not true in RG-HR. Thus, points inside the LV are reached via an optimal path in SP-HR and are more likely to be correctly tracked.
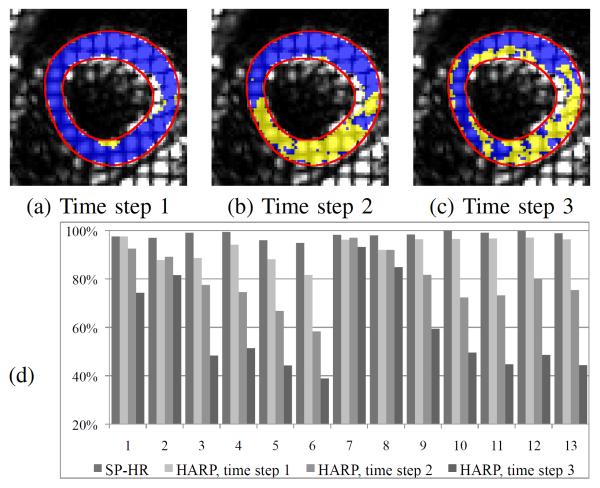
All the data sets were acquired with a relatively high temporal resolution with respect to the amount of cardiac motion. Therefore the mistrackings of traditional HARP were mainly caused by through-plane motion and points close to myocardial boundaries. To evaluate the effectiveness of our method when there is large motion and low temporal resolution, we used subsets of the image sequences obtained by dropping intermediate images. In particular, for a time step n, the points were tracked in the image series at time frames 1, n+1, 2n+1, … only. The images at the last time frames were always included so the final computed displacements could be directly compared (which means that the final time step might be less than n). By using time step other than n = 1, we mimic the situation of large motion and/or poor temporal resolution. In our experiments we computed the displacement fields from the first time frame to the last time frame using both SP-HR method and traditional HARP tracking with time steps 1, 2, and 3 on all 13 image sequences. For each image sequence, we determined the LV myocardium region by averaging all 20 rater's epicardial and endocardial contours, and including all pixels within these average boundaries. From the tracking results, we computed the ratio of correctly tracked points inside the LV myocardium. It is important to keep in mind that time steps are irrelevant in SP-HR because the two-step approach is used. We note that the seed point tracked correctly using traditional HARP in all cases including the subsampled sequences.
Figs. 10 (a)–(c) compare the correctly tracked regions on one of the 13 test image sequences using SP-HR with traditional HARP with time steps 1, 2, and 3. We observe that with a time step greater than 1 traditional HARP mistracks a large portion of the LV region and performs much worse than SP-HR; for a time step equal to 1, traditional HARP performs slightly worse than SP-HR. Fig. 10(d) illustrates the ratios of correctly tracked points in the LV myocardium of 13 image sequences when using SP-HR and traditional HARP tracking with time steps 1, 2, and 3. It can be seen from Fig. 10(d) that SP-HR worked better than traditional HARP in all image sequences, and traditional HARP performed worse with increased time step numbers in general. In the 7th and 8th image sequence the performances of traditional HARP tracking with different time steps were very similar, because these image slices are located closer to the apex points of the heart and have small in-plane and through-plane motions. On average, 98.4% points were correctly tracked using SP-HR, 93.1% in traditional HARP tracking with time step 1, 79.3% with time step 2, and 58.7% with time step 3.
Fig. 10.
Comparison of SP-HR and traditional HARP with different time steps. Correctly tracked regions on one data set using SP-HR and traditional HARP with time steps (a) 1, (b) 2, and (c) 3. Blue: correctly tracked regions using traditional HARP with different time steps; yellow+blue: correctly tracked regions using SP-HR; Red: average LV myocardium boundaries. (d) shows the percentage of correctly tracked points on the 13 test image sequences, which is shown from left to right.
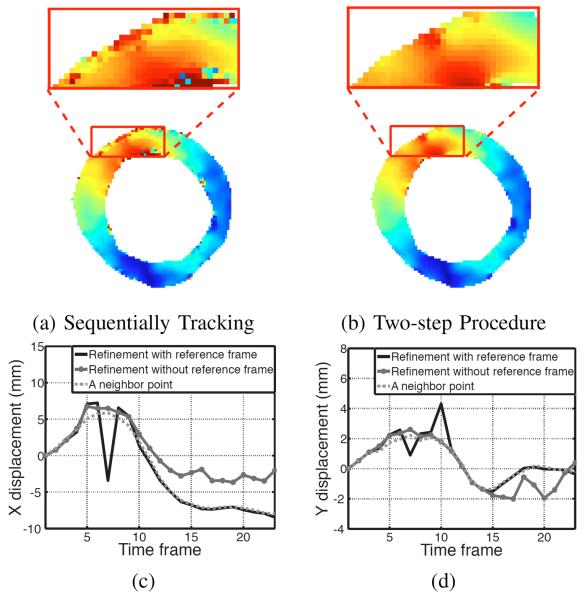
The effect of introducing the reference time frame and two-step procedure in SP-HR is shown in Fig. 11. In this experiment, we computed the displacement fields from the first to the last time frame using SP-HR in two ways: 1) by tracking through successive time frames and 2) by also using the two-step procedure with synthetic phase images in reference frame. It can be seen from Figs. 11(a) and (b) that both procedures get the same results almost everywhere inside the myocardial region. However, the two-step strategy works much better for points close to the tissue boundary. The displacement of one point over time is shown in Fig. 11(c) as an example. Due to through-plane motion, this point moved out of the imaged plane from the 5th to the 10th time frames and moved back afterwards. When tracked successively, it was mistracked from the 5th time frame until the last time frame (green dashed lines). By using the two-step procedure, this point was correctly tracked after the 11th time frame (blue lines). For comparison, the displacement of one of its neighbors that was correctly tracked in both procedures is also shown (dotted lines).
Fig. 11.
Effectiveness of using the reference frame in SP-HR tracking. Magnitude of displacement in the myocardium achieved (a) by SP-HR tracking successively from the first to last time frames and (b) by tracking first from the first time frame to the reference time frame and then from the reference time frame to the last time frame. The colormap is the same as in Fig. 9. The computed (c) x and (d) y displacement components between the first and last image frame for a point near the LV boundary and a (more interior) neighboring point.
C. Tongue motion tracking
The SP-HR method was also applied to tongue motion tracking. In this experiment, SPAMM tagged images were collected on a 1.5 T Marconi scanner for the utterance “eeoo.” The images were acquired in 12 time frames with a temporal resolution of 66 ms.
The interpolated spatial resolution was 1.09 mm × 1.09 mm × 7 mm. Four sets of images were collected: horizontal tagging with [+90° +90°] and [+90° −90°] tagging RF pulses, and vertical tagging with [+90° +90°] and [+90° −90°] tagging RF pulses. As preprocessing, the MICSR [28] images were reconstructed from these four sets of data [see Eq. (4)]. Representative MICSR tongue images at an early time frame are shown in Figs. 12(a) and (b).
Fig. 12.

(a) Horizontally and (b) vertically tagged MICSR images of a sagittal cross section of the human tongue. The trajectories of selected points over 12 time frames using (c) traditional HARP and (d) SP-HR. The points in the circles were mistracked. The trajectories are color-coded by time. For visualization purposes, the background images in (c) and (d) are the product of the horizontal and vertical tagged images.
A grid of points was placed inside the tongue and tracked over all time frames; their trajectories are shown in Figs. 12(c) and (d).
Part of the tongue moved more than half of the tag separation at some time frames because of its large deformation during speech. When using the traditional HARP tracking, the points circled in red were mistracked while all of the points were correctly tracked using SP-HR.
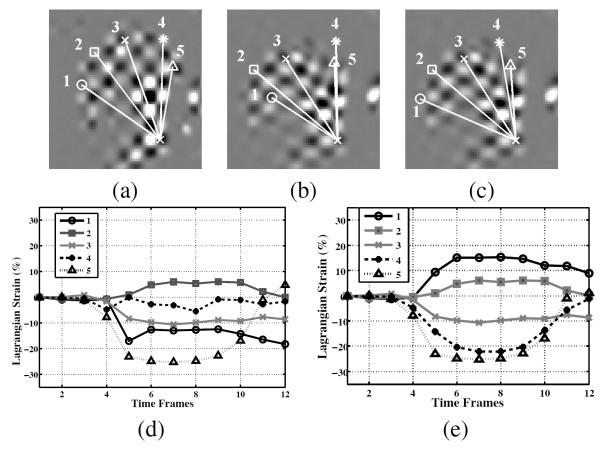
Fig. 13 illustrates how SP-HR improves Lagrangian strain calculation. The (simple) Lagrangian strain is computed as the percentage of length change of line segments with respect to the length at first time frame. It has a positive value when stretching and a negative value when contracting. In Fig. 13(b), the number 1 and number 4 line segments were mistracked in traditional HARP tracking, which made the Lagrangian strain calculation wrong, as shown in Fig. 13(d). However, they were correctly calculated using the new HARP refinement, as shown in Figs. 13(c) and (e).
Fig. 13.
The action of genioglossus (GG). (a) Five segments of GG are manually identified at the first time frame. The points are tracked using both (b) traditional HARP method and (c) SP-HR method throughout all time frames. The Lagrangian strains for the muscle groups are depicted in (d) and (e) when computed over time using (d) traditional HARP and (e) SP-HR.
D. Computation Time
We implemented the SP-HR method in C and compiled and ran it in Matlab (Mathworks, Natick MA). It works as fast as the RG-HR method because the computation required for the shortest path calculation is negligible in comparison to the remaining computations. On a computer with Intel Core Duo 1.83 GHz processor and 1.0 GB of RAM, our implementation of SP-HR took less than 0.2 second to track an entire 128 by 128 image for one time frame. The computation time of the reference frame and seed selection is in the order of milliseconds.
V. Discussion
The contribution of HARP refinement methods (both SP-HR and RG-HR) is to correct the mistracking in traditional HARP tracking and to extend the regions that can be tracked correctly. For points that are correctly tracked in both HARP refinement and traditional HARP tracking, the computed motion is the same. This is because they all rely on the same harmonic phase images and are based on the phase invariance property. This is to say, the tracking accuracy in HARP refinement methods is the same as traditional HARP, i.e., about 0.1–0.3 mm [16]. As well, with the displacement fields computed using refinement methods, the other useful quantities for functional analysis—velocity fields, strain rates, Eulerian strain, and so on—can be computed in the same way as with traditional HARP [16]–[18]. Therefore, these are not discussed in this paper.
The SP-HR method uses one seed to compute the shortest path to all other tissue points. For the part of tiusse that is far from the seed, e.g., the free wall of the myocardium when the seed is picked on the septum, it is possible that its correlation with the seed becomes low and errors build up along the path so that SP-HR produces wrong tracking results in that part (although this hasn't been seen in our experiments). This can be prevented by extending the SP-HR algorithm to use multiple seeds that spread over the tissue. The extension of the SP-HR to multiple seeds is simple: in the initialization steps (Line 2 and 3 in Algorithm 1), all the seeds need to be labeled as boundary vertices and put in Vb instead and their vertex costs are initialized as 0. The rest of the algorithm remains the same. Nonetheless, the selection of seeds from regions with large motion, e.g., the free wall of myocardium and the top part of the tongue, is often difficult because traditional HARP may mistrack these regions. In our experiments the SP-HR with single seed performed very well, so we did not exploit the use of multiple seeds.
The SP-HR method reliably computes the point trajectories over time on all image tissue points, and these results can be used for further analysis of tissue motion. For example, although incorporation of temporal smoothness is not considered in the method, the trajectories can be easily smoothed temporally using splines or the the temporal fitting method as described in [25]. In addition, the 2D reliable tracking results can be used to drive motion models to reconstruct 3D motion using a collection of tagged MR images. One possible approach is the 3D incompressible motion reconstruction method that we developed recently [31].
The two-step procedure provides a way to reduce the error caused by through-plane motion when computing point trajectories. If only the displacements from one particular time frame to all other times are of interest, the introduction of a reference time frame is not necessary. The refinement method can be directly applied between that particular time frame and all other times one by one after the seed trajectory is computed. However, we typically want to compute the displacement of a point between any two time frames, backward or forward. The introduction of reference time frame can both reduce the computation time and reduce gross tracking errors in this task.
The computed dense displacement fields from every time frame to the reference time provides the possibility of directly computing the Eulerian strain from the displacement field. In conventional HARP practice, the Eulerian strain is computed directly from the slope of the phase images [17], [18]. Now, the availability of our fast HARP refinement method provides an alternative way of Eulerian strain calculation, and the correct tracking results can also assist the calculation of other strain measures including torsions between apex and base of the heart. In addition, it has been known that the strain computation is susceptible to noise and HARP artifacts, especially the radial strain, and it is often necessary to smooth the strain map. Previously, strain smoothing is performed by smoothing the spatial derivative of the harmonic phase images [32]–[34], because smoothing directly the phase images is difficult due to phase wrapping. With SP-HR, it is now possible to directly smooth the displacement field and a smoothed Eulerian strain map can be subsequently computed.
In this paper, we applied our refinement method only on the harmonic phase images computed using the HARP method. Our method should work with the phases images computed with other methods too, e.g., Gabor filter banks [19]. In addition, as mentioned earlier, the refinement process can be thought of as an application-specific harmonic phase unwrapping process. Therefore though not demonstrated in this paper, the shortest path refinement method should be applicable to DENSE motion tracking as well with very little modification (see [24], [25]).
VI. Conclusion
We presented a new refinement method for HARP tracking by formulating a single source shortest path problem and solving it using Dijkstra's algorithm. We also developed a two-step procedure by introducing a reference time frame to help conveniently track points between any two time frames even when large displacements exist. Experimental results show that this method can reliably track every point inside the tissue even when there is large motion, low temporal resolution, through-plane motion, or the points are close to tissue boundary. This method is also computationally fast and makes it feasible to reliably compute other useful quantities in functional analysis of motion using MRI.
Acknowledgements
The authors would like to thank Drs. Maureen Stone, Emi Murano for both their many useful discussions and for identifying the severity of the mistracking problem in the tongue. The authors would like to thank Drs. Maureen Stone, Emi Murano, and Rao Gullapalli and Ms. Jiachen Zhuo for providing MR tagged data of the tongue in speech. The authors would like to thank Ms. Ying Bai for the helpful discussions on the algorithm. The authors would also like to thank Sandeep Mullur for carrying out the study involving the 20 contour delineators. This research was supported by NIH/NHLBI grant R01HL047405.
References
- [1].Axel L, Dougherty L. MR imaging of motion with spatial modulation of magnetization. Radiology. 1989;171:841–845. doi: 10.1148/radiology.171.3.2717762. [DOI] [PubMed] [Google Scholar]
- [2].Axel L, Doughety L. Heart wall motion: improved method of spatial modulation of magnetization for MR imaging. Radiology. 1989;172:349–350. doi: 10.1148/radiology.172.2.2748813. [DOI] [PubMed] [Google Scholar]
- [3].Young AA, Kraitchman DL, Dougherty L, Axel L. Tracking and finite element analysis of stripe deformation in magnetic resonance tagging. IEEE Trans. Med. Imag. 1995;14(3):413–421. doi: 10.1109/42.414605. [DOI] [PubMed] [Google Scholar]
- [4].O'Dell WG, Moore CC, Hunter WC, Zerhouni EA, McVeigh ER. Three-dimensional myocardial deformations: calculation with displacement field fitting to tagged MR images. Radiology. 1995;195:829–835. doi: 10.1148/radiology.195.3.7754016. [DOI] [PMC free article] [PubMed] [Google Scholar]
- [5].Denny TS, Prince JL. Reconstruction of 3-D left ventricular motion from planar tagged cardiac MR images: an estimation theoretic approach. IEEE Trans. Med. Imag. 1995;14(4):625–635. doi: 10.1109/42.476104. [DOI] [PubMed] [Google Scholar]
- [6].Denny TS, McVeigh ER. Model-free reconstruction of three-dimensional myocardial strain from planar tagged MR images. J. Magn. Reson. Imag. 1997;7:799–810. doi: 10.1002/jmri.1880070506. [DOI] [PMC free article] [PubMed] [Google Scholar]
- [7].Radeva P, Amini AA, Huang J. Deformable B-Solids and implicit snakes for 3D localization and tracking of SPAMM MRI data. Comp. Vis. Imag. Und. 1997;66:163–178. [Google Scholar]
- [8].Declerck J, Feldmar J, Ayache N. Definition of a four-dimensional continuous planispheric transformation for the tracking and the analysis of left-ventricle motion. Med. Imag. Anal. 1998;2(2):197–213. doi: 10.1016/s1361-8415(98)80011-x. [DOI] [PubMed] [Google Scholar]
- [9].Kerwin WS, Prince JL. Cardiac material markers from tagged MR images. Med. Imag. Anal. 1998;2(4):339–353. doi: 10.1016/s1361-8415(98)80015-7. [DOI] [PubMed] [Google Scholar]
- [10].Young AA. Model tags: direct 3D tracking of heart wall motion from tagged magnetic resonance images. Med. Imag. Anal. 1999;3(4):361–372. doi: 10.1016/s1361-8415(99)80029-2. [DOI] [PubMed] [Google Scholar]
- [11].Ozturk C, McVeigh ER. Four-dimensional B-spline based motion analysis of tagged MR images: introduction and in vivo validation. Phys. Med. Biol. 2000;45(6):1683–1702. doi: 10.1088/0031-9155/45/6/319. [DOI] [PMC free article] [PubMed] [Google Scholar]
- [12].Huang J, Abendchein D, Davila-Roman VG, Amini AA. Spatio-temporal tracking of myocardial deformations with a 4-D B-spline model from tagged MRI. IEEE Tran. Med. Imag. 1999;18(10):957–972. doi: 10.1109/42.811299. [DOI] [PubMed] [Google Scholar]
- [13].Park K, Metaxas D, Axel L. MICCAI 2003, LNCS 2878. Springer; 2003. A finite element model for functional analysis of 4D cardiac-tagged MR images; pp. 491–498. [Google Scholar]
- [14].Haber I, Metaxas DN, Axel L. Three-dimensional motion reconstruction and analysis of the right ventricle using tagged MRI. Med. Imag. Anal. 2000;4(4):335–355. doi: 10.1016/s1361-8415(00)00028-1. [DOI] [PubMed] [Google Scholar]
- [15].Dick D, Ozturk C, Douglas A, McVeigh ER, Stone M. Three-dimensional tracking of tongue using tagged MRI. Proc. Intl. Soc. Magn. Reson. Med. 2000 [Google Scholar]
- [16].Osman NF, Kerwin WS, McVeigh ER, Prince JL. Cardiac motion tracking using CINE harmonic phase (HARP) magnetic resonance imaging. Magn. Reson. Med. 1999;42(6):1048–1060. doi: 10.1002/(sici)1522-2594(199912)42:6<1048::aid-mrm9>3.0.co;2-m. [DOI] [PMC free article] [PubMed] [Google Scholar]
- [17].Osman NF, Prince JL. Visualizing myocardial function using HARP MRI. Phys. Med. Biol. 2000;45(6):1665–1682. doi: 10.1088/0031-9155/45/6/318. [DOI] [PubMed] [Google Scholar]
- [18].Osman NF, McVeigh ER, Prince JL. Imaging heart motion using harmonic phase MRI. IEEE Trans. Med. Imag. 2000;19(3):186–202. doi: 10.1109/42.845177. [DOI] [PubMed] [Google Scholar]
- [19].Montillo A, Metaxas D, Axel L. Extracting tissue deformation using Gabor filter banks. Proc. SPIE Med. Imag. 2004;5369:1–9. doi: 10.1117/12.536860. [DOI] [PMC free article] [PubMed] [Google Scholar]
- [20].Parthasaranthy V, NessAiver M, Prince JL. Tracking tongue motion from tagged magnetic resonance images using harmonic phase MRI (HARP-MRI) Proc. 15th Intl. Cong. Phon. Sci. 2003 [Google Scholar]
- [21].Khalifa AM, Youssef AM, Osman NF. Improved harmonic phase (HARP) method for motion tracking a tagged cardiac MR images. Proc. IEEE Eng. Med. Biol. Soc. 2005:4298–4301. doi: 10.1109/IEMBS.2005.1615415. [DOI] [PubMed] [Google Scholar]
- [22].Tecelao SR, Zwanenburg JJ, Kuijer JP, Marcus JT. Extended harmonic phase tracking of myocardial motion: Improved coverage of myocardium and its effect on strain results. J. Magn. Reson. Imag. 2006;23(5):682–690. doi: 10.1002/jmri.20571. [DOI] [PubMed] [Google Scholar]
- [23].Liu X, Murano E, Stone M, Prince JL. HARP tracking refinement using seeded region growing. Proc. IEEE Int. Sym. Boimed. Imag. 2007:372–375. [Google Scholar]
- [24].Aletras AH, Ding S, Balaban RS, Wen H. DENSE: Displacement encoding with stimulated echoes in cardiac functional MRI. J. Magn. Reson. 1999;137:247–252. doi: 10.1006/jmre.1998.1676. [DOI] [PMC free article] [PubMed] [Google Scholar]
- [25].Spottiswoode BS, Zhong X, Hess AT, Kramer CM, Meintjes EM, Mayosi BM, Epstein FH. Tracking myocardial motion from cine DENSE images using spatiotemporal phase unwrapping and temporal fitting. IEEE Tran. Med. Imag. 2007;26(1):15–30. doi: 10.1109/TMI.2006.884215. [DOI] [PubMed] [Google Scholar]
- [26].Kuijer JPA, Jansen E, Marcus JT, van Rossum AC, Heethaar RM. Improved harmonic phase myocardial strain maps. Mag. Reson. Med. 2001;46:993–999. doi: 10.1002/mrm.1286. [DOI] [PubMed] [Google Scholar]
- [27].Fischer SE, McKinnon GC, Maier SE, Boesiger P. Improved myocardial tagging contrast. Magn. Reson. Med. 1993;30(2):191–200. doi: 10.1002/mrm.1910300207. [DOI] [PubMed] [Google Scholar]
- [28].NessAiver M, Prince JL. Magnitude image CSPAMM reconstruction (MICSR) Magn. Reson. Med. 2003;50(2):331–342. doi: 10.1002/mrm.10523. [DOI] [PubMed] [Google Scholar]
- [29].Cherkassky BV, Goldberg AV, Radzik T. Shortest paths algorithms: theory and experimental evaluation. Mathematical Programming. 1996;73(2):129–174. [Google Scholar]
- [30].Dijkstra EW. A note on two problems in connexion with graphs. Numerische Machematik. 1959;1:269–271. [Google Scholar]
- [31].Liu X, Abd-Elmoniem K, Prince JL. MICCAI 2009, Part II, LNCS 5762. 2009. Incompressible cardiac motion estimation of the left ventricle using tagged MR images; pp. 331–338. [DOI] [PMC free article] [PubMed] [Google Scholar]
- [32].Osman N, Prince JL. Improving HARP to produce smooth strain maps of the heart. Proc. Intl. Soc. Magn. Reson. Med. 2001:605. [Google Scholar]
- [33].Parthasarathy V, Prince JL. Artifact reduction in HARP strain maps. Proc. Intl. Soc. Magn. Reson. Med. 2004:1785. [Google Scholar]
- [34].Abd-Elmoniem KZ, Parthasarathy V, Prince JL. Artifact reduction in HARP strain maps using anisotropic smoothing. Proc. SPIE Med. Imag. 2006;6143:841–849. [Google Scholar]


