

Abstract
Ceramide is a key metabolite in both anabolic and catabolic pathways of sphingolipids. The very long fatty acyl chain ceramides N-(docosanoyl)-sphing-4-enine (Cer(22:0)) and N-(tetracosanoyl)-sphing-4-enine (Cer(24:0)) are associated with multiple biological functions. Elevated levels of these sphingolipids in tissues and in the circulation have been associated with insulin resistance and diabetes. To facilitate quantification of these very-long chain ceramides in clinical samples from human subjects, we have developed a sensitive, accurate, and high throughput assay for determination of Cer(22:0) and Cer(24:0) in human plasma. Cer(22:0) and Cer(24:0) and their deuterated internal standards were extracted by protein precipitation and chromatographically separated by HPLC. The analytes and their internal standards were ionized using positive-ion electrospray mass spectrometry, then detected by multiple reaction monitoring with a tandem mass spectrometer. Total liquid chromatography–tandem mass spectrometry (LC-MS/MS) run time was 5 minutes. The assay exhibited a linear dynamic range of 0.02–4 and 0.08–16 μg/ml for Cer(22:0) and Cer(24:0), respectively, in human plasma with corresponding absolute recoveries from plasma at 109 and 114%, respectively. The lower limit of quantifications were 0.02 and 0.08 μg/ml for Cer(22:0) and Cer(24:0), respectively. Acceptable precision and accuracy were obtained for concentrations over the calibration curve ranges. With the semi-automated format and short LC run time for the assay, a throughput of ~200 samples/day can easily be achieved.
Keywords: very long chain ceramides, mass spectrometry, sphingolipids, validated assay, diabetes
Introduction
Ceramides consist of a long chain sphingoid base and an amide-linked fatty acid that is either saturated or unsaturated and varies in length from two to 28 carbon atoms. The metabolic pathways responsible for ceramide synthesis include the sphingomyelinase pathway, the de novo synthesis pathway, the exogenous ceramide-recycling pathway, and the salvage pathway [1]. Ceramides have been implicated in regulation of diverse cellular processes, including cell cycle arrest, apoptosis, senescence, and stress responses [2,3]. These processes may be mediated through ceramide’s effect on membrane platforms, including re-organization of rafts and selective trapping of receptors and signaling proteins, or through its role as a second messenger[2]. Formation of ceramides can be induced by different stimuli such as tumor necrosis factor-α, Fas ligand, phorbol ester, heat stress, oxidative stress, ionizing radiation, and chemotherapeutics [4]. Since the different biological effects caused by ceramides depend on the type of fatty acid attached to the sphingoid base, it is important to consider changes in ceramide content in a structure-specific manner when studying its biological functions [5].
N-(docosanoyl)-sphing-4-enine (Cer(22:0)) and N-(tetracosanoyl)-sphing-4-enine (Cer(24:0)) are major ceramide species present in human platelets and plasma [6,7], and alterations in levels of these molecular species have been correlated with metabolic disease in humans. In obese women, hepatic steatosis is correlated with increased levels of Cer(22:0) in subcutaneous adipose tissue [8]. Accompanying increases in macrophage inflammatory markers in adipose tissue suggest that these lipids may relate to the pathogenesis of the metabolic derangements. Systemically, Cer(24:0) is increased in the plasma of obese type 2 diabetic subjects compared to controls, and levels correlate inversely with insulin sensitivity [9]. While these human studies are associative, data from animal models demonstrate that de novo synthesized ceramide functions as a mediator of insulin resistance and suggest that this pathway may provide new biomarkers of disease and/or targets for therapeutic interventions [10].
To gain further insight into the role of these very long-chain ceramides in human pathophysiology, an accurate and precise analytical method for determination of Cer(22:0) and Cer(24:0) is required. Numerous methods have been developed for profiling and quantification of individual ceramides in biological matrices [11–23]. including thin-layer chromatography (TLC) [24], high performance liquid chromatography (HPLC)[12], immunochemical methodologies [25], enzymatic assay [13], tandem mass spectrometry[22], liquid chromatography–tandem mass spectrometry (LC-MS/MS) [11,14–17,21,26], gas chromatography[18,19], and gas chromatography-mass spectrometry [18,19,23]. While assays for Cer(22:0) and Cer(24:0)have previously been reported [14,16,26], these types of assays, however, are not well-suited for clinical application because matrix-based quality control (QC) samples are not used to monitor assay performance and robustness, and sample throughput tends to be low. Here, we describe a high-throughput method for determination of Cer(22:0) and Cer(24:0) that is validated according to the Food and Drug Administration (FDA) bioanalytical method validation guidance [27] and the principles of fit-for-purpose assay method development for biomarker measurement [28,29].
Experimental
Chemicals and reagents
Cer(22:0) and Cer(24:0) were obtained from Avanti Polar Lipids (Alabaster, AL). The internal standards N-13,13,14,14- [2H4] (docosanoyl)-sphing-4-enine ([2H4]Cer(22:0) (greater than 98% chemical purity and 97% isotopic purity) and N-15,15,16,16-[2H4] (tetracosanoyl)-sphing-4-enine ([2H4]Cer(24:0) (greater than 98% chemical purity and 97% isotopic purity) were prepared as described in Electronic Supplemental Material. Formic acid and bovine serum albumin (BSA) were obtained from Sigma–Aldrich (St. Louis, MO). All HPLC solvents (isopropanol and chloroform) were LC-MS grade and were purchased from Honeywell (Morristown, NJ). Milli-Q ultrapure water was prepared in-house with a Milli-Q Integral Water Purification System (Billerica, MA).
Sample collection
The study was performed in agreement with the 1990 Declaration of Helsinki and subsequent amendments. Fasting plasma samples from control (n=5), obese (n=5), and obese type 2 diabetic (n=4) premenopausal female subjects between the ages of 30 and 55 years were collected from subjects enrolled in the Lipid Biomarkers for Diabetic Complications protocol, which was approved by the Human Studies Committee at Washington University. Diabetes was confirmed by oral glucose tolerance testing and diabetics were treated with oral medications only. From each subject, two samples were obtained two weeks apart. De-identified plasma samples were provided for analysis in accordance with Human Studies Committee Guidelines. For preparation of QC samples and standard curves, control human plasma was obtained commercially (BioChemed Services; Winchester, VA).
Stock solution preparation
All the stock solutions (1 mg/ml) were prepared in isopropanol. A working solution containing 200 μg/mL of Cer(22:0) and 800 μg/mL of Cer(24:0) was prepared by the dilution of the stock solution with isopropanol. An internal standard/protein precipitation solution (0.0125 μg/mL of [2H4]Cer(22:0) and 0.05μg/mL of [2H4]Cer(24:0))was prepared in isopropanol-chloroform (9:1).
Sample preparation
Standards, QCs, blank or study samples (50 μL) were aliquoted into 96-well (2 mL/well) plate. To each well internal standard/protein precipitation solution (400 μL) was added except that isopropanol-chloroform (9:1) (400 μL) was used for a blank. The plate was vortexed for 3 min, centrifuged for 10 min at 3000 g, and 250 μL of supernatant transferred to clean 96 wells (1 mL/well) plate with a Tomtec Quadra 96 (Tomtec, Hamden, CT) for LC-MS/MS assay.
LC-MS/MS analysis
LC–MS/MS analysis was conducted on a Shimadzu (Columbia, MD) Prominence UFLC system coupled with an Applied Biosystems/MDS Sciex (Ontario, Canada) 4000QTRAP mass spectrometer using multiple reaction monitoring (MRM). Separation of Cer(22:0) and Cer(24:0) was carried out at 50 °C using a Phenomenex (Torrance, CA) Gemini C6-phenyl analytical column (2 × 50 mm, 5 μm) connected to a Phenomenex (Torrance, CA) SecurityGuard C18 guard column (4 × 3 mm) at a flow rate of 0.6 mL/min. The mobile phase consisted of 0.1% formic acid in water (solvent A), and 0.1% formic acid in isopropanol (solvent B). The step gradient was as follows: 0–0.5 min, 65% solvent B; 0.5–2 min, 65% to 90% solvent B; 2–2.1 min, 90% to 100% solvent B; 2.1–3 min, 100% solvent B; 3–3.1 min; 100% to 65% solvent B; 3.1–5 min 65% solvent B. The HPLC eluate was directed into the mass spectrometer for data acquisition within the 2-min time window (1.5 – 3.5 min) in which Cer(22:0) and Cer(24:0) were eluted; elsewhere, eluate was sent to waste to minimize source contamination. The injection volume was 5 μL and the total run-time was 5 min. The ESI source temperature was 300 °C; the ESI needle was 5500 V; the declustering potential was 66 V; the entrance potential was 10 V; and the collision cell exit potential was 10 V. The collision and curtain gas were set at medium and 15, respectively. Both desolvation gas and nebulizing gas were set at 45 L/min and the collision energy was 40 eV. For MRM, the dwell time was set at 50 ms for each of the signal from transitions of m/z 622 to 264 (quantifier for Cer(22:0)), m/z 622 to 282 (qualifier for Cer(22:0)), m/z 650 to 264 (quantifier for Cer(24:0)), m/z 650 to 282 (qualifier for Cer(24:0)), m/z 626 to 264 ([2H4]Cer(22:0)) and m/z 654 to 264 ([2H4]Cer(24:0)). Data were acquired and analyzed by Analyst software (version 1.5.1). Calibration curves were constructed by plotting the corresponding peak area ratios of analyte/internal standard versus the corresponding analyte concentrations using weighted (1/x2) least squares regression analysis.
Standard curves
Due to the endogenous presence of Cer(22:0) and Cer(24:0) in human plasma, 5% BSA in water was used to prepare the calibration standards. Calibration standards were prepared by spiking Cer(22:0) and Cer(24:0) working solution into 5% BSA in water and plasma, to the final concentrations consisting of Cer(22:0) and Cer(24:0) at 0.02/0.08, 0.05/0.2, 0.1/0.4, 0.2/0.8, 0.5/2, 1/4, 2/8, 4/16 μg/mL, respectively, by serial dilution. 5% BSA in water served as blank. The calibration standards in plasma were used to assess the parallelism between standard curves prepared in biological matrix (plasma) and surrogate matrix (5% BSA in water).
Quality control samples
A pooled-plasma sample was analyzed to establish the mean concentration of endogenous Cer(22:0) and Cer(24:0) by the LC/MS/MS method. The low (L), medium (M) and high (H) plasma quality control (QC) samples were prepared by spiking Cer(22:0) and Cer(24:0) working solution to yield endogenous level + 0/0, endogenous level + 1.5/6, and endogenous level + 3/12 μg/mL, respectively. The lower limit of quantification (LLOQ) sample was prepared in 5% BSA. The endogenous level + 6/24 μg/mL QC, which is also referred to as a dilution quality control (DQC) sample, was higher than the upper limit of quantification (ULOQ: 4/16 μg/mL of Cer(22:0)/Cer(24:0)), and thus was diluted 1:4 with 5% BSA prior to extraction.
Linearity, precision and accuracy
The linearity response of analytes was assessed over their respective calibration range from three batches of analytical runs. The precision and accuracy of the assay were determined for each analyte at LLOQ, LQC, MQC and HQC concentration levels in human plasma over the three batch runs. The dilution QC was used to assess the dilution integration. These QC concentrations included the known fortified levels added to the plasma plus the endogenous concentration of analyte. For each QC concentration, analysis was performed in six replicates on each day except for dilution QCs for which three replicates were prepared. Precision and accuracy are denoted by percent coefficient of variance (%CV) and percent relative error (%RE), respectively. The calculation of precision and accuracy is described in Electronic Supplemental Material. The accuracy and precision were required to be within ± 15%RE of the nominal concentration and ≤15%CV, respectively, for LQC, MQC, HQC, and DQC samples. The accuracy and precision were required to be within ± 20%RE of the nominal concentration and ≤20%CV for LLOQ samples in the intra-batch and inter-batch assays [27].
Sample stability
For each analyte, long-term storage, and freeze/thaw stabilities, and stabilities on the bench-top and in the autosampler were determined at the LQC and HQC concentration levels (n = 3). Long-term storage stability of analytes in human plasma was tested up to 39 days upon storage at −80 °C. Bench-top stability was evaluated from samples that were kept on lab bench at room temperature for 14 hours before sample extraction. Freeze/thaw stability was tested by freezing the samples overnight, followed by thawing to room temperature the next day. This process was repeated five times. A standard curve was prepared on the day of analysis when long-term storage, bench-top and freeze/thaw stabilities were measured. In the autosampler, stability was tested over three days by injecting the first batch of the validation samples. Stock solution stability was established by quantification of samples from dilution of two stock solutions that have been stored at −20 °C for 38 days and at room temperature on the bench for 4 hours, respectively, to the final ULOQ solution (4/16 μg/mL of Cer(22:0)/Cer(24:0) in isopropanol). A fresh standard curve was established each time.
Analysis of clinical samples
Samples consisted of calibration standards in duplicate, a blank, a blank with internal standards, QC standards (LQC, MQC and HQC), and unknown clinical samples were analyzed. The standard curve covered the expected unknown sample concentration range, and samples that exceeded the highest standard could be diluted and re-assayed. In the dilution sample re-assay, a diluted QC in triplicate would be also included in the analytical run. The results of the QC samples provided the basis of accepting or rejecting the run according to FDA guidelines [27].
Statistics
Results are expressed as mean ± S.D. For group comparisons, and the statistical significance of differences in mean values was determined by a two-tailed Student’s t test. A p value of 0.05 or less was considered significant.
Results and discussion
LC–MS/MS assay development
Cer(22:0), Cer(24:0) and their respective deuterated internal standards formed [M+H-H2O]+, [M+H]+ and [M+Na]+ ions, when subjected to ESI in positive ion mode. The collision activated dissociation product ion spectrum of the [M+H]+ ion of Cer(22:0) at m/z 622 and proposed structures of the fragment ions are shown in Fig. 1 [31]. The most abundant product ion at m/z 264, arising from loss of fatty acyl chain, was chosen to set up multiple reaction monitoring (MRM) transition for quantification of Cer(22:0) and Cer(24:0). MRM transitions from [M+H]+ to m/z 284 were also recorded for further structure identification. We used a Gemini Phenyl C6 (2 × 50 mm, 5μm) column, which provided superb separation within a 5 minute run time.
Fig. 1.

Representative product ion spectrum of Cer(22:0) and proposed structures of main product ions of Cer(22:0), Cer(24:0), [2H4]Cer(22:0) and [2H4]Cer(24:0)
Among the major methods typically used for sample clean up, protein precipitation (PPT) generally yields samples with more impurities than liquid-liquid extraction (LLE) and solid-phase extraction (SPE). Despite this drawback, we chose PPT because it offers high throughput and enables automated workflows. During PPT method optimization, individual organic solvents (e.g., methanol, acetonitrile, and isopropanol), alone or combined in different ratios with chloroform, were evaluated. The optimized method was precipitation with isopropanol-chloroform (9:1) (see Electronic Supplementary Material Table S1). The supernatant was injected directly after it was transferred from the PPT plate to a new plate with liquid handler. The semi-automated method allowed processing ~200 samples over two hours.
Surrogate matrix selection for standard curves
One common challenge in biomarker analysis is to select an appropriate surrogate matrix that is free of target analytes and is comparable to unknown sample matrix with respect to matrix effects and extraction efficiency. We used 5% BSA in water, as matrix to establish standard curve since good linearity and repeatability can be achieved and non-specific binding was not observed. In this study, we were able to construct standard curves from standards prepared in BSA solution and in human plasma, and the deviation of the standard curves were less than 3% for Cer(22:0) and Cer (24:0) (Table 1). The intercept of the former curve was close to zero, while it is slightly greater than zero for the latter due to the presence of the endogenous analytes.
Table 1.
Parameters of standard curves prepared in BSA solution and human plasma
| Analyte | Matrix | Slope | Intercept | R2 | Deviation of standard curves in BSA/water and plasma |
|---|---|---|---|---|---|
| Cer(22:0) | BSA/water | 4.85 | 0.0102 | 0.9992 | −1.02% |
| Plasma | 4.9 | 3.42 | 0.9986 | ||
| Cer(24:0) | BSA/water | 0.767 | 0.00437 | 0.9969 | −1.54% |
| Plasma | 0.779 | 1.99 | 0.9983 |
Extraction efficiency and matrix effects
To evaluate the recoveries of the Cer(22:0) and Cer(24:0) from human plasma and matrix (5% BSA), signals of [2H4]Cer(22:0) and [2H4]Cer(24:0)from pre-extraction spiked samples to those post-extraction spiked samples were compared. Excellent recoveries of Cer(22:0) and Cer(24:0) from plasma and from BSA were obtained (see Electronic Supplementary Material Table S2). The matrix factors[32] for Cer(22:0) and Cer(24:0) were assessed by comparing the peak response of the ([2H4]Cer(22:0) and [2H4]Cer(24:0)) from post-extraction spiked samples to equivalent pure compound solutions in isopropanol-chloroform (9:1). No significant matrix effects were observed for Cer(22:0) in BSA or Cer(24:0) in BSA and plasma. Although matrix effect was observed for Cer(22:0) in plasma, the co-elution of deuterium-labeled internal standard compensated the matrix effect and the accuracy and precision were not affected.
Selectivity
To ascertain the selectivity of the plasma method, blank (BSA solution) with and without internal standard and six independent human plasmas were analyzed. As shown in Fig. 2a and 2h, the responses of interfering peaks from blank were less than 1% of that of Cer(22:0) and Cer(24:0) in LLOQ and less than 1% of that of internal standards. As shown in Fig. 2b and 2i, the responses of interfering peaks from blank with internal standards were less than 3% of that of Cer(22:0) and less than 1% of that Cer(24:0) in LLOQ. Fig. 2c and 2j shows the highest calibrator (ULOQ, 6/24 μg/mL of Cer(22:0)/Cer(24:0)) without internal standards, and the contribution from [M+4+H]+ isotope peaks of Cer(22:0) and Cer(24:0) were less than 0.1% of the those of their internal standards.
Fig. 2.

LC-MS/MS chromatograms for Cer (22:0) and Cer(24:0). Chromatograms are shown for Cer (22:0)/Cer(24:0) in blank (a/h), blank with internal standard (b/i), highest calibrator without internal standard (c/j), human plasma without internal standard (d/k), human plasma with internal standard (e/l), human plasma in 2 MRM transitions (f/m), and LLOQ (g/n). In a, b, c, d, e, g, h, i, j, k, l and n, the analyte and internal standard are shown in blue and red, respectively. Mass transitions 622 →264 and 622 →282 are shown in blue and red in f, respectively. Mass transitions 650 →264 and 650 →282 are shown in blue and red in m, respectively
All the human plasma used contained endogenous levels of Cer(22:0) (Fig. 2d) and Cer(24:0) (Fig. 2k). There were no interfering peaks from the human plasma at the retention time and in the MRM channels of the internal standards. Fig. 2e and 2l show the chromatograms of Cer(22:0) and Cer (24:0) in human plasma with internal standards. Fig. 2f and 2m also show chromatograms of the second mass transitions of m/z 622 to 282 for Cer(22:0) and m/z 650 to 282 for Cer(24:0), respectively, that were used for purposes of confirmation.
The selectivity was also evaluated by comparison of branching ratio[33,30,34] of the mass transitions from 6 individual blank plasma samples with that of the highest calibrator (ULOQ sample) prepared in isopropanol-chloroform (9:1). The branching ratio is the ratio of peak areas of two mass transitions of Cer(22:0) (m/z 622 to 264 / m/z 622 to 280) or Cer(24:0) (m/z 650 to 264 / m/z 650 to 280), used to assure specificity of the detection. The selectivity was further confirmed by branching ratio of 6 individual blank plasma samples within 10% of the value of the highest calibrator (see Electronic Supplementary Material Table S3).
Sensitivity
The LLOQ for Cer(22:0)/Cer(24:0) was prepared in BSA solution at 0.02/0.08 μg/mL, the lowest concentration in the standard curve. The LLOQ samples were processed and analyzed with a calibration curve and QC samples. The intra-run precisions at LLOQ level were 2.7–3.4%CV and 2.8–3.4%CV for Cer(22:0) and Cer(24:0), respectively. The intra-run accuracy levels were −3.2–0.0%RE and −1.0–4.1%RE for Cer(22:0) and Cer(24:0), respectively. The inter-run precision was in the range of 3.2%CV and 3.6%CV for Cer(22:0) and Cer(24:0), respectively. The inter-run accuracy was −1.6%RE and 1.3%RE for Cer(22:0) and Cer(24:0), respectively (Table 2). A typical MRM chromatogram at the LLOQ concentration is shown in Fig. 2g and 2n.
Table 2.
Intra- and inter-assay accuracy and precision of Cer(22:0) and Cer(24:0)
| Run ID | QC Level | LLOQ | LQC | MQC | HQC |
|---|---|---|---|---|---|
| Nominal concentration Cer(22:0)/Cer(24:0) (μg/mL) | 0.02/0.08 | 0.703/2.56 | 2.20/8.56 | 3.70/14.6 | |
| 1 | Intra-run mean (n = 6) | 0.02/0.081 | 0.710/2.57 | 2.19/8.69 | 3.39/13.59 |
| Intra-run precision (%CV) | 3.1/3.4 | 2.6/0.8 | 2.3/0.8 | 2.6/0.7 | |
| Intra-run accuracy (%RE) | 0.0/1.5 | 1/0.3 | 0.5/1 | −8.4/−7.0 | |
| 2 | Intra-run mean (n = 6) | 0.0194/0.083 | 0.700/2.50 | 2.18/8.65 | 3.38/13.73 |
| Intra-run precision (%CV) | 3.4/3.4 | 1.9/1.2 | 1.7/1.8 | 1.4/1.0 | |
| Intra-run accuracy (%RE) | −3.2/4.1 | −0.4/−2.2 | −1.1/−1 | −8.6/−5.9 | |
| 3 | Intra-run mean (n = 6) | 0.0197/0.079 | 0.696/2.57 | 2.19/8.55 | 3.34/13.50 |
| Intra-run precision (%CV) | 2.7/2.8 | 2.4/1.1 | 1.5/0.5 | 3.1/1.1 | |
| Intra-run accuracy (%RE) | −1.6/−1.0 | −1/0.5 | −0.6/−0.2 | −9.8/−7.5 | |
| Inter-run mean (n = 18) | 0.0197/0.081 | 0.704/2.55 | 2.18/8.62 | 3.37/13.60 | |
| Inter-run precision (%CV) | 3.2/3.6 | 2.7/1.5 | 1.8/1.4 | 2.4/1.2 | |
| Inter-run accuracy (%RE) | −1.6/1.3 | 0.2/−0.4 | −0.8/0.7 | −8.9/−6.8 | |
Accuracy and precision
The accuracy and precision of the method were assessed by analyzing QC samples along with a calibration curve on three different days. The calibration curve consisted of eight standards of different concentrations, each in duplicate, ranging from 0.02 to 6 μg/mL of Cer(22:0) and 0.08 to 24 μg/mL of Cer(24:0). Excellent results were obtained for the calibration curves, as the deviations of the back-calculated concentrations from their nominal values were within 15 % for all the calibration standards in the three days of validation. All the QC samples were prepared in human plasma, and the endogenous levels of Cer(22:0) and Cer(24:0) were determined by mean of multiple replicates (n=12). The endogenous levels were used to calculate the nominal concentrations of the spiked (MQC and HQC) and dilution QC (DQC). The DQC was diluted 5 times with 0.5% BSA solution before extraction, and followed the procedure for other samples. The results of the QC samples in the three validation runs and dilution integration are shown in Table 2 and 3, respectively. The analysis of the plasma-based QC samples demonstrated acceptable precision and accuracy based on the preset validation criteria of ±15%CV and 15%RE.
Table 3.
Five-fold dilution integration of Cer(22:0) and Cer(24:0)
| Nominal concentration (g/mL) | Cer(22:0) | Cer(24:0) |
|---|---|---|
| 6.70 | 26.6 | |
| Mean (n= 3) | 6.55 | 26.0 |
| Precision (%CV) | 2.2 | 0.4 |
| Accuracy (%RE) | −2.2 | −2.1 |
Carryover
To evaluate carryover, a blank sample was immediately injected following the highest standard (4/16 μg/mL of Cer(22:0)/Cer(24:0)). No carryovers were observed in the regions of interest.
Stability
Stability of the Cer(22:0) and Cer(24:0) in the human plasma was evaluated under a variety of conditions to establish length of storage and sample processing conditions (see Electronic Supplementary Material Table S4). The bench-top stability study showed that the Cer(22:0) and Cer(24:0) were stable in human plasma for 14 hours at room temperature. The stability of Cer(22:0) and Cer(24:0) were determined to be acceptable in human plasma following five freeze–thaw cycles. For processed samples (autosampler stability), the Cer(22:0) and Cer(24:0) were stable for 3 days at room temperature. The Cer(22:0) and Cer(24:0) were determined to be stable for 38 days at −80 °C.
The Cer(22:0) and Cer(24:0) in standard curve matrix and stock solution were stable for 4 hours at room temperature and for 38 days at −80 °C (see Electronic Supplementary Material Table S5).
Application
Insulin resistance is a key feature of type 2 diabetes, and numerous studies in both culture and animal models demonstrate that there is a strong association between increasing ceramide levels and defective insulin action in target tissues, especially skeletal muscle and liver [35,36,10,37,38]. The improvements in insulin sensitivity via exercise training in obese patients are associated with significant reductions in intramyocellular ceramide levels [24,39]. The very long acyl chain ceramide assay was used to quantify Cer(22:0) and Cer (24:0) in human plasma samples from five control, five obese and four type 2 diabetic women. As shown in Fig. 3, levels of Cer(22:0) and Cer(24:0) concentrations were significantly elevated in type 2 diabetics compared to controls. There was no difference between obese and diabetic subjects. Although levels trended higher in obese than in controls, this did not meet statistical significance in this small sample size. The ~2.5 fold higher concentration of Cer(24:0) compared to the Cer(22:0) in plasma was noted and also reported by another group [7]. Plasma ceramide is most likely synthesized in the liver by ceramide synthases (CerS) from sphinganine and acyl coenzyme A (CoA), incorporated into lipoproteins and transported into the plasma. In certain conditions, it may also be formed in the arterial wall from sphingomyelin by the sphingomyelinase [40]. So far, six different mammalian CerS (CerS1–6) have been described. They differ in their tissue specific expression pattern and in their substrate specificity resulting in the production of ceramides with different N-acyl side chains (Cer(14:0) - Cer(26:0)). The CerS2 and CerS4 are responsible for production of Cer(22:0) and Cer(24:0) [41]. The CerS2 and CerS4 in liver probably have more specificity toward 24:0 acyl-CoA than 22:0 acyl-CoA.
Fig. 3.
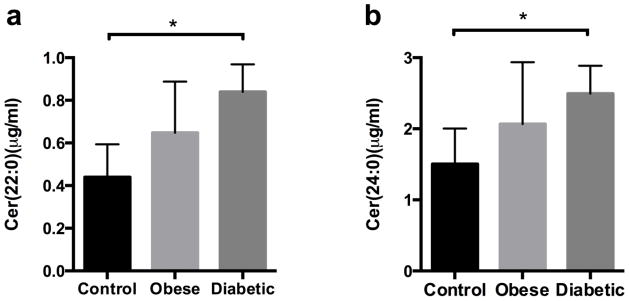
Measurement of Cer(22:0) and Cer(24:0) in human plasma. Plasma Cer(22:0) (a) and Cer(24:0) (b) were determined in two fasting samples obtained two weeks apart from each of 14 human subjects (control, n = 5; obese, n = 5; and diabetic, n = 4). Data is presented as mean ± SEM. *, p <0.05 for diabetes vs. controls
Conclusions
In addition to their potential utility as biomarkers for type 2 diabetes, plasma concentrations of Cer(22:0) and Cer(24:0) in plasma are also associated with mild cognitive impairment [42], and may be early indicators of Alzheimer’s disease progression. We have developed a rapid LC/MS/MS method for quantification of Cer(22:0) and Cer(24:0) in human plasma. The simplicity of the technique (protein precipitation) and its high selectivity for Cer(22:0) and Cer(24:0) renders this method particularly attractive. The assay exhibits a high degree of sensitivity, precision, and accuracy, and is ready to apply to measurement of Cer(22:0) and Cer(24:0) in clinical samples.
Supplementary Material
Acknowledgments
The authors thank Professor Douglas Covey for providing laboratory equipment and space for chemical synthesis, and Sarah Gale for assistance in preparation of figures. This work was performed in the Metabolomics Facility at Washington University (P60 DK020579) and was supported by NIH grantsR01 HL096461 (J.E.S and D.S.O.) and P20 HL113444 (J.E.S.).
Nonstandard abbreviations
- BSA
bovine serum albumin
- Cer(22:0)
N-(docosanoyl)-sphing-4-enine
- Cer(24:0)
N-(tetracosanoyl)-sphing-4-enine
- ([2H4]Cer(22:0)
N-13,13,14,14-[2H4] (docosanoyl)-sphing-4-enine
- [2H4]Cer(24:0)
N-15,15,16,16-[2H4] (tetracosanoyl)-sphing-4-enine
- CerS
ceramide synthases
- CoA
coenzyme A
- CV
coefficient of variance
- DQC
dilution quality control
- ESI
electrospray ionization
- FDA
Food and Drug Administration
- HPLC
high performance liquid chromatography
- LC-MS/MS
liquid chromatography–tandem mass spectrometry
- LLE
liquid-liquid extraction
- LLOQ
lower limit of quantification
- LQC
low quality control
- MQC
medium quality control
- HQC
high quality control
- MRM
multiple reaction monitoring
- PPT
protein precipitation
- QC
quality control
- S.D
standard deviation
- RE
relative error
- SPE
solid-phase extraction
- TLC
thin layer chromatography
- ULOQ
upper limit of quantification
References
- 1.Kitatani K, Idkowiak-Baldys J, Hannun YA. The sphingolipid salvage pathway in ceramide metabolism and signaling. Cell Signal. 2008;20:1010–1018. doi: 10.1016/j.cellsig.2007.12.006. [DOI] [PMC free article] [PubMed] [Google Scholar]
- 2.Grassme H, Riethmuller J, Gulbins E. Biological aspects of ceramide-enriched membrane domains. Prog Lipid Res. 2007;46:161–170. doi: 10.1016/j.plipres.2007.03.002. [DOI] [PubMed] [Google Scholar]
- 3.Nikolova-Karakashian MN, Rozenova KA. Ceramide in stress response. Adv Exp Med Biol. 2010;688:86–108. doi: 10.1007/978-1-4419-6741-1_6. [DOI] [PMC free article] [PubMed] [Google Scholar]
- 4.Arana L, Gangoiti P, Ouro A, Trueba M, Gomez-Munoz A. Ceramide and ceramide 1-phosphate in health and disease. Lipids Health Dis. 2010;9:15. doi: 10.1186/1476-511X-9-15. [DOI] [PMC free article] [PubMed] [Google Scholar]
- 5.Ben-David O, Futerman AH. The role of the ceramide acyl chain length in neurodegeneration: involvement of ceramide synthases. Neuromolecular Med. 2010;12:341–350. doi: 10.1007/s12017-010-8114-x. [DOI] [PubMed] [Google Scholar]
- 6.Krivit W, Hammarstrom S. Identification and quantitation of free ceramides in human platelets. J Lipid Res. 1972;13:525–530. [PubMed] [Google Scholar]
- 7.Quehenberger O, Armando AM, Brown AH, Milne SB, Myers DS, Merrill AH, Bandyopadhyay S, Jones KN, Kelly S, Shaner RL, Sullards CM, Wang E, Murphy RC, Barkley RM, Leiker TJ, Raetz CR, Guan Z, Laird GM, Six DA, Russell DW, McDonald JG, Subramaniam S, Fahy E, Dennis EA. Lipidomics reveals a remarkable diversity of lipids in human plasma. J Lipid Res. 2010;51:3299–3305. doi: 10.1194/jlr.M009449. [DOI] [PMC free article] [PubMed] [Google Scholar]
- 8.Kolak M, Westerbacka J, Velagapudi VR, Wagsater D, Yetukuri L, Makkonen J, Rissanen A, Hakkinen AM, Lindell M, Bergholm R, Hamsten A, Eriksson P, Fisher RM, Oresic M, Yki-Jarvinen H. Adipose tissue inflammation and increased ceramide content characterize subjects with high liver fat content independent of obesity. Diabetes. 2007;56:1960–1968. doi: 10.2337/db07-0111. [DOI] [PubMed] [Google Scholar]
- 9.Haus JM, Kashyap SR, Kasumov T, Zhang R, Kelly KR, Defronzo RA, Kirwan JP. Plasma ceramides are elevated in obese subjects with type 2 diabetes and correlate with the severity of insulin resistance. Diabetes. 2009;58:337–343. doi: 10.2337/db08-1228. [DOI] [PMC free article] [PubMed] [Google Scholar]
- 10.Holland WL, Brozinick JT, Wang LP, Hawkins ED, Sargent KM, Liu Y, Narra K, Hoehn KL, Knotts TA, Siesky A, Nelson DH, Karathanasis SK, Fontenot GK, Birnbaum MJ, Summers SA. Inhibition of ceramide synthesis ameliorates glucocorticoid-, saturated-fat-, and obesity-induced insulin resistance. Cell Metab. 2007;5:167–179. doi: 10.1016/j.cmet.2007.01.002. [DOI] [PubMed] [Google Scholar]
- 11.Olivier S, Fillet M, Malaise M, Piette J, Bours V, Merville MP, Franchimont N. Sodium nitroprusside-induced osteoblast apoptosis is mediated by long chain ceramide and is decreased by raloxifene. Biochem Pharmacol. 2005;69:891–901. doi: 10.1016/j.bcp.2004.11.030. [DOI] [PubMed] [Google Scholar]
- 12.Haynes CA, Allegood JC, Park H, Sullards MC. Sphingolipidomics: methods for the comprehensive analysis of sphingolipids. J Chromatogr B Analyt Technol Biomed Life Sci. 2009;877:2696–2708. doi: 10.1016/j.jchromb.2008.12.057. [DOI] [PMC free article] [PubMed] [Google Scholar]
- 13.He X, Dagan A, Gatt S, Schuchman EH. Simultaneous quantitative analysis of ceramide and sphingosine in mouse blood by naphthalene-2,3-dicarboxyaldehyde derivatization after hydrolysis with ceramidase. Anal Biochem. 2005;340:113–122. doi: 10.1016/j.ab.2005.01.058. [DOI] [PubMed] [Google Scholar]
- 14.Kindt E, Wetterau J, Mueller SB, Castle C, Boustany-Kari CM. Quantitative sphingosine measurement as a surrogate for total ceramide concentration-preclinical and potential translational applications. Biomed Chromatogr. 2010;24:752–758. doi: 10.1002/bmc.1359. [DOI] [PubMed] [Google Scholar]
- 15.Yoo HH, Son J, Kim DH. Liquid chromatography-tandem mass spectrometric determination of ceramides and related lipid species in cellular extracts. J Chromatogr B Analyt Technol Biomed Life Sci. 2006;843:327–333. doi: 10.1016/j.jchromb.2006.06.025. [DOI] [PubMed] [Google Scholar]
- 16.Merrill AH, Jr, Sullards MC, Allegood JC, Kelly S, Wang E. Sphingolipidomics: high-throughput, structure-specific, and quantitative analysis of sphingolipids by liquid chromatography tandem mass spectrometry. Methods. 2005;36:207–224. doi: 10.1016/j.ymeth.2005.01.009. [DOI] [PubMed] [Google Scholar]
- 17.Farwanah H, Kolter T, Sandhoff K. Mass spectrometric analysis of neutral sphingolipids: methods, applications, and limitations. Biochim Biophys Acta. 2011;1811:854–860. doi: 10.1016/j.bbalip.2011.05.011. [DOI] [PubMed] [Google Scholar]
- 18.Tserng KY, Griffin R. Quantitation and molecular species determination of diacylglycerols, phosphatidylcholines, ceramides, and sphingomyelins with gas chromatography. Anal Biochem. 2003;323:84–93. doi: 10.1016/j.ab.2003.08.026. [DOI] [PubMed] [Google Scholar]
- 19.Vieu C, Terce F, Chevy F, Rolland C, Barbaras R, Chap H, Wolf C, Perret B, Collet X. Coupled assay of sphingomyelin and ceramide molecular species by gas liquid chromatography. J Lipid Res. 2002;43:510–522. [PubMed] [Google Scholar]
- 20.Yamane M. Simultaneous quantitative determination method for ceramide species from crude cellular extracts by high-performance liquid chromatography-thermospray mass spectrometry. J Chromatogr B Analyt Technol Biomed Life Sci. 2003;783:181–190. doi: 10.1016/s1570-0232(02)00637-2. [DOI] [PubMed] [Google Scholar]
- 21.Bielawski J, Szulc ZM, Hannun YA, Bielawska A. Simultaneous quantitative analysis of bioactive sphingolipids by high-performance liquid chromatography-tandem mass spectrometry. Methods. 2006;39:82–91. doi: 10.1016/j.ymeth.2006.05.004. [DOI] [PubMed] [Google Scholar]
- 22.Han X. Characterization and direct quantitation of ceramide molecular species from lipid extracts of biological samples by electrospray ionization tandem mass spectrometry. Anal Biochem. 2002;302:199–212. doi: 10.1006/abio.2001.5536. [DOI] [PubMed] [Google Scholar]
- 23.Samuelsson K, Sameulsson B. Gas chromatographic and mass spectrometric studies of synthetic and naturally occurring ceramides. Chem Phys Lipids. 1970;5:44–79. doi: 10.1016/0009-3084(70)90009-5. [DOI] [PubMed] [Google Scholar]
- 24.Bruce CR, Thrush AB, Mertz VA, Bezaire V, Chabowski A, Heigenhauser GJ, Dyck DJ. Endurance training in obese humans improves glucose tolerance and mitochondrial fatty acid oxidation and alters muscle lipid content. Am J Physiol Endocrinol Metab. 2006;291:E99–E107. doi: 10.1152/ajpendo.00587.2005. [DOI] [PubMed] [Google Scholar]
- 25.Cowart LA, Szulc Z, Bielawska A, Hannun YA. Structural determinants of sphingolipid recognition by commercially available anti-ceramide antibodies. J Lipid Res. 2002;43:2042–2048. doi: 10.1194/jlr.m200241-jlr200. [DOI] [PubMed] [Google Scholar]
- 26.Summers SA. Ceramides in insulin resistance and lipotoxicity. Prog Lipid Res. 2006;45:42–72. doi: 10.1016/j.plipres.2005.11.002. [DOI] [PubMed] [Google Scholar]
- 27.US Department of Health and Human Services, Food and Drug Administration, Center for Drug Evaluation and Research and Center for Veterinary Medicine. [Accessed 6 May 2013];Guidance for Industry: Bioanalytical Method Validations. 2001 http://www.fda.gov/downloads/Drugs/Guidances/ucm070107.pdf.
- 28.Lee JW, Devanarayan V, Barrett YC, Weiner R, Allinson J, Fountain S, Keller S, Weinryb I, Green M, Duan L, Rogers JA, Millham R, O’Brien PJ, Sailstad J, Khan M, Ray C, Wagner JA. Fit-for-purpose method development and validation for successful biomarker measurement. Pharm Res. 2006;23:312–328. doi: 10.1007/s11095-005-9045-3. [DOI] [PubMed] [Google Scholar]
- 29.Lee JW, Weiner RS, Sailstad JM, Bowsher RR, Knuth DW, O’Brien PJ, Fourcroy JL, Dixit R, Pandite L, Pietrusko RG, Soares HD, Quarmby V, Vesterqvist OL, Potter DM, Witliff JL, Fritche HA, O’Leary T, Perlee L, Kadam S, Wagner JA. Method validation and measurement of biomarkers in nonclinical and clinical samples in drug development: a conference report. Pharm Res. 2005;22:499–511. doi: 10.1007/s11095-005-2495-9. [DOI] [PubMed] [Google Scholar]
- 30.Kaufmann A, Butcher P, Maden K, Widmer M, Giles K, Uria D. Are liquid chromatography/electrospray tandem quadrupole fragmentation ratios unequivocal confirmation criteria? Rapid Commun Mass Spectrom. 2009;23:985–998. doi: 10.1002/rcm.3959. [DOI] [PubMed] [Google Scholar]
- 31.Liebisch G, Drobnik W, Reil M, Trumbach B, Arnecke R, Olgemoller B, Roscher A, Schmitz G. Quantitative measurement of different ceramide species from crude cellular extracts by electrospray ionization tandem mass spectrometry (ESI-MS/MS) J Lipid Res. 1999;40:1539–1546. [PubMed] [Google Scholar]
- 32.Viswanathan CT, Bansal S, Booth B, DeStefano AJ, Rose MJ, Sailstad J, Shah VP, Skelly JP, Swann PG, Weiner R. Quantitative bioanalytical methods validation and implementation: best practices for chromatographic and ligand binding assays. Pharm Res. 2007;24:1962–1973. doi: 10.1007/s11095-007-9291-7. [DOI] [PubMed] [Google Scholar]
- 33.Kushnir MM, Rockwood AL, Nelson GJ, Yue B, Urry FM. Assessing analytical specificity in quantitative analysis using tandem mass spectrometry. Clin Biochem. 2005;38:319–327. doi: 10.1016/j.clinbiochem.2004.12.003. [DOI] [PubMed] [Google Scholar]
- 34.Vogeser M, Seger C. Pitfalls associated with the use of liquid chromatography-tandem mass spectrometry in the clinical laboratory. Clin Chem. 2010;56:1234–1244. doi: 10.1373/clinchem.2009.138602. [DOI] [PubMed] [Google Scholar]
- 35.Liu L, Zhang Y, Chen N, Shi X, Tsang B, Yu YH. Upregulation of myocellular DGAT1 augments triglyceride synthesis in skeletal muscle and protects against fat-induced insulin resistance. J Clin Invest. 2007;117:1679–1689. doi: 10.1172/JCI30565. [DOI] [PMC free article] [PubMed] [Google Scholar]
- 36.Pickersgill L, Litherland GJ, Greenberg AS, Walker M, Yeaman SJ. Key role for ceramides in mediating insulin resistance in human muscle cells. J Biol Chem. 2007;282:12583–12589. doi: 10.1074/jbc.M611157200. [DOI] [PubMed] [Google Scholar]
- 37.Powell DJ, Turban S, Gray A, Hajduch E, Hundal HS. Intracellular ceramide synthesis and protein kinase Czeta activation play an essential role in palmitate-induced insulin resistance in rat L6 skeletal muscle cells. Biochem J. 2004;382:619–629. doi: 10.1042/BJ20040139. [DOI] [PMC free article] [PubMed] [Google Scholar]
- 38.Ussher JR, Koves TR, Cadete VJ, Zhang L, Jaswal JS, Swyrd SJ, Lopaschuk DG, Proctor SD, Keung W, Muoio DM, Lopaschuk GD. Inhibition of de novo ceramide synthesis reverses diet-induced insulin resistance and enhances whole-body oxygen consumption. Diabetes. 2010;59:2453–2464. doi: 10.2337/db09-1293. [DOI] [PMC free article] [PubMed] [Google Scholar]
- 39.Dube JJ, Amati F, Stefanovic-Racic M, Toledo FG, Sauers SE, Goodpaster BH. Exercise-induced alterations in intramyocellular lipids and insulin resistance: the athlete’s paradox revisited. Am J Physiol Endocrinol Metab. 2008;294:E882–888. doi: 10.1152/ajpendo.00769.2007. [DOI] [PMC free article] [PubMed] [Google Scholar]
- 40.Gorska M, Dobrzyn A, Zendzian-Piotrowska M, Namiot Z. Concentration and composition of free ceramides in human plasma. Horm Metab Res. 2002;34:466–468. doi: 10.1055/s-2002-33597. [DOI] [PubMed] [Google Scholar]
- 41.Hartmann D, Lucks J, Fuchs S, Schiffmann S, Schreiber Y, Ferreiros N, Merkens J, Marschalek R, Geisslinger G, Grosch S. Long chain ceramides and very long chain ceramides have opposite effects on human breast and colon cancer cell growth. Int J Biochem Cell Biol. 2012;44:620–628. doi: 10.1016/j.biocel.2011.12.019. [DOI] [PubMed] [Google Scholar]
- 42.Mielke MM, Haughey NJ, Ratnam Bandaru VV, Schech S, Carrick R, Carlson MC, Mori S, Miller MI, Ceritoglu C, Brown T, Albert M, Lyketsos CG. Plasma ceramides are altered in mild cognitive impairment and predict cognitive decline and hippocampal volume loss. Alzheimers Dement. 2010;6:378–385. doi: 10.1016/j.jalz.2010.03.014. [DOI] [PMC free article] [PubMed] [Google Scholar]
Associated Data
This section collects any data citations, data availability statements, or supplementary materials included in this article.