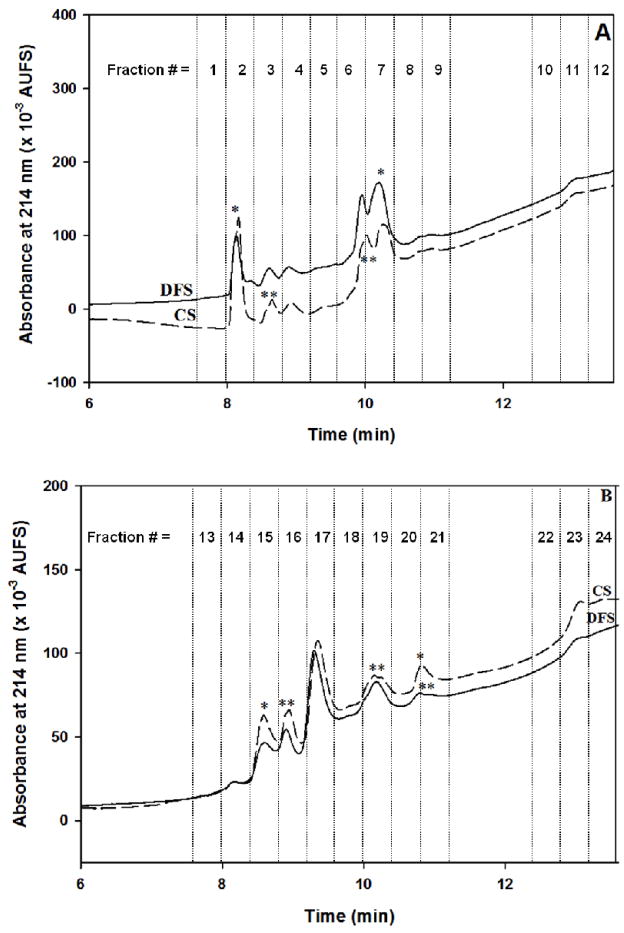
Figure 8.
Comparison of chromatograms of the RPC fractionation of proteins captured by the LTA column (in A) and AAL column (in B) from disease-free (DFS) and breast cancer sera (CS). Experimental conditions for RPC fractionation are the same as in Fig. 3.

