Abstract
We present a microfluidic approach for single-molecule studies of the temperature-dependent behavior of biomolecules, using a platform that combines microfluidic sample handling, on-chip temperature control, and total internal reflection fluorescence (TIRF) microscopy of surface-immobilized biomolecules. With efficient, rapid, and uniform heating by microheaters and in situ temperature measurements within a microfluidic flowcell by micro temperature sensors, closed-loop, accurate temperature control is achieved. To demonstrate its utility, the temperature-controlled microfluidic flowcell is coupled to a prism-based TIRF microscope and is used to investigate the temperature-dependence of ribosome and transfer RNA (tRNA) structural dynamics that are required for the rapid and precise translocation of tRNAs through the ribosome during protein synthesis. Our studies reveal that the previously characterized, thermally activated transitions between two global conformational states of the pre-translocation (PRE) ribosomal complex persist at physiological temperature. In addition, the temperature-dependence of the rates of transition between these two global conformational states of the PRE complex reveal well-defined, measurable, and disproportionate effects, providing a robust experimental framework for investigating the thermodynamic activation parameters that underlie transitions across these barriers.
Keywords: microfluidics, optical microscopy, ribosome, single-molecule studies, temperature dependence
1. Introduction
Single-molecule studies of biochemical systems, in contrast to ensemble measurements, involve direct observation and analysis of individual biomolecules, allowing access to mechanistic information that is often obscured in ensemble measurements. Contemporary single-molecule studies have benefitted greatly from the development of advanced detection techniques. In particular, the advent of single-molecule fluorescent microscopies1 and spectroscopies2, based on sensitive optical probes3, have proved highly effective at providing molecular structural and functional information at the single-molecule level. Building on these advances, single-molecule studies of a wide range of biochemical systems have led to significant advances in the mechanistic understanding of such systems4-10.
Biological processes generally exhibit strong temperature dependencies, and an ability to perform single-molecule measurements as a function of well-defined temperature changes can reveal mechanistically important details regarding the energetics of biomolecular behavior. However, measurement of the temperature-dependence of single-biomolecular behavior remains a major challenge11. Conventionally, temperature control in single-molecule investigations is achieved by maintaining the entire physical space in which the experiment is performed at a suitable temperature12. This is impractical for experiments at temperatures considerably higher than room temperature. Alternatively, external heating and temperature sensing modules can be included in the single-molecule setup13, 14, but generally involve heating of large thermal masses and rely on temperature sensing in regions far removed from the single molecules under investigation, and are hence cumbersome, slow, and relatively inaccurate15, 16. These limitations in temperature control are a major hindrance to fully harnessing the power of single-molecule investigations.
Microfluidic technology can greatly facilitate single-molecule experiments by providing on-chip fluid handling with drastically reduced sample consumption, and more importantly, well-controlled micro- or nanoscale environments in which biomolecules are effectively manipulated and analyzed. A variety of microfluidic devices have been created for such applications17. For example, rapid single-molecule bioassays have been performed in microchannels in combination with microscopic techniques such as total internal reflection fluorescence (TIRF) microscopy18. These microscopy-based microfluidic systems have facilitated studies including the hybridization DNA probes to surface-immobilized DNA targets19 and the kinetics of chromatin assembly on individual DNA molecules20. In addition, microfabricated submicron-sized channels21, molecular-confinement microfluidic reactors22, microcavities23, and microelectrodes24 have all been incorporated into microfluidic devices in order to provide controlled experimental conditions for various biological studies at the single-molecule level. Despite the insights that have been gleaned through the use of the microfluidic tools described above, the influence of temperature on individual biomolecular behavior remains poorly characterized due to the lack of accurate temperature control within single-molecule detection systems. For example, a microfluidic device uses a circulating water bath and no temperature sensing in the detection channels25; this open-loop temperature control strategy however does not allow adequate accuracy and is rather cumbersome in operation, in particular during the transition between temperature setpoints.
Microfabricated thin-film heaters and temperature sensors for efficient on-chip temperature control26 have been widely used in microfluidic devices such as polymerase chain reaction (PCR) platforms27. However, such thermal elements have not yet been successfully incorporated into single-molecule fluorescence microscopy systems for studies of temperature dependent properties of single biomolecules. Indeed, existing microfluidic on-chip temperature control configurations encompass several shortcomings that make them poorly suited for integration into existing single-molecule fluorescence microscopy systems. For example, non-uniform temperature distributions arising from localized heating (typical characteristic of on-chip temperature control configurations) are a critical issue that could make the controlled temperatures within the detection area inaccurate. Moreover, non-uniform temperature distributions could introduce heterogeneity across the individual molecules being observed, resulting in a shifted and/or broader distribution of transition parameters obtained at a particular temperature setpoint, possibly complicating data analysis. In addition, the majority of existing microfluidic on-chip temperature control configurations is incompatible with single-molecule fluorescence microscopy systems by obstructing the required optical path. Finally, thermally induced defocusing arising from heat transfer to the microscope objective during the heating-enabled observation period is a significant issue that remains unaddressed in the design of currently available microfluidic on-chip temperature control configurations.
Herein we report a microfluidic approach that overcomes the limitations of existing on-chip temperature control configurations and successfully integrates facile and accurate on-chip temperature control within a standard TIRF microscopy system. As TIRF has emerged as a prominent method for single-molecule studies (because of its high sensitivity and signal-to-noise ratio as well as wide-field detection capabilities28), this approach provides a platform which readily enables studies of the temperature-dependence of a wide range of biomolecular activity with single-molecule resolution. The approach employs closed-loop temperature control via on-chip heating and in situ temperature sensing of a minimized biological sample volume. To meet the requirements of single-molecule measurement resolution, microheaters are placed on either side of a microchannel, and temperature sensors with sufficiently small footprints are located in the center of the microchannel. This configuration ensures that the region of the chip heated by the microheaters is much larger than the TIRF microscopy detection volume, thus eliminating non-uniform temperature distributions within the detection volume. Moreover, the placement of microheaters on either side of a microchannel on a glass substrate allows for an adequately large and optically transparent observation area that is fully compatible with TIRF microscopy and ensures that temperature gradients primarily occur within the depth of the microchannel, such that the conduction of heat through the glass substrate to the in-contact microscope objective is negligible. Our approach therefore provides a low-cost and compact experimental platform that can be directly used for TIRF microscopy-based, temperature-dependent, single-molecule investigations, eliminating the need to control the temperature of the entire setup or the physical space in which the experiment is performed.
We demonstrate the utility of our approach by performing a temperature-dependent, single-molecule fluorescence resonance energy transfer (FRET) study of the ribosome, the biomolecular machine that is responsible for protein synthesis, or translation, in all living cells29-31. Because the efficiency of FRET depends on the distance between donor and acceptor fluorophores (typically engineered into the biomolecule of interest), single-molecule FRET (smFRET) experiments provide a powerful tool for investigating the conformational dynamics of biomolecules6, 32. Previously, we have developed and used a smFRET signal between the ribosome and a ribosome-bound transfer RNA (tRNA) substrate to investigate the mechanism through which the ribosome achieves the rapid and precise translocation of tRNAs through multiple ribosomal binding sites that is required during protein synthesis31. These previous smFRET studies, all performed at room temperature, have demonstrated that pre-translocation (PRE) ribosome-tRNA complexes undergo spontaneous and thermally activated fluctuations between two discrete and structurally well-characterized global conformational states, termed global state 1 (GS1) and global state 2 (GS2). Because GS2 is an authentic on-pathway intermediate in the translocation reaction33-35, thermally activated fluctuations between GS1 and GS2 may play a critical role in the translocation mechanism. Lacking smFRET data recorded at physiological temperature (37 °C for the Escherichia coli system under investigation here), however, it is presently unknown whether the kinetic barriers associated with GS1→GS2 and GS2→GS1 transitions persist in vivo. Here we unambiguously demonstrate that at the physiologically relevant temperature of 37 °C, PRE complexes continue to spontaneously fluctuate between GS1 and GS2. This observation demonstrates that under physiologically relevant conditions, the free-energy landscape of the PRE complex is not entirely flat and that functionally critical GS1→GS2 and GS2→GS1 transitions require overcoming measureable kinetic barriers. More importantly, extension of the proof-of-principle experiments reported here will readily allow detailed investigations of the thermodynamic activation parameters that govern this essential structural rearrangement of the translating ribosome. More generally, the results we present here demonstrate the potential of our approach for studying the energetics of biomolecular structural dynamics and biochemical reactions at the single-molecule level, thus expanding the toolkit that is available for mechanistic studies of Nature’s molecular machines.
2. Design and Experimental
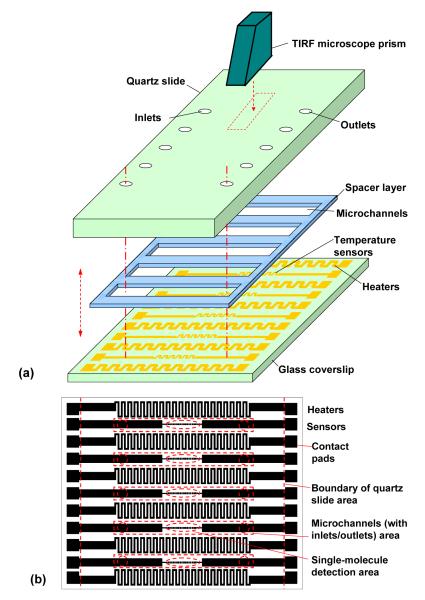
Our microfluidic approach couples a temperature-controlled microfluidic flowcell to a prism-based TIRF microscope. The microfluidic flowcell comprises a set of parallel microchannels sandwiched between a quartz microscope slide and a glass coverslip, onto which thermal control elements are integrated (Figure 1a). The microchannels have cross-sectional dimensions of approximately 1 mm × 80 μm and are 20 mm in length. The centerlines of adjacent channels are separated by a distance of 4.3 mm. The thermal control elements on the coverslip surface include thin-film resistive microheaters and temperature sensors (Figure 1b). In accordance with the confinement of parallel microchannels, the microheaters are distributed evenly across the entire coverslip in order to provide uniform heating, while the sensors are located directly underneath the microchannels to accurately probe the surface temperature in real time. Each heater is a serpentine line 200 μm wide, covering a 20 mm × 2 mm square area next to the channel area, and typically has an electric resistance of approximately 200 Ω at room temperature. Each temperature sensor is also a serpentine line located at the center of the corresponding channel area, with an approximate coverage area of 5 mm × 120 μm and a typical electric resistance of approximately 120 Ω at room temperature. This design affords a relatively uniform temperature distribution within each microchannel, whose small depth (80 μm) allows the temperature of the fluorescent detection area on the quartz slide to be measured by the temperature sensor on the glass coverslip with acceptable accuracy.
Figure 1.
Design schematic of the microfluidic approach to temperature-controlled single-molecule studies. (a) A temperature-controlled microfluidic flow cell coupled to a prism-based TIRF microscope. (b) Design layout of microheaters and temperature sensors on the coverslip.
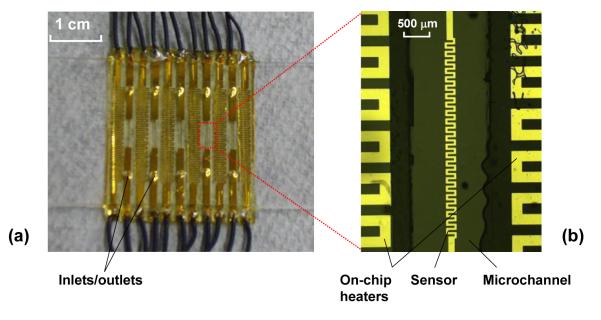
The chromium/gold thin-film heaters and temperature sensors on the coverslip are fabricated using a standard lift-off process and are subsequently passivated by deposition of a silicon nitride layer using plasma enhanced chemical vapor deposition (PECVD) (see Supplementary Information). The quartz microscope slide, containing pre-drilled inlet and outlet ports, is passivated and functionalized using a combination of polyethylene glycol (PEG) and biotinylated PEG to enable specific surface immobilization of biotinylated biomolecules through a biotin-streptavidin-biotin bridge as described elsewhere29, 31, 36 (see Supplementary Information). The microfabricated coverslip is bonded to the passivated and functionalized quartz slide using a spacer layer of double-sided tape (approximately 80 μm thick) that defines the microchannels. Multiple parallel channels are incorporated to allow several biochemical experiments to be performed on one microfluidic chip. A packaged device with five microchannels is shown in Figure 2a with the details of the chip near the detection area shown in Figure 2b.
Figure 2.
(a) Photograph of a packaged device; and (b) micrograph of micro-heaters and a temperature sensor.
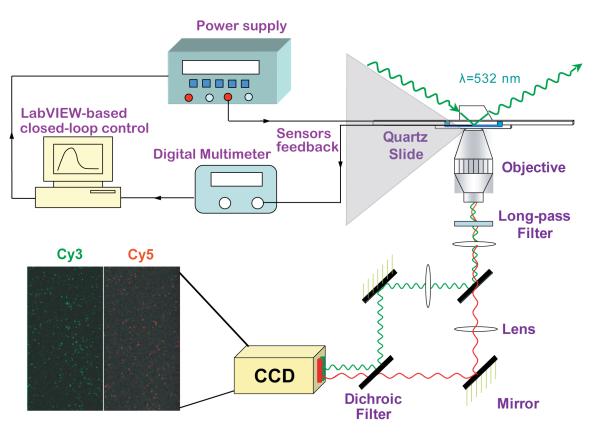
In TIRF microscopy, a thin (100-200 nm) electromagnetic evanescent field is generated by total internal reflection at the interface between the quartz slide and the aqueous buffer within the flowcell, yielding highly specific excitation of donor fluorophores that are covalently linked, or otherwise bound, to surface-immobilized biomolecules29, 31 (Supplementary Information). Fluorescence emission from both donor and acceptor fluorophores within individual spatially separated and localized molecules are collected through a 1.2 numerical aperture/×60 water-immersion objective (Nikon, Inc.), separated by a Dual-View image splitting device (Photometrics, Inc.), and imaged onto the two halves of the CCD chip within a Cascade II:512B electron multiplying charge-coupled device (EMCCD) camera (Photometrics, Inc.) (Figure 3 and Supplementary Information). The temperature inside a microchannel selected for single-molecule measurements (below) was maintained at a desired setpoint using a closed-loop control of the on-chip heaters and temperature sensors. As shown in Figure 3, the two heaters immediately adjacent to the microchannel, driven by a DC power supply (Agilent E3631), were used to heat the microchannel. The microchannel temperature was measured using the temperature sensor within the microchannel by a digital multimeter (Agilent 34420A). The load current in the heaters was adjusted according to the measured temperature using a proportional–integral–derivative (PID) control algorithm implemented by a LabVIEW (NI Instruments) program on a personal computer.
Figure 3.
Single-molecule detection scheme within a prism-based inverted TIRF microscope and closed-loop temperature control utilizing on-chip heaters and temperature sensors.
3. On-Chip Temperature Control
To assess the temperature control capability of our design, including the accuracy of the temperature setpoint and the thermal response of the microfluidic flowcell, we first calibrated the on-chip temperature sensors based on the linear relationship between the sensor resistance and temperature (Supplementary Information) and subsequently characterized the closed-loop temperature control scheme described above. Calibration and characterization of the temperature sensors typically resulted in a temperature coefficient of resistivity (TCR) of approximately 2×10⁻³ 1/°C (see Supplementary Information). Figure 4 reports the temperature tracking history of a testing process in which the temperature inside a microchannel filled with Tris-Polymix buffer29, 31 (Supplementary Information) was controlled at the desired setpoints of 22, 25, 28, 31, 34, and 37 °C. As can be seen from Figure 4, the microchannel temperature could be rapidly increased from one temperature setpoint to another by the PID-based temperature controller with no appreciable overshoot. Thermal equilibrium at each temperature setpoint could be achieved within less than 30 seconds (Figure 4), and the steady-state temperature remained within approximately 0.01 °C of the desired temperature setpoint for periods of up to an hour (Figure 4). These characteristics are considered sufficient for real-time single-molecule fluorescence imaging of biochemical reactions and real-time fluorescence tracking of biomolecules15.
Figure 4.
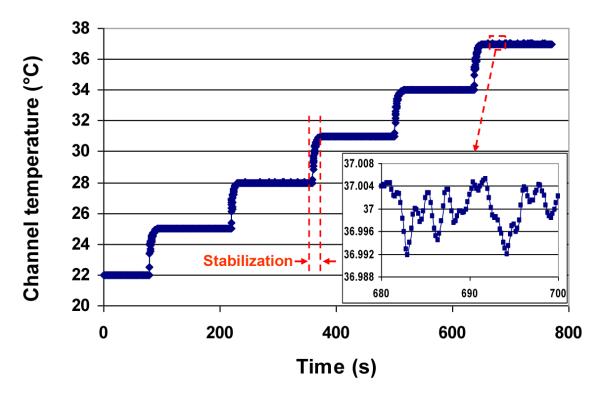
Time-resolved tracking of the temperature inside a microchannel at setpoints of 22, 25, 28, 31, 34, and 37 °C.
The temperature sensor allows measurement of the average temperature in the microchannel, but does not provide information on the temperature distribution within the microchannel. Thus, we have evaluated the uniformity of the temperature within the microchannel, in particular in the finite TIRF measurement volume, using numerical simulation37. The simulation model considers three-dimensional heat conduction in the buffer (thermal conductivity: 0.6 W/m·K) contained in the microchannel, which are formed by the coverslip and quartz substrates (thermal conductivity: 1.4 W/m·K), as well as the double-sided tape spacer layer (Acrylic, thermal conductivity: 0.2 W/m·K). Given the small length scale of the microchannel, natural convection within the liquid buffer is estimated to be negligible. Electric power is applied uniformly to each microheater adjacent to the microchannel. The boundary conditions are given by natural convection on the top and bottom surfaces of the substrates, which are surrounded by air at room temperature (22 °C). The natural convection heat transfer coefficient h is determined by38
| (1) |
where Ts is the average surface temperature (approximately given by the setpoint temperature), and L the characteristic dimension of the quartz slide and the glass coverslip (taken to be 1 cm). In addition, g is the gravitational constant, while k, ν, α, and β are the thermal conductivity, kinematic viscosity, thermal diffusivity, and thermal expansion coefficient of air, respectively, evaluated at the average air film temperature (Ts+T∞)/2. Using the empirical parameter values C = 0.621 and m = 0.2 for the top surface38, and C = 0.495 and m = 0.2 for the bottom surface38, the heat transfer coefficient h is estimated to be 8.83 and 5.65 W/m2·K for the top and bottom surfaces, respectively.
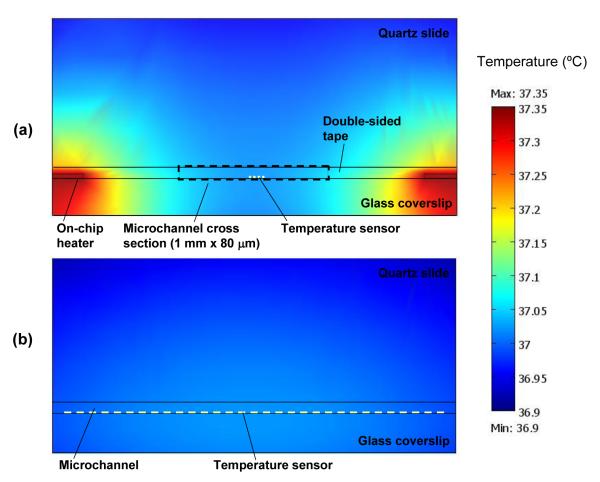
The model is solved with finite element methods using COMSOL Multiphysics (COMSOL, Inc.) to obtain the temperature distributions in the microchannel. As an example, the simulated temperature distributions when the channel is heated to a setpoint temperature of 37 °C are shown in Figure 5. It can be seen that temperature variations within a 1-mm section of the microchannel, corresponding to the area covered by the temperature sensor, are smaller than 0.01 and 0.03 °C, respectively, in directions perpendicular to and along the channel’s longitudinal axis. This suggests that the temperature is sufficiently uniform within the TIRF observation volume within the microchannel and can be accurately obtained from the average temperature measurements by the temperature sensor.
Figure 5.
The simulated temperature distributions when the channel is heated to a setpoint temperature of 37 °C, showing temperature variations within a 1-mm section of the microchannel (corresponding to the area covered by the temperature sensor) are smaller than 0.01 and 0.03 °C, respectively, in directions (a) perpendicular to and (b) along the channel’s longitudinal axis.
4. smFRET Experiments
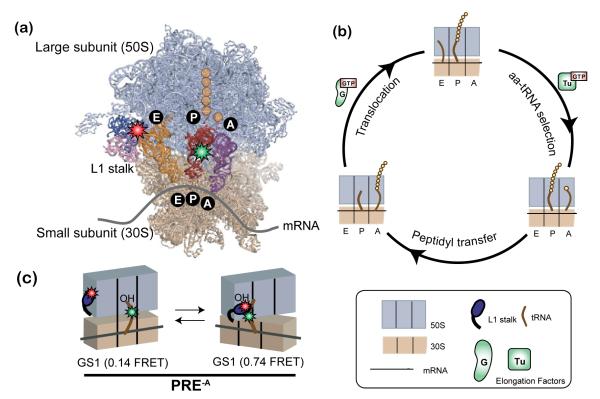
In this section we demonstrate the utility of our microfluidic approach by investigating the temperature dependence of a smFRET signal that reports on the conformational dynamics of the ribosome and its tRNA substrates during protein synthesis, or translation. The ribosome (Figure 6a) is the universally conserved, two-subunit, ribonucleoprotein molecular machine that binds aminoacyl-tRNAs (aa-tRNAs) in the order dictated by the triplet-nucleotide codon sequence of a messenger RNA (mRNA) template and repetitively incorporates each amino acid into the nascent polypeptide chain until the entire mRNA template has been translated into the encoded protein product. As it incorporates each amino acid into the nascent polypeptide chain, the ribosome cycles through three fundamental steps that comprise the translation elongation cycle: (i) aa-tRNA selection and incorporation into the ribosomal aa-tRNA binding site (A site), which is catalyzed by the GTPase elongation factor Tu (EF-Tu), (ii) peptide bond formation and transfer of the nascent polypeptide from the peptidyl-tRNA bound at the ribosomal peptidyl-tRNA binding site (P site) to the newly incorporated A-site aa-tRNA, and (iii) translocation of the ribosome along the mRNA by precisely one codon, catalyzed by the GTPase elongation factor G (EF-G), during which the newly deacylated P site-bound tRNA and newly formed A site-bound peptidyl-tRNA move into the ribosomal deacylated-tRNA binding site (E site) and P site, respectively (Figure 6b).
Figure 6.
Ribosome-catalyzed protein synthesis. (a) X-ray crystallographic structure of the ribosome with its mRNA template and tRNA substrates (PDB ID: 2J00 and 2J01) and our smFRET labeling scheme. The 50S ribosomal subunit is shown in lavender and the 30S ribosomal subunit in tan. The L1 stalk consists of 23S rRNA helices 76-78 (pink) and ribosomal protein L1 (dark blue). There are three tRNA binding sites on the ribosome for aminoacyl-tRNA (A site, purple), peptidyl-tRNA (P site, red), and deacylated-tRNA (E site, orange). Individual amino acids are shown as yellow circles. Our smFRET labeling strategy places a Cy3 donor fluorophore (green star) within the central fold, or elbow, domain of the P-site tRNA and a Cy5 acceptor fluorophore (red star) within the L1 protein of the L1 stalk. (b) The three fundamental steps of the translation elongation cycle: aa-tRNA selection, peptidyl transfer and translocation (see text for more detail). (c) The pre-translocation complex analog (PRE-A) used in our temperature-dependence studies. In the absence of EF-G the PRE-A complex fluctuates between two distinct global conformational states, GS1 and GS2 (see text and Supporting Methods for detailed description).
The movement of tRNAs through the ribosome during translocation requires extensive remodeling of ribosome-tRNA interactions, a multistep process that involves a significant rearrangement of mobile ribosome structural elements as well as the ribosome-bound tRNAs from one structurally well-characterized global conformational state, global state 1 (GS1), to a second structurally well-characterized global conformational state, global state 2 (GS2)34 (Figure 6c). Upon peptidyl transfer and in the absence of EF-G, smFRET experiments recorded at room temperature demonstrate that the pre-translocation (PRE) ribosome-tRNA complex undergoes spontaneous, thermally activated, and reversible transitions between GS1 and GS234, that can be monitored using a previously characterized smFRET signal between an acceptor-labeled ribosome (labeled within the ribosomal L1 stalk) and a donor-labeled P site-bound tRNA31 (Figure 6c). During each GS1→GS2 transition, the interaction between the L1 stalk and the P-site tRNA is established spontaneously as a consequence of tRNA and ribosome structural rearrangements involving a reconfiguration of the tRNA from a so-called “classical” binding configuration on the ribosome into a “hybrid” binding configuration, a “closing” of the L1 stalk into the intersubunit space, and a relative rotation of the ribosomal subunits with respect to each other (see Figure 6c for details on these conformational changes). During each GS2→GS1 transition, all of these structural rearrangements are reversed, resulting in a spontaneous disruption of the L1 stalk-tRNA interaction. Regulation of the GS1 ⇄ GS2 conformational equilibrium by EF-G binding and activity promotes the directional movement of tRNAs through the ribosome during translocation and is thus a critical feature of the translocation mechanism30, 31.
Despite its potentially important role in the mechanism of translocation, the GS1 ⇄ GS2 equilibrium has yet to be fully thermodynamically and kinetically characterized. For example, the temperature dependence of the free-energy landscape that governs the GS1 ⇄ GS2 equilibrium remains completely unexplored. Recent temperature-dependent and time-resolved cryogenic electron microscopic (cryo-EM) reconstructions of post-translocation (POST) ribosomal complexes suggest that the free-energy landscape at the physiologically relevant temperature of 37 °C becomes completely flat, readily permitting POST complexes to sample any of a large number of conformations with roughly equal probability39. Since the ribosome and tRNA dynamics inferred from this cryo-EM study of POST complexes39 involve many of the same ribosome and tRNA dynamics that comprise individual GS1→GS2 and GS2→GS1 transitions within PRE complexes (see below and Figure 6c)40, 41, these cryo-EM results suggest the possibility that at the physiologically relevant temperature of 37 °C, GS1 and GS2 may not represent preferentially populated conformational states of the PRE complex (i.e. wells in the free-energy landscape) that are separated by appreciable kinetic barriers (i.e. peaks in the free-energy landscape). Thus, it remains unclear whether EF-G has to contend with the GS1 and GS2 states of PRE complex and the kinetic barriers separating them during translocation in vivo.
Another example of mechanistically important information that is uniquely available from studies of the temperature dependence of the rates of GS1→GS2 and GS2→GS1 transitions are the thermodynamic activation parameters that characterize the kinetic barriers underlying GS1→GS2 and GS2→GS1 transitions. Using the GS1→GS2 and GS2→GS1 transition rates extracted from smFRET versus time trajectories recorded at a single temperature, the free energies of activation for GS1→GS2 and GS2→GS1 transitions have been calculated for several PRE complexes, as well as for several PRE complex analogs containing a P site-bound deacylated-tRNA but lacking an A site-bound peptidyl-tRNA (PRE-A)29, 42. The lack of smFRET versus time trajectories recorded as a function of temperature, however, has thus far prevented determination of the relative enthalpic and entropic contributions to these free energies of activation. Measurement of the full set of thermodynamic activation parameters (i.e. activation free energy, activation enthalpy, and activation entropy) will reveal the nature of the driving forces underlying GS1→GS2 and GS2→GS1 transitions and will allow investigation of how binding of EF-G to the PRE complex modulates these forces in order to temporarily stabilize GS2 in the early steps of the translocation reaction. Access to this type of mechanistic information is afforded by studies of the temperature-dependence of GS1→GS2 and GS2→GS1 transition rates.
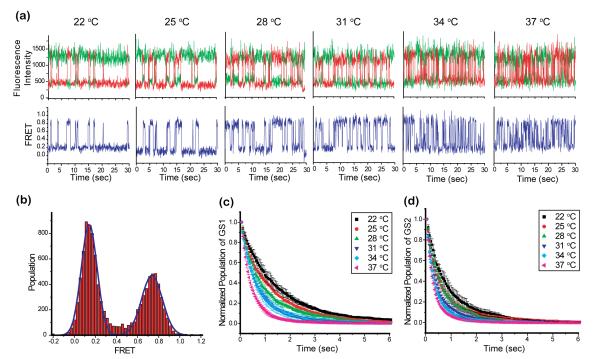
The PRE-A complex used in our temperature-dependence studies carries a deacylated tRNAPhe in the P site and an empty (i.e. tRNA free) A site (see Supplementary Information). Representative donor (Cy3) and acceptor (Cy5) emission intensities versus time trajectories (see Supplementary Information) recorded using this PRE-A complex at temperatures of 22, 25, 28, 31, 34, and 37 °C are shown in Figure 7a. The corresponding smFRET versus time trajectories (see Supplementary Information), calculated as ICy5/(ICy3+ICy5), where ICy3 and ICy5 are the Cy3 and Cy5 emission intensities, respectively, are also shown in Figure 7a. Consistent with previous findings31, 43, the smFRET versus time trajectories fluctuate between two well-defined FRET states centred at FRET efficiencies of 0.14 ± 0.02 and 0.74 ± 0.02, corresponding to the GS1(L1 stalk-tRNA interaction is disrupted) and GS2 (L1 stalk-tRNA interaction is established) states of the PRE-A complex, respectively (Figure 7b). The smFRET versus time trajectories recorded at 37 °C clearly reveal that at this temperature the PRE-A complex continues to fluctuate between two well-defined FRET states centered at FRET values consistent with GS1 and GS2. This observation clearly demonstrates that at the physiologically relevant temperature of 37 °C, GS1 and GS2 continue to define minima in the free-energy landscape and that GS1→GS2 and GS2→GS1 transitions remain separated by appreciable kinetic barriers. Thus, EF-G must contend with these energetic features of the PRE complex during translocation in vivo and these energetic features of the PRE complex present a viable target for regulating translation in vivo, for example using ribosome-targeting small-molecule drugs.
Figure 7.
Temperature-dependent investigation of the GS1 ⇄ GS2 equilibrium obtained using our microfluidic platform in combination with TIRF microscope-based smFRET measurements at controlled temperatures of 22, 25, 28, 31, 34, and 37 °C. (a) Representative Cy3 and Cy5 emission intensities and FRET versus time trajectories. Cy3 and Cy5 emission intensities versus time trajectories are shown in green and red, respectively (top row). The corresponding smFRET versus time trajectories are shown in blue (bottom row) (Supporting Methods). (b) Histogram of idealized FRET values (Supporting Methods) built using the data collected at the 22°C temperature point as an example. Dwell time histograms of (c) GS1 prior to undergoing a GS1→GS2 transition and (d) GS2 prior to undergoing a GS2→GS1 transition at the various temperature points that were investigated (see Supporting Methods).
Comparison of the smFRET versus time trajectories recorded across all measured temperatures clearly demonstrates that the frequencies of both GS1→GS2 and GS2→GS1 transitions increase as a function of increasing temperature (Figure 7a). Consistent with this observation, histograms of the dwell times (see Supplementary Information) spent at GS1 prior to undergoing a GS1→GS2 transition (Figure 7c) or at GS2 prior to undergoing a GS2→GS1 transition (Figure 7d) plotted at the various temperatures reveal that both GS1 and GS2 are destabilized by increasing temperature. Extension of these experiments to PRE-A complexes in the absence versus the presence of EF-G, containing different P site-bound tRNAs, using multiple smFRET labeling schemes, and/or recorded under a variety of buffer conditions should now allow a comprehensive analysis of the thermodynamic activation parameters associated with GS1→GS2 and GS2→GS1 transitions.
5. Conclusion
We have presented a microfluidic approach to investigating the temperature-dependence of single-molecule activity. Our approach utilizes a temperature-controlled microfluidic flowcell coupled to a prism-based TIRF microscope. The temperature-controlled microfluidic flowcell consists of a set of parallel microchannels formed between a quartz slide and a glass coverslip on which thin-film micro-heaters, for efficient and rapid on-chip heating, and temperature sensors, for in situ temperature measurements within the microchannels, are integrated. Closed-loop, accurate temperature control is accomplished by a PID algorithm with the steady-state temperature maintained within approximately ±0.01 °C of the desired setpoints while achieving thermal stability within less than 30 s.
The utility of our microfluidic approach has been demonstrated by its application to the characterization of the temperature dependence of smFRET versus time trajectories reporting on the GS1 ⇄ GS2 equilibrium within a PRE-A ribosomal complex. Analysis of the smFRET versus time trajectories recorded as a function of temperature reveal that the GS1 and GS2 states of PRE complexes represent configurations of the PRE complex that are preferentially populated at the physiologically relevant temperature of 37 °C and that EF-G must contend with the kinetic barriers that govern GS1→GS2 and GS2→GS1 transitions during translocation in vivo. In addition, analysis of the histograms of the dwell times spent in the GS1 or GS2 states prior to undergoing a transition plotted from the smFRET versus time trajectories recorded the various temperatures reveal that the frequencies of both GS1→GS2 and GS2→GS1 transitions increase as a function of increasing temperature and that these effects are driven by corresponding decreases in the stabilities of the GS1 and GS2 states of the PRE-A complex, respectively. These results provide a valuable starting point for the comprehensive analysis of the thermodynamic activation parameters underlying the GS1→GS2 and GS2→GS1 transitions of PRE complexes, as well as the effect of EF-G on these parameters during translocation.
Supplementary Material
Acknowledgements
This work was supported by grants to Q.L. from the National Science Foundation (Grant Nos. DBI-0650020, ECCS-0707748, and CBET-0854030) and by grants to R.L.G. from the National Science Foundation (Grant No. MCB 0644262) and the National Institute of General Medical Sciences (NIH) (Grant No. GM 084288). J.H. was supported, in part, by the Columbia University Summer Undergraduate Research Fellowship (SURF) Program. We would like to acknowledge Ms. Wendy Tse and Mr. Corey Perez for managing the Gonzalez laboratory.
REFERENCES
- 1.Mehta AD, Rief M, Spudich JA, Smith DA, Simmons RM. Science. 1999;283:1689–1695. doi: 10.1126/science.283.5408.1689. [DOI] [PubMed] [Google Scholar]
- 2.Weiss S. Science. 1999;283:1676–1683. doi: 10.1126/science.283.5408.1676. [DOI] [PubMed] [Google Scholar]
- 3.Funatsu T, Harada Y, Tokunaga M, Saito K, Yanagida T. Nature. 1995;374:555–559. doi: 10.1038/374555a0. [DOI] [PubMed] [Google Scholar]
- 4.Borgia A, Williams PM, Clarke J. Annual Review of Biochemistry. 2008;77:101–125. doi: 10.1146/annurev.biochem.77.060706.093102. [DOI] [PubMed] [Google Scholar]
- 5.Greenleaf WJ, Woodside MT, Block SM. Annual Review of Biophysics and Biomolecular Structure. 2007;36:171–190. doi: 10.1146/annurev.biophys.36.101106.101451. [DOI] [PMC free article] [PubMed] [Google Scholar]
- 6.Joo C, Balci H, Ishitsuka Y, Buranachai C, Ha T. Annual Review of Biochemistry. 2008;77:51–76. doi: 10.1146/annurev.biochem.77.070606.101543. [DOI] [PubMed] [Google Scholar]
- 7.Marshall RA, Aitken CE, Dorywalska M, Puglisi j. D. Annual Review of Biochemistry. 2008;77:177–203. doi: 10.1146/annurev.biochem.77.070606.101431. [DOI] [PubMed] [Google Scholar]
- 8.Toprak E, Selvin PR. Annual Review of Biophysics and Biomolecular Structure. 2007;36:349–369. doi: 10.1146/annurev.biophys.36.040306.132700. [DOI] [PubMed] [Google Scholar]
- 9.Xie XS, Choi PJ, Li G-W, Lee NK, Lia G. Annual Review of Biophysics and Biomolecular Structure. 2008;37:417–444. doi: 10.1146/annurev.biophys.37.092607.174640. [DOI] [PubMed] [Google Scholar]
- 10.Zhuang X. Annual Review of Biophysics and Biomolecular Structure. 2005;34:399–414. doi: 10.1146/annurev.biophys.34.040204.144641. [DOI] [PubMed] [Google Scholar]
- 11.Nettels D, Muller-Spath S, Kuster F, Hofmann H, Haenni D, Ruegger S, Reymond L, Hoffmann A, Kubelka J, Heinz B, Gast K, Best RB, Schuler B. PNAS. 2009;106:20740–20745. doi: 10.1073/pnas.0900622106. [DOI] [PMC free article] [PubMed] [Google Scholar]
- 12.Li J, Yeung ES. Analytical Chemistry. 2008;80:8509–8513. doi: 10.1021/ac801365c. [DOI] [PubMed] [Google Scholar]
- 13.Muller CB, Richtering W. Colloid and Polymer Science. 2008;286:1215–1222. [Google Scholar]
- 14.Yang Y, Lin F-C, Yang G. Review of Scientific Instruments. 2006;77:063701. [Google Scholar]
- 15.Enoki S, Watanabe R, Lino R, Noji H. The Journal of Biological Chemistry. 2009;284:23169–23176. doi: 10.1074/jbc.M109.026401. [DOI] [PMC free article] [PubMed] [Google Scholar]
- 16.Sekiya M, Nakamoto RK, Al-Shawi MK, Nakanishi-Matsui M, Futai M. The Journal of Biological Chemistry. 2009;284:22401–22410. doi: 10.1074/jbc.M109.009019. [DOI] [PMC free article] [PubMed] [Google Scholar]
- 17.Dittrich PS, Manz A. Analytical and Bioanalytical Chemistry. 2005;382:1771–1782. doi: 10.1007/s00216-005-3335-9. [DOI] [PubMed] [Google Scholar]
- 18.Le NCH, Yokokawa R, Dao DV, Nguyen TD, Wells JC, Sugiyama S. Lab on a Chip. 2009;9:244–250. doi: 10.1039/b807408a. [DOI] [PubMed] [Google Scholar]
- 19.Hollars CW, Puls J, Bakajin O, Olsan B, Talley CE, Lane SM, Huser T. Analytical and Bioanalytical Chemistry. 2006;385:1384–1388. doi: 10.1007/s00216-006-0561-8. [DOI] [PubMed] [Google Scholar]
- 20.Ladoux B, Quivy J-P, Doyle P, Roure O. d., Almouzni G, Viovy J-L. PNAS. 2000;97:14251–14256. doi: 10.1073/pnas.250471597. [DOI] [PMC free article] [PubMed] [Google Scholar]
- 21.Foquet M, Korlach J, Zipfel W, Webb WW, Craighead HG. Analytical Chemistry. 2002;74:1415–1422. doi: 10.1021/ac011076w. [DOI] [PubMed] [Google Scholar]
- 22.Wang T-H, Peng Y, Zhang C, Wong PK, Ho C-M. Journal of the American Chemical Society. 2005;127:5354–5359. doi: 10.1021/ja042642i. [DOI] [PubMed] [Google Scholar]
- 23.Matsugna T, Hosokawa M, Arakaki A, Taguchi T, Mori T, Tanaka T, Takeyama H. Analytical Chemistry. 2008;80:5139–5145. doi: 10.1021/ac800352j. [DOI] [PubMed] [Google Scholar]
- 24.Namasivayam V, Larson RG, Burke DT, Burns MA. Analytical Chemistry. 2002;74:3378–3385. doi: 10.1021/ac025551h. [DOI] [PubMed] [Google Scholar]
- 25.Vandelinder V, Ferreon ACM, Gambin Y, Deniz AA, Groisman A. Analytical Chemistry. 2009;81:6929–6935. doi: 10.1021/ac901008c. [DOI] [PMC free article] [PubMed] [Google Scholar]
- 26.Arata HF, Rondelez Y, Noji H, Fujita H. Analytical Chemistry. 2005;77:4810–4814. doi: 10.1021/ac050385+. [DOI] [PubMed] [Google Scholar]
- 27.Lagally ET, Medintz I, Mathies RA. Analytical Chemistry. 2001;73:565–570. doi: 10.1021/ac001026b. [DOI] [PubMed] [Google Scholar]
- 28.Cornish PV, Ha T. ACS Chemical Biology. 2007;2:53–61. doi: 10.1021/cb600342a. [DOI] [PubMed] [Google Scholar]
- 29.Blanchard SC, Kim HD, Ruben J, Gonzalez L, Puglisi JD, Chu S. PNAS. 2004;101:12893–12898. doi: 10.1073/pnas.0403884101. [DOI] [PMC free article] [PubMed] [Google Scholar]
- 30.Fei J, Bronson JE, Hofman JM, Srinivas RL, Wiggins CH, Ruben J, Gonzalez L. PNAS. 2009;106:15702–15707. doi: 10.1073/pnas.0908077106. [DOI] [PMC free article] [PubMed] [Google Scholar]
- 31.Fei J, Kosuri P, MacDougall DD, Ruben J, Gonzalez L. Molecular Cell. 2008;30:348–359. doi: 10.1016/j.molcel.2008.03.012. [DOI] [PubMed] [Google Scholar]
- 32.Roy R, Hohng S, Ha T. Nature Methods. 2008;5:507–516. doi: 10.1038/nmeth.1208. [DOI] [PMC free article] [PubMed] [Google Scholar]
- 33.Dorner S, Brunelle JL, Sharma D, Green R. Nature Structural & Molecular Biology. 2006;13:234–241. doi: 10.1038/nsmb1060. [DOI] [PMC free article] [PubMed] [Google Scholar]
- 34.Frank J, Ruben J, Gonzalez L. Annual Review of Biochemistry. 2010;79 doi: 10.1146/annurev-biochem-060408-173330. in press. [DOI] [PMC free article] [PubMed] [Google Scholar]
- 35.Horan LH, Noller HF. PNAS. 2007;104:4881–4885. doi: 10.1073/pnas.0700762104. [DOI] [PMC free article] [PubMed] [Google Scholar]
- 36.Ha T, Rasnik I, Cheng W, Babcock HP, Gauss GH, Lohman TM, Chu S. Nature. 2002;419:638–641. doi: 10.1038/nature01083. [DOI] [PubMed] [Google Scholar]
- 37.Lin Q, Jiang F, Wang X-Q, Xu Y, Han Z, Tai Y-C, Lew J, Ho C-M. Journal of Micromechanics and Microengineering. 2004;14:1640–1649. [Google Scholar]
- 38.Goldstein RJ, Lau K-S. Journal of Fluid Mechanics. 1983;129:55–75. [Google Scholar]
- 39.Fischer N, Konevega AL, Wintermeyer W, Rodnina MV, Stark H. Nature. 2010;466:329–333. doi: 10.1038/nature09206. [DOI] [PubMed] [Google Scholar]
- 40.Agirrezabala X, Lei J, Brunelle JL, Ortiz-Meoz RF, Green R, Frank J. Molecular Cell. 2008;32:190–197. doi: 10.1016/j.molcel.2008.10.001. [DOI] [PMC free article] [PubMed] [Google Scholar]
- 41.Julian P, Konevega AL, Scheres SHW, Lazaro M, Gil D, Wintermeyer W, Rodnina MV, Valle M. PNAS. 2008;105:16924–16927. doi: 10.1073/pnas.0809587105. [DOI] [PMC free article] [PubMed] [Google Scholar]
- 42.Munro JB, Altman RB, O’Connor N, Blanchard SC. Molecular Cell. 2007;25:505–517. doi: 10.1016/j.molcel.2007.01.022. [DOI] [PMC free article] [PubMed] [Google Scholar]
- 43.Sternberg SH, Fei J, Prywes N, McGrath KA, Ruben J, Gonzalez L. Nature Structural and Molecular Biology. 2009;16:861–869. doi: 10.1038/nsmb.1622. [DOI] [PMC free article] [PubMed] [Google Scholar]
Associated Data
This section collects any data citations, data availability statements, or supplementary materials included in this article.


