

Abstract
Increased uric acid (UA) is strongly linked to cardiovascular disease. However, the independent role of UA is still debated because it is associated with several cardiovascular risk factors including obesity and metabolic syndrome. This study assessed the association of UA with increased high-sensitivity C-reactive protein (hs-CRP), increased ratio of triglyceride to high-density lipoprotein cholesterol (TG/HDL), sonographically detected hepatic steatosis, and their clustering in the presence and absence of obesity and metabolic syndrome. We evaluated 3,518 employed subjects without clinical cardiovascular disease from November 2008 through July 2010. Prevalence of hs-CRP ≥3 mg/L was 19%, that of TG/HDL ≥3 was 44%, and that of hepatic steatosis was 43%. In multivariable logistic regression after adjusting for traditional cardiovascular risk factors and confounders, highest versus lowest UA quartile was associated with hs-CRP ≥3 mg/L (odds ratio [OR] 1.52, 95% confidence interval [CI] 1.01 to 2.28, p = 0.04), TG/HDL ≥3 (OR 3.29, 95% CI 2.36 to 4.60, p <0.001), and hepatic steatosis (OR 3.10, 95% CI 2.22 to 4.32, p <0.001) independently of obesity and metabolic syndrome. Association of UA with hs-CRP ≥3 mg/L became nonsignificant in analyses stratified by obesity. Ascending UA quartiles compared to the lowest UA quartile demonstrated a graded increase in the odds of having 2 or 3 of these risk conditions and a successive decrease in the odds of having none. In conclusion, high UA levels were associated with increased TG/HDL and hepatic steatosis independently of metabolic syndrome and obesity and with increased hs-CRP independently of metabolic syndrome.
Increased serum uric acid (UA), the end product of purine metabolism, is strongly associated with cardiovascular disease (CVD)1,2 including coronary heart disease3 and stroke.4 However, the underlying mechanism linking hyperuricemia to CVD risk is unclear. In particular, controversy exists about whether UA is a causative risk factor or merely a marker of other proatherogenic processes. Some studies have found that the association between UA and cardiometabolic risk factors is largely decreased or eliminated after adjusting for body mass index and metabolic syndrome components.1,2,5,6 The objective of this study was to investigate the independent relation between UA and early markers of cardiometabolic risk. We evaluated the association of UA with systemic inflammation (measured by high-sensitivity C-reactive protein [hs-CRP]), dyslipidemia of insulin resistance (measured by the ratio of triglyceride to high-density lipoprotein cholesterol [TG/HDL]), and hepatic steatosis (measured by ultrasound) in the presence and absence of obesity and metabolic syndrome in a healthy Brazilian population.
Methods
The study population consisted of predominantly Caucasian 21- to 85-year-old men and women free of clinical CVD who underwent a required employer-sponsored health examination from November 2008 through July 2010 at the Preventive Medicine Center of the Hospital Israelita Albert Einstein in São Paulo, Brazil. The local institutional review board approved the study and granted a waiver for informed consent. The 3,518 subjects included in this analysis had complete information on hs-CRP, TG/HDL, and hepatic steatosis. Participants missing information on these conditions (n = 678) were more likely to be older men taking lipid-lowering medications with lower low-density lipoprotein cholesterol and higher physical activity levels. None of the participants reported using xanthine oxidase inhibitors or having gout.
Demographic, lifestyle, and medical history information was gathered by questionnaire. Alcohol use was quantified by the Alcohol Use Disorders Identification Test as a numerical score,7 and physical activity was categorized by the International Physical Activity Questionnaire as none, low, moderate, or high.8 Hypertension was identified by previous physician diagnosis, use of blood pressure-lowering medications, or mean blood pressure >140/90 mm Hg, which was calculated from 3 different measurements that followed American Heart Association guidelines.9 Waist circumference was assessed with a tape measure placed parallel to the floor around the smallest diameter between the iliac crest and the costal margin. Obesity was defined as body mass index ≥30 kg/m2 or waist circumference >88 cm in women and >102 cm in men with body mass index >25 kg/m2.
Laboratory tests were conducted using fasting blood samples. Serum UA, TG, total cholesterol, and plasma glucose levels were measured with enzymatic colorimetric assays on a Vitros automated platform (Johnson & Johnson Clinical Diagnostics). HDL cholesterol was obtained using a precipitation method, and low-density lipoprotein cholesterol was calculated by the Friedewald equation for TGs ≤400 mg/dl. All tests were performed at the central laboratory of the Albert Einstein Hospital. Glomerular filtration rate was estimated by the Chronic Kidney Disease Epidemiology Collaboration equation.10 Metabolic syndrome was defined by International Diabetes Federation criteria.11 Participants were identified as having metabolic syndrome if they had abdominal obesity (waist circumference >88 cm in women or >102 cm in men or body mass index >30 kg/m2) and ≥2 of the following factors: hypertriglyceridemia (≥150 mg/dl or lipid-lowering medication), low HDL cholesterol (<40 mg/dl in men and ≥50 mg/dl in women), high blood pressure (≥130/85 mm Hg or antihypertensive medication), or hyperglycemia (fasting blood glucose ≥100 mg/dl).
hs-CRP was assessed by immunonephelometry (Dade-Behring, Newark, Delaware). hs-CRP ≥3 mg/L was defined as increased based on prospective studies that showed increased CV risk at this level.12 The previously established cut point of TG/HDL ≥3 was used to identify insulin resistance.13 TG/HDL is an acceptable marker of insulin resistance in Caucasians, with an area under the receiver operating characteristic curve of 0.770 for predicting the homeostasis model assessment of insulin resistance.14 Abdominal ultrasounds, which have 100% sensitivity for detecting >33% liver fat,15 were obtained after a minimum of 6 hours of fasting. Images were obtained with an Acuson XP-10 scanner (Acuson, Mountain View, California) and read by 2 board-certified radiologists who were blinded to laboratory test data. Hepatic steatosis was defined as the presence of a bright liver with evident contrast between hepatic and renal parenchyma.16
Statistical analyses were performed using STATA 12 (STATA Corp., College Station, Texas). Age, gender, clinical diagnoses, medication use, and risk factors were compared across UA quartiles using 1-way analysis of variance for continuous variables and Pearson chi-square test for categorical variables. Median values of skewed variables were compared using the Kruskal–Wallis test. Multivariable linear regression analyses were performed to assess associations of natural log-transformed hs-CRP and natural log-transformed TG/HDL as separate dependent variables with continuous UA as the independent variable. Multivariable logistic regression analyses were used to characterize associations of hs-CRP ≥3 mg/L, TG/HDL ≥3, and hepatic steatosis with continuous UA and UA quartiles. Subgroup analyses were conducted to investigate the odds ratio (OR) of each outcome in the fourth versus first UA quartile in the presence and absence of obesity and metabolic syndrome. To evaluate the relation of UA with increased hs-CRP, increased TG/HDL, and hepatic steatosis simultaneously, multivariable logistic regression was used to assess the association of UA with 0, 1, 2, or 3 of these conditions.
Results
CV characteristics of the study population of 3,518 subjects (mean age 48 ± 8 years, 81% men) were stratified by UA quartile (Table 1). Participants in the fourth versus first UA quartile were older and more likely to be men. Subjects in higher UA quartiles demonstrated a graded increase in systolic blood pressure, low-density lipoprotein cholesterol, TGs, body mass index, waist circumference, and fasting glucose and a graded decrease in HDL cholesterol and physical activity. Increasing UA quartiles also displayed a successive increase in prevalence of hypertension, obesity, and metabolic syndrome. Overall, ascending UA quartiles exhibited a significant increase in prevalence of hs-CRP ≥3 mg/L, TG/HDL ≥3, and hepatic steatosis (Figure 1).
Table 1.
Cardiovascular characteristics of study population
| Characteristics | UA Quartiles (mg/dl)
|
p Value | |||
|---|---|---|---|---|---|
| 1.9–4.9 (n = 920) | 5.0–5.8 (n = 843) | 5.9–6.7 (n = 886) | 6.8–11.1 (n = 869) | ||
| Age (years) | 47 ± 8 | 49 ± 8 | 49 ± 7 | 49 ± 8 | 0.0005 |
| Men | 403 (44%) | 738 (88%) | 847 (96%) | 862 (99%) | <0.0001 |
| Systolic blood pressure (mm Hg) | 114 ± 13 | 121 ± 12 | 123 ± 12 | 125 ± 14 | <0.0001 |
| Hypertension | 83 (9%) | 141 (17%) | 171 (19%) | 223 (26%) | <0.0001 |
| Low-density lipoprotein cholesterol (mg/dl) | 126 ± 32 | 133 ± 33 | 136 ± 33 | 139 ± 35 | <0.0001 |
| High-density lipoprotein cholesterol (mg/dl) | 55 ± 14 | 47 ± 12 | 45 ± 11 | 43 ± 11 | <0.0001 |
| Triglycerides (mg/dl) | 92 (71–126) | 116 (88–157) | 131 (97–182) | 163 (116–223) | <0.0001 |
| Waist circumference (cm) | 84 ± 11 | 94 ± 10 | 97 ± 10 | 100 ± 10 | <0.0001 |
| Body mass index (kg/m2) | 24 ± 3 | 27 ± 3 | 27 ± 4 | 29 ± 4 | <0.0001 |
| Obesity* | 130 (14%) | 219 (26%) | 289 (33%) | 371 (43%) | <0.0001 |
| Fasting glucose (mg/dl) | 86 ± 8 | 90 ± 12 | 93 ± 11 | 94 ± 10 | <0.0001 |
| Metabolic syndrome | 80 (9%) | 174 (21%) | 253 (29%) | 388 (45%) | <0.0001 |
| Antihypertensive medications | 83 (9%) | 134 (16%) | 167 (19%) | 225 (26%) | <0.0001 |
| Lipid-lowering medications | 81 (9%) | 98 (12%) | 109 (12%) | 108 (12%) | 0.050 |
| Hypoglycemic medications | 1 (0%) | 8 (1%) | 13 (1%) | 13 (2%) | 0.009 |
| Glomerular filtration rate (ml/min/1.73 m2) | 104 ± 12 | 101 ± 12 | 99 ± 12 | 96 ± 14 | <0.0001 |
| Current smokers | 75 (8%) | 79 (9%) | 82 (9%) | 79 (9%) | 0.793 |
| Physical activity | <0.0001 | ||||
| Sedentary | 151 (20%) | 152 (21%) | 175 (23%) | 189 (26%) | |
| Little activity | 221 (29%) | 226 (32%) | 279 (27%) | 269 (37%) | |
| Active | 275 (36%) | 259 (36%) | 244 (32%) | 228 (31%) | |
| Very active | 108 (14%) | 76 (11%) | 59 (8%) | 45 (6%) | |
Values are presented as mean ± SD, number (percentage), or median (interquartile range).
Obesity is defined as body mass index ≥30 kg/m2 or waist circumference >88 cm in women or >102 cm in men if body mass index >25 kg/m2.
Figure 1.
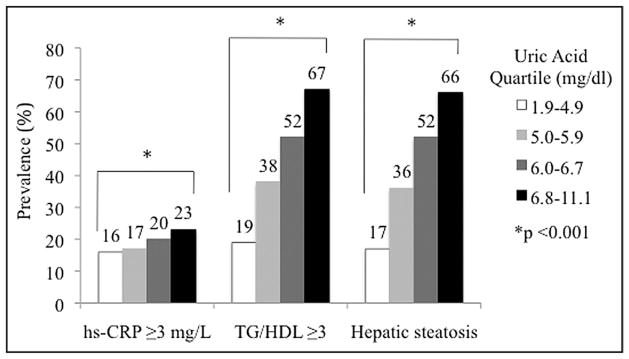
Increasing prevalence of increased high-sensitivity C-reactive protein, increased ratio of triglyceride to high-density lipoprotein cholesterol, and hepatic steatosis across ascending uric acid quartiles.
In linear regression analyses, continuous UA was significantly associated with natural log-transformed hs-CRP and natural log-transformed TG/HDL even after controlling for traditional CVD risk factors and confounders including obesity and metabolic syndrome (Table 2). In logistic regression analyses, continuous UA was significantly associated with hs-CRP ≥3 mg/L, TG/HDL ≥3, and hepatic steatosis. After adjusting for CVD risk factors, confounders, obesity, and metabolic syndrome, every 1-SD (1.41 mg/dl) increase in UA was associated with a significantly greater odds of increased hs-CRP (OR 1.56, 95% confidence interval [CI] 1.41 to 1.73, p = 0.04), increased TG/HDL (OR 2.12, 95% CI 1.93 to 2.32, p <0.001), and hepatic steatosis (OR 1.99, 95% CI 1.81 to 2.18, p <0.001).
Table 2.
Change in natural log-transformed high-sensitivity C-reactive protein and natural log-transformed triglyceride to high-density lipoprotein cholesterol ratio per SD of uric acid in multivariable linear regression
| Outcome | Model 1
|
Model 2
|
Model 3
|
|||
|---|---|---|---|---|---|---|
| Δ per SD UA (95% CI) | p Value | Δ per SD UA (95% CI) | p Value | Δ per SD UA (95% CI) | p Value | |
| Natural log-transformed high-sensitivity C-reactive protein | 0.15 (0.12–0.19) | <0.001 | 0.22 (0.17–0.27) | <0.001 | 0.12 (0.07–0.18) | <0.001 |
| Natural log-transformed triglyceride/high-density lipoprotein cholesterol | 0.30 (0.28–0.32) | <0.001 | 0.22 (0.19–0.25) | <0.001 | 0.15 (0.12–0.18) | <0.001 |
Model 1 was unadjusted (n = 3,518). Model 2 was adjusted for age, gender, glomerular filtration rate, hypertension, low-density lipoprotein cholesterol, glucose, medications (antihypertensive, lipid-lowering, glucose-lowering), current smoking, alcohol use, and physical activity (n = 2,665). Model 3 was adjusted for model 2 variables plus obesity and metabolic syndrome (n = 2,665). SD = uric acid 1.41 mg/dl.
Δ = change.
Each ascending UA quartile compared to the lowest UA quartile demonstrated a graded increase in the odds of hs-CRP ≥3 mg/L, TG/HDL ≥3, and hepatic steatosis in hierarchical logistic regression models (Table 3). After adjusting for traditional CVD risk factors, obesity, and metabolic syndrome, the second, third, and fourth UA quartiles compared to the first were each significantly associated with increased odds of increased TG/HDL and hepatic steatosis, and the highest versus lowest UA quartile had a significantly greater odds of increased hs-CRP. In the fully adjusted model, p values for linear trend across UA quartiles were <0.05 for increased hs-CRP and <0.001 for increased TG/HDL and hepatic steatosis.
Table 3.
Odds ratios for increased high-sensitivity C-reactive protein, increased triglyceride to high-density lipoprotein cholesterol ratio, and hepatic steatosis by uric acid quartile
| Outcome | UA Quartile | Model 1
|
Model 2
|
Model 3
|
|||
|---|---|---|---|---|---|---|---|
| OR (95% CI) | p Value | OR (95% CI) | p Value | OR (95% CI) | p Value | ||
| High-sensitivity C-reactive protein ≥3 mg/L | 4 | 1.59 (1.25–2.02) | <0.001 | 2.26 (1.50–3.31) | <0.001 | 1.52 (1.01–2.28) | 0.04 |
| 3 | 1.33 (1.04–1.69) | 0.02 | 1.72 (1.17–2.52) | 0.01 | 1.32 (0.90–1.94) | 0.15 | |
| 2 | 1.10 (0.85–1.42) | 0.46 | 1.37 (0.95–1.97) | 0.09 | 1.11 (0.77–1.59) | 0.57 | |
| 1 | 1 (reference) | – | 1 (reference) | – | 1 (reference) | – | |
| Triglyceride/high-density lipoprotein cholesterol ≥3 | 4 | 8.39 (6.76–10.42) | <0.001 | 4.83 (3.56–6.55) | <0.001 | 3.29 (2.36–4.60) | <0.001 |
| 3 | 4.43 (3.59–5.46) | <0.001 | 2.58 (1.93–3.43) | <0.001 | 2.14 (1.57–2.91) | <0.001 | |
| 2 | 2.57 (2.08–3.19) | <0.001 | 1.70 (1.28–2.25) | <0.001 | 1.44 (1.06–1.96) | 0.02 | |
| 1 | 1 (reference) | – | 1 (reference) | – | 1 (reference) | – | |
| Hepatic steatosis | 4 | 9.38 (7.52–11.71) | <0.001 | 5.16 (3.75–7.10) | <0.001 | 3.10 (2.22–4.32) | <0.001 |
| 3 | 5.26 (4.23–6.52) | <0.001 | 3.29 (2.44–4.45) | <0.001 | 2.46 (1.80–3.36) | <0.001 | |
| 2 | 2.69 (2.16–3.36) | <0.001 | 1.85 (1.38–2.49) | <0.001 | 1.43 (1.06–1.93) | 0.02 | |
| 1 | 1 (reference) | – | 1 (reference) | – | 1 (reference) | – | |
Model 1 was unadjusted (n = 3,518). Model 2 was adjusted for age, gender, glomerular filtration rate, hypertension, low-density lipoprotein cholesterol, glucose, medications (antihypertensive, lipid-lowering, glucose-lowering), current smoking, alcohol use, and physical activity (n = 2,665). Model 3 was adjusted for model 2 variables plus obesity and metabolic syndrome (n = 2,665).
Hyperuricemia was associated with each of the 3 risk conditions in the presence and absence of metabolic syndrome even after adjusting for traditional CVD risk factors and other confounders (Table 4). Hyperuricemia was most strongly associated with hepatic steatosis in the absence of metabolic syndrome, least strongly associated with increased hs-CRP in the absence of metabolic syndrome, and about equally associated with increased TG/HDL in the absence of metabolic syndrome and with all 3 conditions in the presence of metabolic syndrome. In participants with and without obesity, the fourth compared to the first UA quartile was significantly associated with increased TG/HDL and hepatic steatosis. Stratified by obesity, the fourth versus first UA quartile was not significantly associated with increased hs-CRP, although the magnitude of the association was similar to that in the nonstratified analysis.
Table 4.
Stratified odds ratios for increased high-sensitivity C-reactive protein, increased triglyceride to high-density lipoprotein cholesterol ratio, and hepatic steatosis in fourth versus first uric acid quartile
| Outcome | Obesity
|
Metabolic Syndrome
|
||||||
|---|---|---|---|---|---|---|---|---|
| No (n = 1,879)
|
Yes (n = 786)
|
No (n = 1,964)
|
Yes (n = 701)
|
|||||
| OR (95% CI) | p Value | OR (95% CI) | p Value | OR (95% CI) | p Value | OR (95% CI) | p Value | |
| High-sensitivity C-reactive protein ≥3 mg/L | 1.49 (0.90–2.44) | 0.12 | 1.83 (0.94–3.59) | 0.08 | 1.83 (1.16–2.91) | 0.01 | 3.13 (1.22–8.04) | 0.02 |
| Triglyceride/high-density lipoprotein cholesterol ≥3 | 4.07 (2.83–5.84) | <0.001 | 3.26 (1.78–5.95) | <0.001 | 3.06 (2.12–4.42) | <0.001 | 3.14 (1.38–7.14) | 0.006 |
| Hepatic steatosis | 4.01 (2.71–5.94) | <0.001 | 2.85 (1.56–5.19) | 0.001 | 3.98 (2.71–5.87) | <0.001 | 2.89 (1.46–5.74) | 0.002 |
Adjusted for age, gender, glomerular filtration rate, hypertension, low-density lipoprotein cholesterol, glucose, medications (antihypertensive, lipid-lowering, glucose-lowering), current smoking, alcohol use, and physical activity.
To address residual confounding, subanalyses adding body mass index to the full nonstratified linear regression model showed significant associations of continuous UA with natural log-transformed hs-CRP (0.09 increase in natural log-transformed hs-CRP per 1-SD increase UA, 95% CI 0.04 to 0.14, p = 0.001) and natural log-transformed TG/HDL (0.15 increase in natural log-transformed TG/HDL per 1-SD increase UA, 95% CI 0.12 to 0.17, p < 0.001). Addition of body mass index to the full nonstratified logistic regression model demonstrated that associations of UA with increased TG/HDL (OR 3.18, 95% CI 2.26 to 4.46, p <0.001) and hepatic steatosis (OR 2.47, 95% CI 1.76 to 3.48, p <0.001) also remained significant when comparing the fourth versus first UA quartile, whereas the association of UA with increased hs-CRP became nonsignificant (OR 1.31, 95% CI 0.87 to 1.96, p = 0.19). Likelihood ratio tests of fully adjusted logistic regression models showed nonsignificant interactions of gender and UA for increased TG/HDL (p = 0.75) and hepatic steatosis (p = 0.23) and a significant interaction of gender and UA for hs-CRP (p <0.001). The fully adjusted linear regression model stratified by gender demonstrated that natural log-transformed hs-CRP increased in women (0.20, 95% CI 0.05 to 0.35, p = 0.01) and men (0.11, 95% CI 0.06 to 0.16, p <0.001) for every 1-SD (1.41 mg/dl) increase in UA.
Of the study population, 31%, 27%, and 7% had 1 cardiometabolic risk condition or 2 or 3 cardiometabolic risk conditions, respectively. The proportion of subjects with fourth-quartile UA values increased as the number of risk conditions increased (Figure 2). After adjusting for obesity, metabolic syndrome, traditional CVD risk factors, and other confounders, the third and fourth UA quartiles compared to the first had a significantly increased odds of having 2 or 3 risk conditions and a significantly decreased odds of having 0 risk condition (Figure 2). Adjusted analyses stratified by metabolic syndrome and obesity demonstrated a similar pattern.
Figure 2.
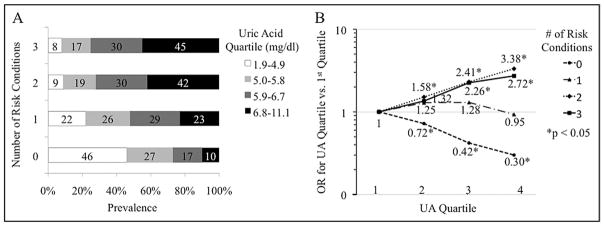
Distribution of uric acid quartiles across risk condition clusters (A) and fully adjusted odds ratios for risk condition clusters in each uric acid quartile versus the first (B).
Discussion
In this study of 3,518 healthy subjects without clinical CVD, higher UA levels were significantly associated with hs-CRP ≥3 mg/L, TG/HDL ≥3, and hepatic steatosis independent of metabolic syndrome after adjustment for confounders including renal function, alcohol use, and antihypertensive medications. Higher UA levels were also significantly associated with increased TG/HDL and hepatic steatosis but not with increased hs-CRP independent of obesity. Likelihood of the combined presence of increased hs-CRP, increased TG/HDL, and hepatic steatosis increased by a factor of 3 in subjects in the highest versus lowest UA quartile. These findings suggest that the relation between UA and early cardiometabolic risk conditions may occur before the development of obesity and metabolic syndrome.
Although some studies have documented the association of UA with inflammation,5,6 insulin resistance,1 or hepatic steatosis17 adjusted for body mass index, few have explored the relation of UA with these cardiometabolic risk conditions in the presence and absence of obesity and metabolic syndrome. Previous publications have similarly found that UA was initially associated with hs-CRP in simple or multivariable regression analyses and that this association was substantially attenuated or lost significance after adjusting for body mass index.5,6 Only 1 study examined the association of hyperuricemia with hepatic steatosis stratified by obesity and metabolic syndrome and found it to be independent of these 2 confounders in healthy Koreans.18
This study’s results suggest that the link between UA and CV risk precedes obesity and metabolic syndrome. UA amplifies oxidative stress in adipocytes by increasing monocyte chemotactic protein-1 and decreasing adiponectin.19 This pro-oxidative action may accelerate adipose formation20,21 and contribute to insulin resistance.22 Insulin resistance could be further exacerbated by the UA-induced decrease of nitric oxide that decreases glucose uptake by skeletal muscle.20 UA lowering by xanthine oxidase inhibitors and uricosuric agents has been shown to reverse insulin resistance in fructose-induced metabolic syndrome and leptin receptor-mediated obesity.19,23,24 The effect of UA on insulin resistance may explain its association with hepatic steatosis.25 Insulin resistance augments hepatic free fatty acid uptake by inducing peripheral lipolysis, and hyperinsulinemia accelerates hepatic fatty acid synthesis and decreases hepatic production of apolipoprotein B-100, which is required for TG release.26
This study has several limitations. The predominantly Caucasian Brazilian study population may decrease generalizability, and the cross-sectional design precludes inferences about temporality and causation. Temporality was partly addressed by stratifying the analysis to examine the association of UA with cardiometabolic risk conditions in the absence of obesity and metabolic syndrome. The study’s strengths are its large population-based cohort, comprehensive adjustment for confounders, and investigation of risk condition clustering. Altogether, this analysis suggests a role for UA in early cardiometabolic risk before the development of obesity and metabolic syndrome.
References
- 1.Feig DI, Kang DH, Johnson RJ. Uric acid and cardiovascular risk. N Engl J Med. 2008;359:1811–1821. doi: 10.1056/NEJMra0800885. [DOI] [PMC free article] [PubMed] [Google Scholar]
- 2.Gagliardi AC, Miname MH, Santos RD. Uric acid: a marker of increased cardiovascular risk. Atherosclerosis. 2009;202:11–17. doi: 10.1016/j.atherosclerosis.2008.05.022. [DOI] [PubMed] [Google Scholar]
- 3.Kim SY, Guevara JP, Kim KM, Choi HK, Heitjan DF, Albert DA. Hyperuricemia and coronary heart disease: a systematic review and meta-analysis. Arthritis Care Res (Hoboken) 2010;62:170–180. doi: 10.1002/acr.20065. [DOI] [PMC free article] [PubMed] [Google Scholar]
- 4.Kim SY, Guevara JP, Kim KM, Choi HK, Heitjan DF, Albert DA. Hyperuricemia and risk of stroke: a systematic review and meta-analysis. Arthritis Rheum. 2009;61:885–892. doi: 10.1002/art.24612. [DOI] [PMC free article] [PubMed] [Google Scholar]
- 5.Saito M, Ishimitsu T, Minami J, Ono H, Ohrui M, Matsuoka H. Relations of plasma high-sensitivity C-reactive protein to traditional cardiovascular risk factors. Atherosclerosis. 2003;167:73–79. doi: 10.1016/s0021-9150(02)00380-5. [DOI] [PubMed] [Google Scholar]
- 6.Lyngdoh T, Marques-Vidal P, Paccaud F, Preisig M, Waeber G, Bochud M, Vollenweider P. Elevated serum uric acid is associated with high circulating inflammatory cytokines in the population-based COLAUS study. PLoS ONE. 2011;6:e19901. doi: 10.1371/journal.pone.0019901. [DOI] [PMC free article] [PubMed] [Google Scholar]
- 7.Bradley KA, DeBenedetti AF, Volk RJ, Williams EC, Frank D, Kivlahan DR. AUDIT-C as a brief screen for alcohol misuse in primary care. Alcohol Clin Exp Res. 2007;31:1208–1217. doi: 10.1111/j.1530-0277.2007.00403.x. [DOI] [PubMed] [Google Scholar]
- 8.Craig CL, Marshall AL, Sjöström M, Bauman AE, Booth ML, Ainsworth BE, Pratt M, Ekelund U, Yngve A, Sallis JF, Oja P. International physical activity questionnaire: 12-country reliability and validity. Med Sci Sports Exerc. 2003;35:1381–1395. doi: 10.1249/01.MSS.0000078924.61453.FB. [DOI] [PubMed] [Google Scholar]
- 9.Perloff D, Grim C, Flack J, Frohlich ED, Hill M, McDonald M, Morgenstern BZ. Human blood pressure determination by sphygmomanometry. Circulation. 1993;88:2460–2470. doi: 10.1161/01.cir.88.5.2460. [DOI] [PubMed] [Google Scholar]
- 10.Stevens LA, Schmid CH, Greene T, Zhang YL, Beck GJ, Froissart M, Hamm LL, Lewis JB, Mauer M, Navis GJ, Steffes MW, Eggers PW, Coresh J, Levey AS. Comparative performance of the CKD Epidemiology Collaboration (CKD-EPI) and the Modification of Diet in Renal Disease (MDRD) study equations for estimating GFR levels above 60 mL/min/1. 73 m2. Am J Kidney Dis. 2010;56:486–495. doi: 10.1053/j.ajkd.2010.03.026. [DOI] [PMC free article] [PubMed] [Google Scholar]
- 11.Alberti KG, Zimmet P, Shaw J IDF Epidemiology Task Force Consensus Group. The metabolic syndrome—a new worldwide definition. Lancet. 2005;366:1059–1062. doi: 10.1016/S0140-6736(05)67402-8. [DOI] [PubMed] [Google Scholar]
- 12.Buckley DI, Fu R, Freeman M, Rogers K, Helfand M. C-reactive protein as a risk factor for coronary heart disease: a systematic review and meta-analyses for the U.S. Preventive Services Task Force. Ann Intern Med. 2009;151:483–495. doi: 10.7326/0003-4819-151-7-200910060-00009. [DOI] [PubMed] [Google Scholar]
- 13.McLaughlin T, Abbasi F, Cheal K, Chu J, Lamendola C, Reaven G. Use of metabolic markers to identify overweight individuals who are insulin resistant. Ann Intern Med. 2003;139:802–809. doi: 10.7326/0003-4819-139-10-200311180-00007. [DOI] [PubMed] [Google Scholar]
- 14.Kim-Dorner SJ, Deuster PA, Zeno SA, Remaley AT, Poth M. Should triglycerides and the triglycerides to high-density lipoprotein cholesterol ratio be used as surrogates for insulin resistance? Metabolism. 2010;59:299–304. doi: 10.1016/j.metabol.2009.07.027. [DOI] [PubMed] [Google Scholar]
- 15.Saadeh S, Younossi ZM, Remer EM, Gramlich T, Ong JP, Hurley M, Mullen KD, Cooper JN, Sheridan MJ. The utility of radiological imaging in nonalcoholic fatty liver disease. Gastroenterology. 2002;123:745–750. doi: 10.1053/gast.2002.35354. [DOI] [PubMed] [Google Scholar]
- 16.Bellentani S, Saccoccio G, Masutti F, Crocè LS, Brandi G, Sasso F, Cristanini G, Tiribelli C. Prevalence of and risk factors for hepatic steatosis in northern Italy. Ann Intern Med. 2000;132:112–117. doi: 10.7326/0003-4819-132-2-200001180-00004. [DOI] [PubMed] [Google Scholar]
- 17.Lee K. Relationship between uric acid and hepatic steatosis among Koreans. Diabetes Metab. 2009;35:447–451. doi: 10.1016/j.diabet.2009.04.011. [DOI] [PubMed] [Google Scholar]
- 18.Lee YJ, Lee HR, Lee JH, Shin YH, Shim JY. Association between serum uric acid and non-alcoholic fatty liver disease in Korean adults. Clin Chem Lab Med. 2010;48:175–180. doi: 10.1515/CCLM.2010.037. [DOI] [PubMed] [Google Scholar]
- 19.Baldwin W, McRae S, Marek G, Wymer D, Pannu V, Baylis C, Johnson RJ, Sautin YY. Hyperuricemia as a mediator of the proinflammatory endocrine imbalance in the adipose tissue in a murine model of the metabolic syndrome. Diabetes. 2011;60:1258–1269. doi: 10.2337/db10-0916. [DOI] [PMC free article] [PubMed] [Google Scholar]
- 20.Johnson RJ, Lanaspa MA, Gaucher EA. Uric acid: a danger signal from the RNA world that may have a role in the epidemic of obesity, metabolic syndrome, and cardiorenal disease: evolutionary considerations. Semin Nephrol. 2011;31:394–399. doi: 10.1016/j.semnephrol.2011.08.002. [DOI] [PMC free article] [PubMed] [Google Scholar]
- 21.Lee H, Lee YJ, Choi H, Ko EH, Kim JW. Reactive oxygen species facilitate adipocyte differentiation by accelerating mitotic clonal expansion. J Biol Chem. 2009;284:10601–10609. doi: 10.1074/jbc.M808742200. [DOI] [PMC free article] [PubMed] [Google Scholar]
- 22.Furukawa S, Fujita T, Shimabukuro M, Iwaki M, Yamada Y, Nakajima Y, Nakayama O, Makishima M, Matsuda M, Shimomura I. Increased oxidative stress in obesity and its impact on metabolic syndrome. J Clin Invest. 2004;114:1752–1761. doi: 10.1172/JCI21625. [DOI] [PMC free article] [PubMed] [Google Scholar]
- 23.Nakagawa T, Hu H, Zharikov S, Tuttle KR, Short RA, Glushakova O, Ouyang X, Feig DI, Block ER, Herrera-Acosta J, Patel JM, Johnson RJ. A causal role for uric acid in fructose-induced metabolic syndrome. Am J Physiol Renal Physiol. 2006;290:F625–F631. doi: 10.1152/ajprenal.00140.2005. [DOI] [PubMed] [Google Scholar]
- 24.Sánchez-Lozada LG, Tapia E, Bautista-García P, Soto V, Avila-Casado C, Vega-Campos IP, Nakagawa T, Zhao L, Franco M, Johnson RJ. Effects of febuxostat on metabolic and renal alterations in rats with fructose-induced metabolic syndrome. Am J Physiol Renal Physiol. 2008;294:F710–F718. doi: 10.1152/ajprenal.00454.2007. [DOI] [PubMed] [Google Scholar]
- 25.Browning JD, Horton JD. Molecular mediators of hepatic steatosis and liver injury. J Clin Invest. 2004;114:147–152. doi: 10.1172/JCI22422. [DOI] [PMC free article] [PubMed] [Google Scholar]
- 26.Angulo P. Nonalcoholic fatty liver disease. N Engl J Med. 2002;346:1221–1231. doi: 10.1056/NEJMra011775. [DOI] [PubMed] [Google Scholar]