Abstract
Dual energy CT imaging is expected to play a major role in the diagnostic arena as it provides material decomposition on an elemental basis. The purpose of this work is to investigate the use of dual energy micro-CT for the estimation of vascular, tissue, and air fractions in rodent lungs using a post-reconstruction three-material decomposition method. We have tested our method using both simulations and experimental work. Using simulations, we have estimated the accuracy limits of the decomposition for realistic micro-CT noise levels. Next, we performed experiments involving ex vivo lung imaging in which intact lungs were carefully removed from the thorax, were injected with an iodine-based contrast agent and inflated with air at different volume levels. Finally, we performed in vivo imaging studies in (n=5) C57BL/6 mice using fast prospective respiratory gating in end-inspiration and end-expiration for three different levels of positive end-expiratory pressure (PEEP). Prior to imaging, mice were injected with a liposomal blood pool contrast agent. The mean accuracy values were for Air (95.5%), Blood (96%), and Tissue (92.4%). The absolute accuracy in determining all fraction materials was 94.6%. The minimum difference that we could detect in material fractions was 15%. As expected, an increase in PEEP levels for the living mouse resulted in statistically significant increases in air fractions at end-expiration, but no significant changes in end-inspiration. Our method has applicability in preclinical pulmonary studies where various physiological changes can occur as a result of genetic changes, lung disease, or drug effects.
Keywords: Micro-CT, dual energy, small animal imaging, lung
1. INTRODUCTION
With the recently developed dual-energy CT technique (DECT), the clinical utility of CT in the pulmonary diseases could be expanded. DECT allows analysis of the chemical composition of tissues by means of dual energy data acquisition and tissue decomposition [1]. CT data analysis with DECT is based on the different x-ray absorption of heavy elements at lower and higher energies of the radiation used. In clinical use, many DECT studies are already focusing on the thorax [2–9]. In the thorax, the three materials most frequently analyzed are iodine, air, and soft tissue. Recently, researchers have evaluated the feasibility of dual energy CT for pulmonary perfusion and ventilation in the lungs using both iodinated contrast agents and Xenon (Xe) to provide distributions representing the local perfusion and ventilation [7]. More interestingly, a recent study [10], has abandoned Xe for ventilation imaging in CT because the use of Xe gas is logistically demanding, and requires special inhalators and pressurized gas bottles. Consequently, the authors have investigated the feasibility of using DECT to evaluate blood and air distribution in differentiation of pathological conditions in the human lung. The study found important relationships between blood and air distributions needed for the interpretation of dual energy CT imaging of the lungs. Equivalent dual energy micro-CT studies of the lungs have never been reported in rodents, the preferred live animals for medical research, for which there are widely available reagents and genetic models of various diseases.
This study specifically investigates the use of dual energy micro-CT to provide the volumetric air, iodine (i.e. blood), and tissue factions in the rodent lung. Such a method could facilitate preclinical studies in cardiopulmonary models of disease.
2. METHODS
2.1 Dual Energy Decomposition
In principle, dual energy CT can only accurately decompose a mixture into two materials. To decompose a mixture into three constitutive materials using dual energy CT measurements, a third constituent must be provided to solve for three unknowns with only two spectral measurements. One solution is to assume that the sum of the volumes of three constituent materials is equivalent to the volume of the mixture (volume or mass conservation). We used a simple post-reconstruction dual energy CT decomposition method similar to [11] to estimate the volume fractions of blood (via iodinated contrast agent), air, and soft tissue in the rodent lung. Two lung CT datasets obtained at two energies (E1 and E2 i.e. 40 and 80 kVp for our studies) are used to find the solution to a system with three unknowns, i.e. the fractions Fair, Ftissue and iodine Fblood according to the next equations:
The values for CTair,E1, CTtissue,E1, CTblood,E1, and CTair,E2, CTtissue,E2, CTblood,E2 are mean CT numbers measured in regions of interests with 100% content of these materials at the two energies and are used to create a sensitivity matrix. The material fractions are obtained using the inverse of the sensitivity matrix as in the next equation:
The pipeline for decomposition is presented by Fig. 1. Before decomposition, a series of processing steps were applied to the low (40) and high (80) kVp sets and included 3D bilateral filtering (BF)[12] and affine registration. 3D BF is applied to each set to reduce noise while preserving edges. The two energy sets were acquired simultaneously, but by two separate orthogonal imaging chains using a dual source micro-CT system[13]. A geometric calibration that we have previously developed[14] ensures that the two sets are reconstructed in the same system of reference. But, since every voxel should be matched in the dual energy sets, a post-reconstruction dual energy method requires a perfect registration. We therefore corrected any remaining errors of geometric calibration by performing an affine registration between 40 and 80 kVp using an ANTS package[15]. To restrict analysis to the lung parenchyma only, we used the correlation-based segmentation tools built into Avizo® (Visualization Sciences Group [VSG] Burlington, MA) (specifically, “CorrelationPlot”) to extract the bulk of the lungs. This preliminary lung mask was then filled in using morphological closing operations.
Fig. 1.
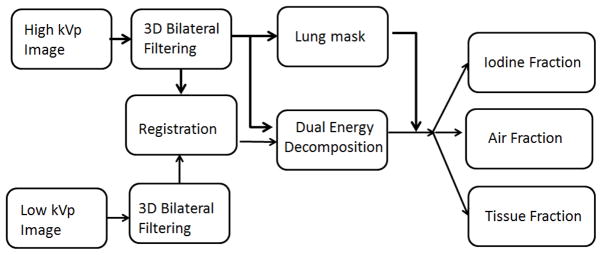
Processing pipeline for dual energy decomposition into three material fractions corresponding to air, soft tissue and iodine (i.e. blood). Prior to decomposition, the two original sets acquired at high and low kVp are filtered via bilateral filtration and registered in ANTS to ensure superior performance of our approach. A binary mask of the lung parenchyma is used to restrict decomposition.:
2.2 Dual Energy Decomposition
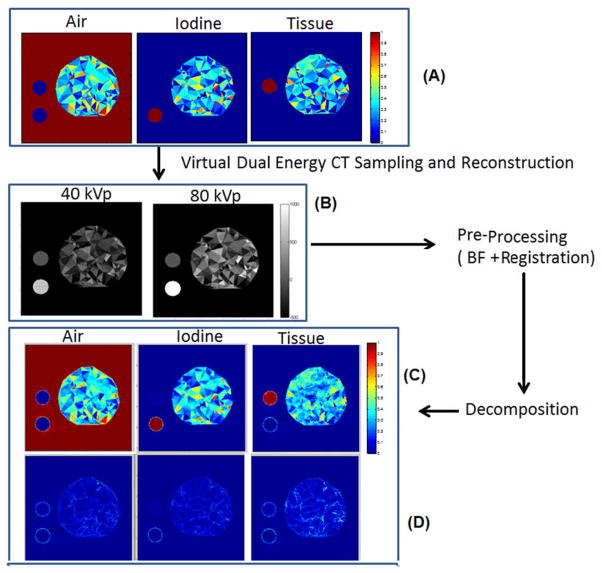
The accuracy of decomposition was evaluated through simulations using a phantom with three materials (air, blood, and tissue). The phantom contained random triangular structures obtained using the delaunay function in MATLAB (see Fig. 2A). Each The decomposition by matrix inversion was followed by correction of invalid values using a lsqlin function available in MATLAB (MathWorks, Natick, MA) that puts limits to the possible fraction so that acceptable values are between [0,1], while also imposing that their sum be one. The outputs of the processing pipeline are 3D material fractions volumes corresponding to air, blood, and tissue. A combined visualization of these maps was achieved by mapping each component as Red, Green, and Blue using scripts available in ImageJ (rsbweb.nih.gov/ij/). triangle was assigned a set of random material concentrations of iodine solutions, soft tissue (i.e. water) and air. Two homogeneous disk structures containing only iodine and only soft tissue were also included. The background was considered air. The iodine concentration in unmixed regions was 50 mg/ml. The phantom was used to create projections via a process similar to an x-ray beam irradiation that included x-ray tubes tube with tungsten-based spectra, aluminum effective filtration (0.7 mm) of the beam and detectors’ Gd2O2S-based sensitivity. These simulations used the Spektr package[16]. A total of 300 projections were used for each kVp scanning. Poisson noise was added to projections to match the noise levels of typical micro-CT data (63.35 HU in the 40 kVp image and 43.14 HU in the 80 kVp image) after reconstruction using filtered back-projection with a Ram-Lak filter (Fig. 2B). The selection of the two scanning voltages maximizes the performance of dual energy decomposition. For the dual source micro-CT system, 40 kVp is the lowest voltage allowed by the micro-CT system’s x-ray generator. This voltage provides minimum enhancement, while values in the range of 70 or 80 kVp provide maximum enhancement when imaging iodine solutions[17]. Bilateral filtering was also applied. The default registration was adequate. The decomposition produced the 3D volumetric fraction maps (Fig. 2C), which were then compared with the known fraction to estimate errors (Fig. 2D). To assess results in a quantitative manner in simulations, we used absolute errors measured between the true and computed material fractions for each pixel. We report both mean and standard deviations. We also present plots of histograms of the absolute errors for all three material fractions, individually and combined. The accuracy was computed as one minus the modulus of the mean absolute error.
Fig. 2.
The simulation protocol and results. The phantom (A) made of random triangular structures with components of air, iodine and tissue was virtually irradiated to create noisy projections used to reconstruct CT images at 40 and 80 kVp (B). The CT images were preprocessed to lower their noise using bilateral filtering and registration. Next, the resulting images were decomposed to estimate the three material fractions (C). Each point on these graphs refers to one triangular structure in the phantom. The errors (i.e. A–C) of the method are shown by (D).
2.3 Ex vivo lung experiments
Following simulations, we performed two experiments using intact lungs carefully extracted from the thorax of Sprague-Dawley (SD) rats. The lung vasculature was filled with iodinated contrast agent (Isovue 370, Bracco Diagnostics, Princeton, NJ) solution. Four different levels of lung inflations were created by injecting volume increments of air. Initially, the lungs were deflated, and we then injected 1.5 ml of air. Next, we added 1 ml of air, two times. At each lung inflation level (deflated, 1.5 ml, 2.5 ml, 3.5 ml), dual energy scanning and decomposition was performed. In each scan, two sets of projections were acquired, one set at 40 kVp, 250 mA, 10 ms exposure, and another set at 80 kVp, 160 mA, 10 ms exposure per projection. Each set consisted of 300 projections. The fraction images were used to compute global lung volumes of air, tissue, and blood by summing the fractions over the whole lung parenchyma (provided by semi-automatic segmentation) and multiplication with the voxel size. The ex-vivo lung case allowed for a controlled experiment in which both visual inspection and quantitative evaluation was possible.
2.4 In vivo experiments in mice
A set of (n=5) C57BL/6 mice were used for proof-of-concept in vivo experiments. These mice were anesthetized with ketamine and xylazine (dose of 100mg/kg ketamine and xylazine 5mg/kg) administered intra-peritoneal for induction. Additional doses were given at approximately 20–30 minutes, intra-vascular with 50% of the initial dose. Mice were injected via tail vein with a liposomal blood contrast agent (dose 0.4 ml/25 g mouse) with a concentration of iodine of 120 mg/ml[18]. This contrast injection ensured a blood enhancement of at least 400 HU. The mice were intubated and mechanically ventilated with tidal volume of 0.4 ml. A series of micro-CT sets used a fast prospective gating strategy[19] at the same imaging parameters as in the ex vivo experiments. In essence, fast prospective gating allows for the acquisition of two projections at each angle, one in end-inspiration and one in end-expiration. A total of 12 sets were acquired (two energies 80 and 40 kVP, each in end-inspiration and expiration and three levels of PEEP at 0, 1, and 2 cm water). Changes in PEEP were achieved using an external line connecting the ventilator valve to a water vial. Our hypothesis for these experiments was that our imaging method would be sensitive enough to detect the expected small changes in in air fraction and total lung volume.
2.5 Statistical Analysis
Statistical analysis was performed for in vivo experimental data by univariate analysis of variance (Anova) using MATLAB to compare the changes of the end-expiration or end-inspiration over different PEEP levels. Data are presented as means ± standard deviations (SD). A p-value <0.05 was considered statistically significant.
3. RESULTS
The simulations confirmed the beneficial role of BF. The noise was reduced from 65 HU in the 40 kVp image to 24 HU and from 43 HU in the 80 kVp image to 13 HU after BF.
The mean accuracy values before BF were for Air (89.8%), Blood (90.4%), and Tissue (80.9%). The absolute accuracy in determining all combined fraction materials before applying BF was 87%. After applying BF, the mean accuracies were improved i.e. Air (95.5%), Tissue (92.4%), and Blood (96%), combined (94.6%). When using BF, the standard deviations of the absolute errors for all combined fractions were 5%. Therefore, according the Rose criterion, which specifies that two different structures can be discriminated if their difference in value are at least 3 times the noise given by standard deviation [20], the minimum difference that we could detect was on the order of 15%. BF applied pre-decomposition increased performance both in simulations and the animal studies. The result of the 3D BF for real data is a decrease in noise by 62% at 40 kVp and 54% at 80 kVp without losing edges.
Fig. 3 presents results obtained during the ex vivo rat lung imaging studies. Visually, the results confirm the enlargement of the lung due to air injections (Fig. 3A). Note the changes in air fractions that reflect the four different levels of lung inflation. As shown by the plot in Fig. 3B, the estimated volumes of air closely track the volumes of actually air added to the lungs for the last three increments. The first increase from deflated lung by injecting 1.5 ml is less accurate. As expected, the soft tissue and blood volumes have very limited variations over the course of the experiment. This is expected, since no iodine or soft tissue were added or subtracted.
Fig. 3.
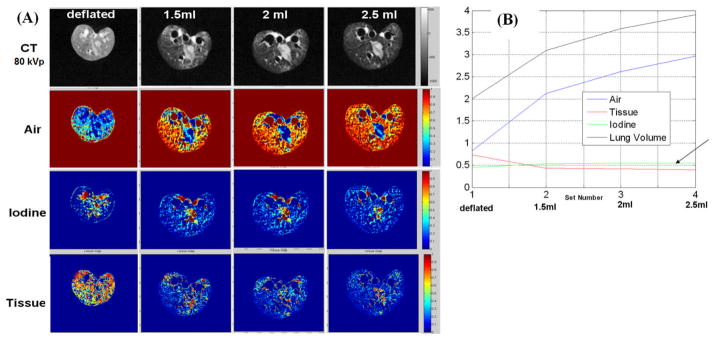
(A) Original CT images (80kVp) and decomposed fraction maps for an ex vivo lung experiment with different levels of lung inflation. (B) The whole lung volume estimation of Air, Tissue, and Iodine over different inflation levels during the experiments. The arrow indicates flat values for Iodine and Tissue components.
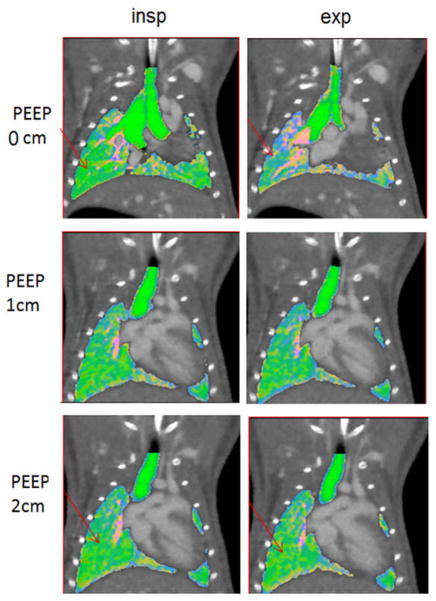
Finally, some representative images from our murine in vivo experiments are shown in Fig. 4. Both end-inspiration and expiration images are shown for three levels of PEEP (i.e. 0, 1, 2 cm H2O). Experimentally, an increase in PEEP should increase the air volume mainly at end-expiration, but it may also improve the air volume at peak inspiration depending on where the lung is set on its pressure-volume curve.
Fig. 4.
Coronal micro-CT slices in a mouse during in vivo experiments at end-expiration, end-inspiration, and with overlaid composed decomposition information (green for air, red for blood, and blue for soft tissue). Three levels of PEEP are shown. Note the changes between end-inspiration and end-expiration at PEEP 0 cm. Increase in PEEP levels make these changes less obvious (see arrows).
Our statistical analysis has shown significant changes (p<0.05) in end-expiration for the three PEEP levels (Fig. 5), although some changes also occurred at end-inspiration that were not statistically significant. ). In Fig. 4, lower levels of air fractions are seen in end-expiration images as increased blue color (more soft tissue fraction [blue] and less air [green] are present). The increase in PEEP reduces the differences as more air is present in the lungs at end-expiration (compare arrows between 0 and 2 cm H2O). The total lung volumes for different PEEP levels were only significantly different at end-expiration (p=0.04). Small, but significant changes, were also found for tissue at end-inspiration. Other physiologically relevant measures can be obtained using this method. For example, the subtraction of the air fractions between inspiration and expiration provides the tidal volume. For our in vivo mice experiments, the mean TV volumes actually fell from 0.22 ml for 0 cm H2O to 0.17ml for 1 cm H2O PEEP and to 0.15 ml for 2 cm H2O PEEP.
Fig. 5.
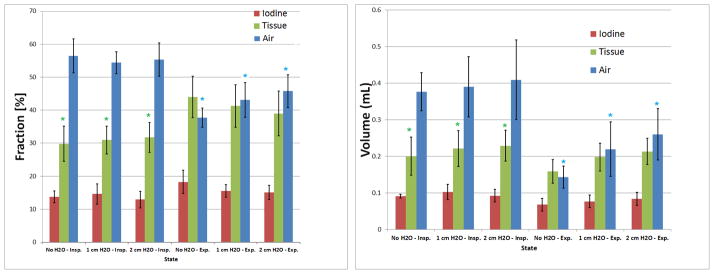
The mean and standard deviations for the three lung material fractions (A) and absolute volumes (B). The * indicates significance levels (p<0.05) for air in end-expirationand tissue in end-inspiration.
The in vivo scans each required 10 minutes and the total radiation dose associated with in vivo mouse studies was 0.8 Gy.
4. DISSCUSION
Our present study has focused on the application of dual energy micro-CT to determine air tissue and blood 3D distributions. Our three materials decomposition is based on the assumption of no variations in density for the three materials over the course of the study. This assumption may not be completely valid for air in the lungs, but we believe that variations in air density are quite limited and therefore our analysis is still valid. The use of a blood pool contrast agent facilitates the perfusion imaging and reflects in fact, pulmonary blood volume information. Our results suggest that such a method based on dual energy micro-CT can be applied as an imaging tool for lung research with estimated limits of detectability of changes of material fractions on the order 15%. Post-sampling processing via bilateral filtering has shown that the performance can be improved with noise reduction. A perfect match between the two energy 3D sets is also essential and it has been provided via registration.
Via controlled perturbations, we have shown both ex vivo and in vivo, that we can provide images and global measurements that reliably sense differences associated with these added perturbations. PEEP experiments in particular, validated our method in vivo in mice. While our air fraction distributions are not ventilation information per se, as also shown by [10] in clinical domain, these images can be used as indicators of lung disease or the effects of therapeutic agents.
The radiation dose associated with our in vivo studies was relatively high (0.8 Gy) and would become a limiting factor for longitudinal studies. However, our in vivo studies were designed for repeated end-inspiration and end-expiration acquisitions. In many situations, only one of these respiratory phases would be required, therefore resulting in half the number of acquisitions as well as radiation dose per study. Furthermore, more sophisticated image reconstruction based on iterative algorithms that we are currently developing [21] has the potential to also reduce dose, while maintaining image quality.
5. CONCLUSIONS
The advantage of our imaging method for pre-clinical lung research consists mainly of the ability to both provide volumetric distribution information and global metrics. In conclusion, our method has potential in pulmonary studies where various physiological changes can occur as a result of genetic changes, lung disease, or environmental or drug exposure.
Acknowledgments
All work was performed at the Duke Center for In Vivo Microscopy, an NIH/NCRR national Biomedical Technology Resource Center (P41 RR005959), with additional support from NCI (U24 CA092656). The liposomal contrast agent has been provided by Drs. Ketan Ghaghada, and Ananth Annapragrada from Texas Children’s Hospital, Houston, TX. We thank Sally Zimney for editorial work.
References
- 1.Johnson TR, Krauss B, Sedlmair M, et al. Material differentiation by dual energy CT: initial experience. European Radiology. 2007;17(6):1510–7. doi: 10.1007/s00330-006-0517-6. [DOI] [PubMed] [Google Scholar]
- 2.Pontana F, Remy-Jardin M, Duhamel A, et al. Lung perfusion with dual-energy multi-detector row CT: can it help recognize ground glass opacities of vascular origin? Academic Radiology. 2010;17(5):587–94. doi: 10.1016/j.acra.2009.12.013. [DOI] [PubMed] [Google Scholar]
- 3.Remy-Jardin M, Faivre JB, Pontana F, et al. Thoracic applications of dual energy. Radiologic Clinics of North America. 2010;48(1):193–205. doi: 10.1016/j.rcl.2009.08.013. [DOI] [PubMed] [Google Scholar]
- 4.Thieme SF, Ashoori N, Bamberg F, et al. European Radiology. 2011. Severity assessment of pulmonary embolism using dual energy CT - correlation of a pulmonary perfusion defect score with clinical and morphological parameters of blood oxygenation and right ventricular failure. [DOI] [PubMed] [Google Scholar]
- 5.Thieme SF, Becker CR, Hacker M, et al. Dual energy CT for the assessment of lung perfusion--correlation to scintigraphy. European Journal of Radiology. 2008;68(3):369–74. doi: 10.1016/j.ejrad.2008.07.031. [DOI] [PubMed] [Google Scholar]
- 6.Thieme SF, Graute V, Nikolaou K, et al. Dual Energy CT lung perfusion imaging-Correlation with SPECT/CT. European Journal of Radiology. 2010 doi: 10.1016/j.ejrad.2010.11.037. [DOI] [PubMed] [Google Scholar]
- 7.Thieme SF, Hoegl S, Nikolaou K, et al. Pulmonary ventilation and perfusion imaging with dual-energy CT. European Radiology. 2010;20(12):2882–9. doi: 10.1007/s00330-010-1866-8. [DOI] [PubMed] [Google Scholar]
- 8.Thieme SF, Johnson TR, Lee C, et al. Dual-energy CT for the assessment of contrast material distribution in the pulmonary parenchyma. AJR American Journal of Roentgenology. 2009;193(1):144–9. doi: 10.2214/AJR.08.1653. [DOI] [PubMed] [Google Scholar]
- 9.Fink C, Johnson TR, Michaely HJ, et al. Dual-energy CT angiography of the lung in patients with suspected pulmonary embolism: initial results. RoFo: Fortschritte auf dem Gebiete der Rontgenstrahlen und der Nuklearmedizin. 2008;180(10):879–83. doi: 10.1055/s-2008-1027724. [DOI] [PubMed] [Google Scholar]
- 10.Ferda J, Ferdova E, Mirka H, et al. Pulmonary imaging using dual-energy CT, a role of the assessment of iodine and air distribution. European Journal of Radiology. 2011;77(2):287–93. doi: 10.1016/j.ejrad.2009.08.005. [DOI] [PubMed] [Google Scholar]
- 11.Granton PV, Pollmann SI, Ford NL, et al. Implementation of dual- and triple-energy cone-beam micro-CT for postreconstruction material decomposition. Medical Physics. 2008;35(11):5030–42. doi: 10.1118/1.2987668. [DOI] [PubMed] [Google Scholar]
- 12.Tomasi C, Manduchi R. Bilateral filtering for gray and color images. Sixth International Conference on Computer Vision; 1998. pp. 839–846. [Google Scholar]
- 13.Badea C, Johnston S, Johnson B, et al. A dual micro-CT system for small animal imaging. 6913:691342. doi: 10.1117/12.772303. [DOI] [PMC free article] [PubMed] [Google Scholar]
- 14.Johnston SM, Johnson GA, Badeaa CT. Geometric calibration for a dual tube/detector micro-CT system. Medical Physics. 2008;35(5):1820–1829. doi: 10.1118/1.2900000. [DOI] [PMC free article] [PubMed] [Google Scholar]
- 15.Avants BB, Tustison NJ, Song G, et al. A reproducible evaluation of ANTs similarity metric performance in brain image registration. Neuro Image. 2011;54(3):2033–44. doi: 10.1016/j.neuroimage.2010.09.025. [DOI] [PMC free article] [PubMed] [Google Scholar]
- 16.Siewerdsen JH, Waese AM, Moseley DJ, et al. Spektr: a computational tool for x-ray spectral analysis and imaging system optimization. Medical Physics. 2004;31(11):3057–67. doi: 10.1118/1.1758350. [DOI] [PubMed] [Google Scholar]
- 17.Badea C, Johnston S, Qi Y, et al. Dual-energy micro-CT imaging for differentiation of iodine-and gold-based nanoparticles. Proceedings of SPIE. 2011;7961:79611X. [Google Scholar]
- 18.Mukundan S, Ghaghada K, Badea C, et al. A Nanoscale, Liposomal Contrast Agent for Preclincal MicroCT Imaging of the Mouse. AJR American Journal of Roentgenology. 2006;186:300–307. doi: 10.2214/AJR.05.0523. [DOI] [PubMed] [Google Scholar]
- 19.Guo X, Johnston SM, Qi Y, et al. 4D micro-CT using fast prospective gating. Physics in Medicine and Biology. 2011;57(1):257–271. doi: 10.1088/0031-9155/57/1/257. [DOI] [PMC free article] [PubMed] [Google Scholar]
- 20.Rose A. The Sensitivity Performance of the Human Eye on an Absolute Scale. Journal of the Optical Society of America. 1948;38(2):196–208. doi: 10.1364/josa.38.000196. [DOI] [PubMed] [Google Scholar]
- 21.Johnston S, Johnson G, Badea C. GPU-based iterative reconstruction with total variation minimization for micro-CT. Proceedings of SPIE. 2010;7622:762238. [Google Scholar]


