Abstract
The vergence-accommodation conflict associated with viewing stereoscopic 3D (S3D) content can cause visual discomfort. Previous studies of vergence and accommodation have shown that the coupling between the two responses is driven by a fast, phasic component. We investigated how the temporal properties of vergence-accommodation conflicts affect discomfort. Using a unique volumetric display, we manipulated the stimulus to vergence and the stimulus to accommodation independently. There were two experimental conditions: 1) natural viewing in which the stimulus to vergence was perfectly correlated with the stimulus to accommodation; and 2) conflict viewing in which the stimulus to vergence varied while the stimulus to accommodation remained constant (thereby mimicking S3D viewing). The stimulus to vergence (and accommodation in natural viewing) varied at one of three temporal frequencies in those conditions. The magnitude of the conflict was the same for all three frequencies. The young adult subjects reported more visual discomfort when vergence changes were faster, particularly in the conflict condition. Thus, the temporal properties of the vergence-accommodation conflict in S3D media affect visual discomfort. The results can help content creators minimize discomfort by making conflict changes sufficiently slow.
Keywords: Stereoscopic displays, stereo, vergence, accommodation, temporal, vergence-accommodation conflict, visual discomfort
1. INTRODUCTION
Many factors may cause visual discomfort while viewing stereoscopic 3D (S3D) displays. They include the vergence-accommodation conflict, visual-vestibular conflict, crosstalk, mismatches between the two eyes’ images, perceptual distortions due to incorrect viewing position, and more [1,2]. Here we examine some properties of the vergence-accommodation conflict and how those properties affect visual discomfort.
Vergence is the simultaneous rotation of two eyes in opposite directions [3]. By converging properly, the viewer maintains single vision. Accommodation is the change of the focal power of the crystalline lens within the eye [3]. By accommodating, the viewer maintains a sharp retinal image. The vergence-accommodation conflict occurs when there is mismatch between the stimulus to vergence and the stimulus to accommodation: specifically, when the required vergence distance differs from the required accommodative distance. In natural viewing, the stimuli to vergence and to accommodation vary in unison. For example, consider catching a ball. As it approaches, your eyes converge and accommodate together to maintain a clear single image of the ball. The visual system has taken advantage of the natural correlation between the stimuli to vergence and accommodation by developing cross-links between the two responses (i.e., changing vergence causes a change in accommodation and vice versa). Because of the cross-links, vergence and accommodation are faster and more accurate when the stimuli to the two responses are the same (i.e., when the vergence distance equals the accommodation distance). S3D displays disrupt the normal relationship between vergence and accommodation. When viewing such displays, one must converge the eyes to changing vergence stimuli while keeping the eyes’ focal distance fixed at the screen distance. This inconsistency between vergence stimuli and accommodation stimuli is the vergence-accommodation conflict and it can cause discomfort [4–6].
Optometrists and ophthalmologists create vergence-accommodation conflicts when they fit patients with optical corrections (e.g., glasses or contact lenses). They have developed rules for minimizing the associated discomfort [7,8]. But those rules may not apply to S3D viewing for two reasons: 1) optical correction produces a constant change in the magnitude of the conflict while S3D viewing produces variable change [6]; 2) optical correction produces a vergence-accommodation conflict that people may experience all waking hours while S3D displays produce conflicts for the duration of the viewing period only. Thus, the rules developed in optometry and ophthalmology may not be generalizable to S3D media.
The creators of S3D content have also considered the vergence-accommodation conflict and how to minimize the associated discomfort [9]. For example, the percentage rule states that content in front of the screen should not have an on-screen disparity greater than 2–3% of the screen width and that content behind the screen should not have a disparity greater than 1–2% of screen width [6]. But such rules were developed from the content creators’ own experience and have not been tested rigorously.
The circuits controlling vergence and accommodation have phasic and tonic components. The phasic component is responsible for fast changes in both responses such as those that occur as one looks from one object to another in everyday viewing [10]. The tonic component is responsible for slow changes in vergence and accommodation; this component adapts to long-term changes in the relationship between vergence and accommodation such as occurs when a person is fitted with a new optical correction [10]. Most important in the current context is the fact that the cross-links between vergence and accommodation are established through the phasic, not the tonic component [10,11]. Thus fast changes in the vergence-accommodation conflict may be more difficult for the visual system to manage than slow changes, and this may in turn create greater discomfort with fast changes.
Here we investigate how the temporal properties of the vergence-accommodation conflict affect the discomfort experienced by S3D viewers. Specifically, we examine whether frequent changes in the conflict are more uncomfortable than infrequent changes.
2. EXPERIMENT 1: TEMPORAL FREQUENCY OF VERGENCE-ACCOMMODATION CONFLICT AND VISUAL DISCOMFORT
We first investigated whether the temporal distribution of the vergence-accommodation conflict differentially affects visual discomfort.
2.1 Methods
Thirty-four young adults (17–29 years of age) participated. All had normal or corrected-to-normal visual acuity and stereo acuity. Those who normally wear an optical correction wore it during the experiment (12 with glasses, 9 with contact lenses). All subjects were unaware of the experimental hypotheses. The data from four subjects were excluded because they did not achieve the minimum performance on the behavioral task (i.e., percent-correct performance was less than 75%).
The stimuli were random-dot stereograms of sinusoidal corrugations in depth. We used a stereoscopic volumetric display [12] to manipulate vergence and accommodation stimuli independently. The stimuli were constructed (i.e., high dot density of 43 dots/deg2 and high corrugation spatial frequencies of 1, 1.4, and 2cpd) so that reasonably accurate vergence and accommodation were required to perceive the depth corrugation [13]. The corrugation appeared in a circular patch with a diameter of 4.2°. The stimuli were presented every 2sec so that subjects had to make reasonably accurate vergence and accommodative responses at least that often. The behavioral task was to indicate the orientation of the depth corrugation every 2sec.
Figure 1 depicts the experimental conditions. There were two main stimulus conditions: natural viewing and conflict (left and right columns, respectively). In the natural-viewing condition, vergence and accommodation stimuli changed together as they do in everyday viewing. The changes were 1.2D in magnitude. In the conflict condition, the vergence stimuli changed as they did in the natural-viewing condition but the accommodation stimuli remained fixed; the conflict condition therefore mimicked the viewing of S3D displays. The vergence changes were 1.2D. These two conditions were presented at three temporal frequencies. T is the period of the vergence and accommodation changes; it was a multiple of 4sec. We presented three values of T: 4, 20, and 100sec creating temporal frequencies of 0.25, 0.05, and 0.01Hz, respectively (Table 1). 0.25Hz was the fastest value we could present given the 2sec presentations of the stimuli. That temporal variation is fast enough to engage the cross-links. The medium and slow values of 0.05 and 0.01Hz created frequencies at which the vergence-accommodation cross-links are supposedly not responsive [11]. We expected subjects to have the most difficulty dissociating vergence and accommodation in the fast condition (0.25Hz) and less difficulty in the slower conditions (0.05 and 0.01Hz). From these expectations, we predicted that discomfort would be greater in the fast condition than in the others even though the amount of conflict was the same across conditions.
Figure 1.
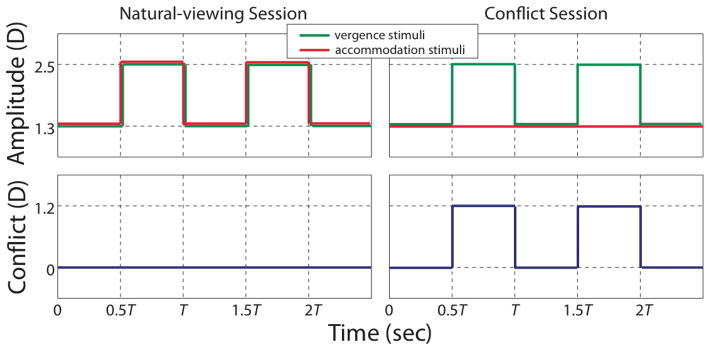
Stimulus conditions. In the natural-viewing condition (left column), vergence and accommodation stimuli changed in unison. In the conflict session (right column), the vergence stimulus changed while the accommodative stimulus remained fixed; this mimics an S3D display. The upper row shows the stimulus to vergence (green) and the stimulus to accommodation (red) over time. The lower row shows the conflict between the vergence and accommodation stimuli over time. T, the time period of the variation in the stimuli differed depending on temporal frequency.
Table 1.
Conditions in Experiment 1.
| Condition | Session | Period (sec) | Vergence distances (D) | Vergence distances (m) | Focal distances (D) | Focal distances (m) |
|---|---|---|---|---|---|---|
| 1 | Natural | 4 | 1.3 and 2.5 | 0.77 and 0.40 | 1.3 and 2.5 | 0.77 and 0.40 |
| Conflict | 4 | 1.3 and 2.5 | 0.77 and 0.40 | 1.3 | 0.77 | |
| 2 | Natural | 20 | 1.3 and 2.5 | 0.77 and 0.40 | 1.3 and 2.5 | 0.77 and 0.40 |
| Conflict | 20 | 1.3 and 2.5 | 0.77 and 0.40 | 1.3 | 0.77 | |
| 3 | Natural | 100 | 1.3 and 2.5 | 0.77 and 0.40 | 1.3 and 2.5 | 0.77 and 0.40 |
| Conflict | 100 | 1.3 and 2.5 | 0.77 and 0.40 | 1.3 | 0.77 |
Subjects went through six sessions total, two on each day. On a given day, they went through the conflict and natural-viewing conditions at one temporal frequency; the order of conflict and natural viewing was random. Each session lasted 10min. Subjects took a break of at least 15min between sessions until they were fully recovered from the discomfort experienced in the first session. The order of temporal frequencies was randomized across days. The subject and experimenter were both unaware of which condition or session was currently being presented.
Subjects reported their symptoms by completing questionnaires: A Per-session Questionnaire and a Session-comparison Questionnaire. The Questionnaires were based on ones used previously by Shibata and colleagues [6].
The Per-session Questionnaire had five questions:
How tired are your eyes?
How clear is your vision?
How tired and sore are your neck and back?
How do your eyes feel?
How does your head feel?
Subjects answered the questions using a 9-point Likert scale, where 1 meant no negative symptoms and 9 meant severe symptoms.
The Session-comparison Questionnaire had four questions:
Which session was most fatiguing?
Which session irritated your eyes the most?
Which session gave you more headache?
Which session did you prefer?
Subjects completed the Per-session Questionnaire at the end of each session, and the Session-comparison Questionnaire at the end of each pair of sessions.
2.2 Results
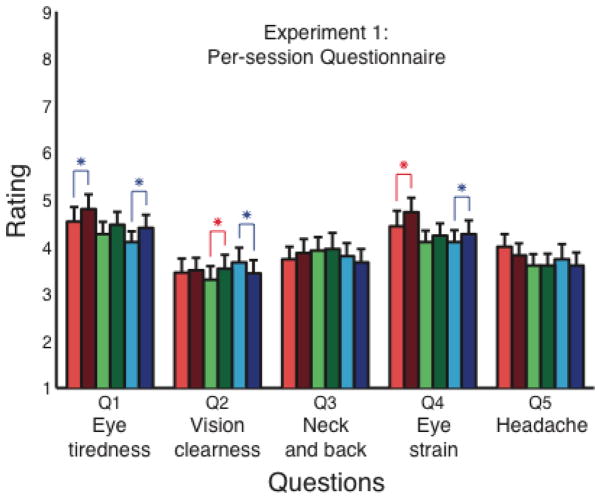
Figure 2 shows the data from the Per-session Questionnaire averaged across the 30 subjects. The data are grouped by question. Different colors represent different conditions and sessions. Red bars represent the 0.25Hz condition, green bars the 0.05Hz condition, and blue bars the 0.01Hz condition. Light and dark bars represent the natural-viewing and conflict sessions, respectively. Generally, the conflict sessions produced worse symptoms on the vision-related questions (#1, 2, & 4) than the natural-viewing sessions did: Symptoms were worse in eight of the nine pair-wise comparisons (the outlier was question 2 when the frequency was slow and the natural-viewing session produced worse symptoms than the conflict session; p < 0.10). Of those eight, five were significantly (Wilcoxon signed rank test, p < 0.05, one tailed) or marginally significantly different (p < 0.10, one tailed). The conflict sessions did not produce worse symptoms on the non-vision-related questions (#3 & 5) than the natural-viewing sessions. Thus, we generally observed greater visual discomfort when the vergence-accommodation conflict was present than when it was not, which replicates previous findings [5,6]. This is interesting because subjects were presumably making larger vergence and accommodation responses overall in the natural-viewing condition than in the conflict condition. Nonetheless, they experienced more visual discomfort in the conflict condition.
Figure 2.
Per-session Questionnaire data from Experiment 1 averaged across subjects. Red, green, and blue bars represent the data with fast, medium, and slow frequencies, respectively. Light and dark bars represent the data from the natural-viewing and conflict sessions, respectively. Error bars represent standard errors. The red asterisks indicate pair-wise differences that were statistically significant (Wilcoxon signed rank test, p < 0.05) and blue asterisks difference that were marginally significant (p < 0.10). In question 1, 2, and 4, conflict sessions were more fatiguing than natural-viewing sessions.
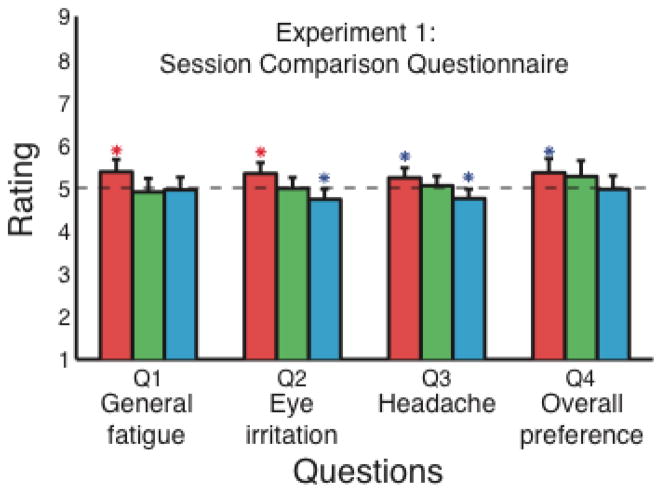
Figure 3 shows the data from the Session Comparison Questionnaire averaged across subjects. Again, red, green, and blue bars represent the data from the fast, medium, and slow frequencies, respectively. 1 means the conflict session was preferred, 9 means the natural-viewing session was preferred, and 5 means the sessions were reported as equal. For all four questions, the symptoms for the fast conflict condition were worse than those for the natural-viewing condition; two of those were significantly greater than 5 (Wilcoxon signed rank test, p < 0.05, one tailed) and two were marginally significantly greater than 5 (p < 0.10, one tailed). There were no systematic differences between the conflict and natural-viewing conditions at the medium frequency. At the slow frequency, there was a tendency for the natural-viewing condition to produce worse symptoms than the conflict condition. We conclude that consistent discomfort occurs when the vergence-accommodation conflict changes fairly rapidly and that little discernible discomfort occurs when the conflict changes slowly. This confirms our expectation—based on the dynamics of the cross-links between vergence and accommodation—that the visual system can handle inconsistencies between the stimulus to vergence and the stimulus to accommodation when the inconsistencies occur slowly.
Figure 3.
Data from the Session Comparison Questionnaire of Experiment 1 averaged across subjects. Red, green, and blue bars represent the data from the fast, medium, and slow frequencies, respectively. 1 means that the conflict session was preferred, 9 means that the natural-viewing session was preferred, and 5 means that they were deemed equal. Error bars represent standard errors. The red asterisks indicate pair-wise differences that were statistically significant (Wilcoxon signed rank test, p < 0.05, one tailed) and blue asterisks differences that were marginally significant (p < 0.10).
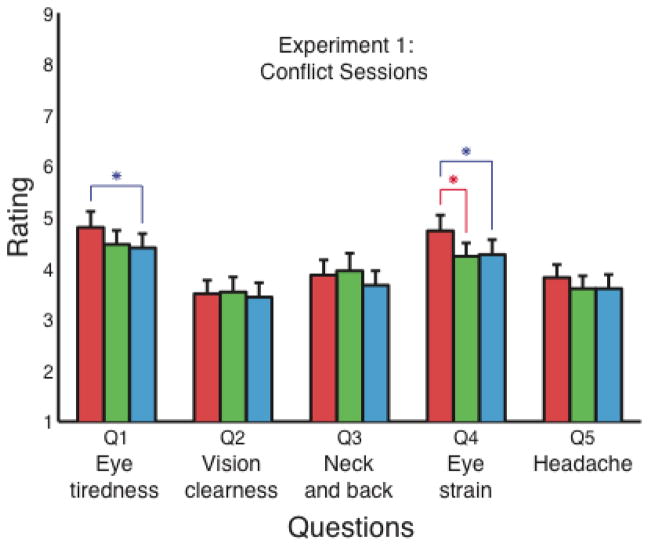
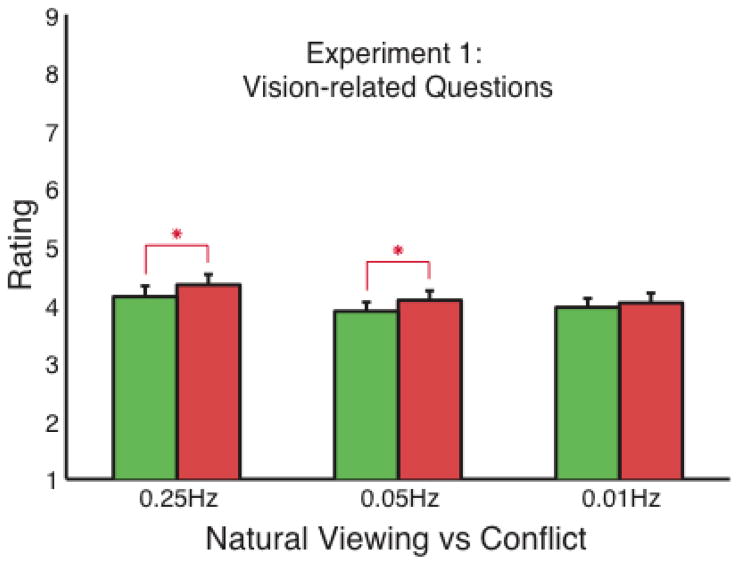
In order to compare the effect of different temporal frequencies, we collated the data from the conflict sessions and the Per-session Questionnaire. They are plotted in Figure 4. Red, green, and blue bars represent fast, medium, and slow temporal frequencies, respectively. Of the three vision-related questions, two produced significantly or marginally significantly worse symptoms with the fast temporal frequency than with the slower ones. To examine the effect of temporal frequency yet further, we plotted in Figure 5 the comparison between the conflict and natural-viewing sessions on the vision-related questions (#1, 2, and 4). Green and red represent data from the natural-viewing and conflict sessions, respectively. 1 means no negative symptoms and 9 means severe symptoms. Symptoms were significantly worse in the conflict condition than in the natural-viewing condition at fast and medium frequencies (p<0.05, Wilcoxon signed rank, one-tailed).
Figure 4.
Conflict session data from Experiment 1 averaged across 30 subjects. The symptom scores from the conflict sessions and the Per-session Questionnaire are plotted for the five questions. Red, green, and blue bars represent the data from the fast, medium, and slow frequency conditions. Red asterisks denote statistically significant pair-wise differences (p<0.05, Wilcoxon signed rank, two-tailed) and blue asterisks denote marginally statistically significant differences (p<0.10). Error bars are standard errors.
Figure 5.
Symptoms associated with the natural-viewing and conflict sessions at different temporal frequencies. The across-subject averages from the Per-session Questionnaire are plotted for questions 1, 2, and 4. Green and red represent the data from the natural-viewing and conflict session, respectively. 1 means no negative symptoms and 9 means severe symptoms. Red asterisks indicate differences that are statistically significantly different (p<0.05, Wilcoxon signed rank, one-tailed). Error bars are standard errors.
3. EXPERIMENT 2: EFFECT OF VIEWING DISTANCE
We next investigated how viewing distance affects the relationship between the temporal properties of the vergence-accommodation conflict and visual discomfort. We also lengthened the duration of each session because we were concerned that the effects observed in Experiment 1 were small.
3.1 Methods
Fourteen young adults (19–30 years old) participated. All had normal or corrected-to-normal visual acuity and stereo acuity. Those who normally wear optical correction wore it during the experiment (4 with glasses, 6 with contact lenses). All subjects were unaware of the experimental hypotheses. The data from two subjects were excluded because they did not reach the performance minimum of 75% on the behavioral task.
The stimuli, apparatus, and procedure were identical to those of Experiment 1 with a few exceptions (Table 2). We increased session duration from 10 to 20min. We increased the minimum break between sessions from 15 to 30min. We decreased the number of frequencies from three (0.25, 0.05, and 0.01Hz) in Experiment 1 to two (0.25 and 0.05Hz) in Experiment 2. The vergence and accommodation distances were increased in conditions 1 and 2 from 0.4 and 0.77m in Experiment 1 to 0.77 and 10m in Experiment 2 (i.e., from 2.5 and 1.3D to 1.3 and 0.1D). The distances in condition 3 were the same as in Experiment 1 to allow cross-validation. Again the steps in the stimulus to vergence (and accommodation in the natural-viewing sessions) were 1.2D.
Table 2.
Conditions in Experiment 2.
| Condition | Session | Period (sec) | Vergence distances (D) | Vergence distances (m) | Focal distances (D) | Focal distances (m) |
|---|---|---|---|---|---|---|
| 1 | Natural | 4 | 0.1 and 1.3 | 10 and 0.77 | 0.1 and 1.3 | 10 and 0.77 |
| Conflict | 4 | 0.1 and 1.3 | 10 and 0.77 | 0.1 | 10 | |
| 2 | Natural | 20 | 0.1 and 1.3 | 10 and 0.77 | 0.1 and 1.3 | 10 and 0.77 |
| Conflict | 20 | 0.1 and 1.3 | 10 and 0.77 | 0.1 | 10 | |
| 3 | Natural | 4 | 1.3 and 2.5 | 0.77 and 0.40 | 1.3 and 2.5 | 0.77 and 0.40 |
| Conflict | 4 | 1.3 and 2.5 | 0.77 and 0.40 | 1.3 | 0.77 |
3.2 Results
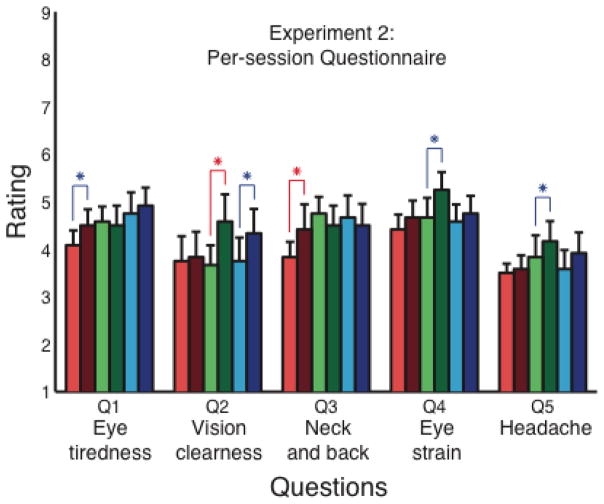
Figure 6 shows the data from the Per-session Questionnaire averaged across subjects. The data are grouped by question. Different colors represent different conditions and sessions. Red bars represent 0.25Hz at the far base distance (0.1D), green bars 0.05Hz at the far base distance (0.1D), and blue bars represent 0.25Hz at the near base distance (1.3D). Light and dark bars represent the natural-viewing and conflict conditions, respectively. Eight of the nine comparisons on vision-related questions yielded worse symptoms in the conflict than in the natural-viewing condition. Of those eight, four differences were either significantly different or marginally significantly different. In addition, all three pairings in the headache question revealed worse symptoms in the conflict than in the natural-viewing condition. There was no systematic pattern in the question related to the neck and back. Thus, we observed more vision- and head-related discomfort in the conflict than in the natural-viewing condition at both temporal frequencies. It seems that with longer sessions durations and/or longer viewing distances, vergence-accommodation conflicts produced discomfort at not only 0.25Hz, but also 0.05Hz.
Figure 6.
Data from the Per-session Questionnaire of Experiment 2 averaged across subjects. Red bars represent 0.25Hz at the far base distance (0.1D), green bars represent 0.05Hz at the far base distance (0.1D), and blue bars represent 0.25Hz at the near base distance (1.3D). Error bars represent standard errors. The red asterisks indicate pair-wise differences that were statistically significant (Wilcoxon signed rank test, p < 0.05) and blue asterisks differences that were marginally significant (p < 0.10).
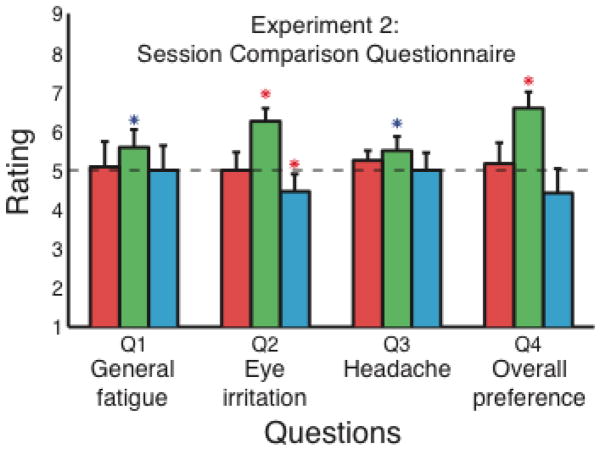
Figure 7 shows the data from the Session Comparison Questionnaire averaged across subjects. Red bars represent 0.25Hz at the far base distance (0.1D), green bars represent 0.05Hz at the far base distance (0.1D), and blue bars represent 0.25Hz at the close base distance (1.3D). Interestingly, symptoms were significantly or marginally significantly worse at 0.05Hz for all four questions. By lengthening the session duration and/or by increasing the viewing distance, we created a consistent preference that frequency for the natural-viewing as opposed to the conflict stimulus. We note that condition 3, the one repeated from Experiment 1, did not yield consistently worse symptoms in the conflict than in the natural-viewing condition; this is different from what we observed in Experiment 1 where worse symptoms were observed in the conflict condition.
Figure 7.
Data from the Session Comparison Questionnaire in Experiment 2 averaged across subjects. Red bars represent 0.25Hz at the far base distance (0.1D), green bars represent 0.05Hz at the far base distance (0.1D), and blue bars represent 0.25Hz at the near base distance (1.3D). Error bars represent standard errors. The red asterisks indicate pair-wise differences that were statistically significant (Wilcoxon signed rank test, p < 0.05) and blue asterisks differences that were marginally significant (p < 0.10).
4. DISCUSSION AND CONCLUSIONS
We investigated how the temporal properties of vergence-accommodation conflicts affect the discomfort associated with S3D viewing. We manipulated the stimulus to vergence and the stimulus to accommodation in two ways: natural viewing in which the stimulus to vergence was perfectly correlated with the stimulus to accommodation and conflict viewing in which the stimulus to vergence varied while the stimulus to accommodation remained constant. The latter condition mimics S3D viewing. The stimulus to vergence (and accommodation in natural viewing) varied at one of three temporal frequencies in those conditions. We found that young adults experience more visual discomfort when the vergence-accommodation conflict changes at faster as opposed to slower rates. We conclude that the temporal properties of the vergence-accommodation conflict in S3D media affect visual discomfort. The results may help content creators minimize discomfort by making conflict changes sufficiently slow.
References
- 1.Kooi FL, Toet A. Visual comfort of binocular and 3D displays. Displays. 2004;25:99–108. [Google Scholar]
- 2.Lambooij M, IJsselsteijn W, Fortuin M, Heynderickx I. Visual discomfort and visual fatigue of stereoscopic displays: A review. J Imag Sci Tech. 2009;53:1–14. [Google Scholar]
- 3.Howard IP, Rogers BJ. Seeing in depth. Toronto: University of Toronto Press; 2002. [Google Scholar]
- 4.Emoto M, Niida T, Okano F. Repeated vergence adaptation causes the decline of visual functions in watching stereoscopic television. J Disp Technol. 2005;1:328–340. [Google Scholar]
- 5.Hoffman DM, Girshick AR, Akeley K, Banks Vergence-accommodation conflicts hinder visual performance and cause visual fatigue. J Vis. 2008;8(3):33, 1–30. doi: 10.1167/8.3.33. http://www.journalofvision.org/content/8/3/33. [DOI] [PMC free article] [PubMed] [Google Scholar]
- 6.Shibata T, Kim J, Hoffman DM, Banks MS. The zone of comfort: Predicting visual discomfort with stereo displays. J Vis. 2011;11(8):11, 1–29. doi: 10.1167/11.8.11. http://www.journalofvision.org/content/11/8/11. [DOI] [PMC free article] [PubMed] [Google Scholar]
- 7.Percival AS. The relation of convergence to accommodation and its practical bearing. Ophthalmological Review. 1892;11:313–328. [Google Scholar]
- 8.Sheard C. The prescription of prisms. Am J Optom. 1934;11:364–478. [Google Scholar]
- 9.Mendiburu B. 3D movie making: stereoscopic digital cinema from script to screen. Oxford, UK: Focal Press, Elsevier; 2009. [Google Scholar]
- 10.Schor CM. A dynamic model of cross-coupling between accommodation and convergence: Simulations of step and frequency responses. Optom Vis Sci. 1992;69(4):258–269. doi: 10.1097/00006324-199204000-00002. [DOI] [PubMed] [Google Scholar]
- 11.Schor CM. The Glenn A. Fry award lecture: adaptive regulation of accommodative vergence and vergence accommodation. Am J Optom Physiol Opt. 1986;63(8):587–609. [PubMed] [Google Scholar]
- 12.Love GD, Hoffman DM, Hands PJW, Gao J, Kirby AK, Banks MS. High-speed switchable lens enables the development of a volumetric stereoscopic displays. Opt Express. 2009;17:15716–15725. doi: 10.1364/OE.17.015716. [DOI] [PMC free article] [PubMed] [Google Scholar]
- 13.Banks MS, Gepshtein S, Landy MS. Why is spatial stereo resolution so low? J Neurosci. 2004;24:2077–2089. doi: 10.1523/JNEUROSCI.3852-02.2004. [DOI] [PMC free article] [PubMed] [Google Scholar]


