Abstract
Breast tissue classification can provide quantitative measurements of breast composition, density and tissue distribution for diagnosis and identification of high-risk patients. In this study, we present an automatic classification method to classify high-resolution dedicated breast CT images. The breast is classified into skin, fat and glandular tissue. First, we use a multiscale bilateral filter to reduce noise and at the same time keep edges on the images. As skin and glandular tissue have similar CT values in breast CT images, we use morphologic operations to get the mask of the skin based on information of its position. Second, we use a modified fuzzy C-mean classification method twice, one for the skin and the other for the fatty and glandular tissue. We compared our classified results with manually segmentation results and used Dice overlap ratios to evaluate our classification method. We also tested our method using added noise in the images. The overlap ratios for glandular tissue were above 94. 7% for data from five patients. Evaluation results showed that our method is robust and accurate.
Keywords: Breast CT, bias correction, multiscale filter, fuzzy C-Mean classification, image classification, breast tissue classification, breast cancer
1. INTRODUCTION
In the US, the lifetime risk for women of developing breast cancer is one in eight [1]. Currently, the most common test for detection of breast cancer is mammography, but its two-dimensional nature results in tissue superposition, limiting its clinical performance, especially in women with dense breasts [2]. To overcome this limitation, extensive research is being performed in x-ray based tomographic imaging of the breast. One of the technologies being developed is dedicated x-ray breast computed tomography (breast CT) [3–5], which can eliminate the issue of tissue superposition. Breast CT images are acquired with similar methods to whole body CT, with major differences being the positioning of the patient relative to the x-ray source and detector, and the use of a half-cone x-ray beam which irradiates directly only the imaged breast. The resulting breast CT images consist of high-quality volumetric data that provide excellent visualization of the breast tissue distribution. Using breast CT images, an automatic breast tissue classification algorithm may be used to aid in the detection and diagnosis of breast cancer and for identification of women at high-risk of developing breast cancer. In this study we present an automatic breast tissue classification method that was tested using patient images acquired with a breast CT clinical prototype (Koning Corp. , West Henrietta, NY) installed at Emory University’s Winship Cancer Institute.
2. METHODS
Our classification method consists of three major steps: (1) The original breast CT images are corrected by an image-based bias correction method; (2) The corrected breast CT images are filtered using a multiscale bilateral filter; (3) The skin mask is obtained by a morphologic method; (4) A modified fuzzy C-mean classification method is applied to classify the filtered breast CT images.
Figure 1. shows typical breast CT images. Because of CT X-ray beam hardening [6] and X-ray scatter, the resultant attenuation profile differs from the profile that would be obtained. This can result in a cupped appearance and degrade image quality [7]. We used an image-based method for automatic correction of this cupping artifact using a nonparametric coarse to fine approach [8] which allows cupping artifact to be modeled with different frequency ranges without user supervision. We defined an entropy-related cost function based on the combination of intensity and gradient image features. Bilateral filtering can remove noise at intra-regions while preserving the inter-region edge. The filtering process is a weighted average of the local neighborhood samples, where the weights are computed based on radiometric distance between the center sample and the neighboring samples. Bilateral filtering can be described as follows [9]:
Figure 1.
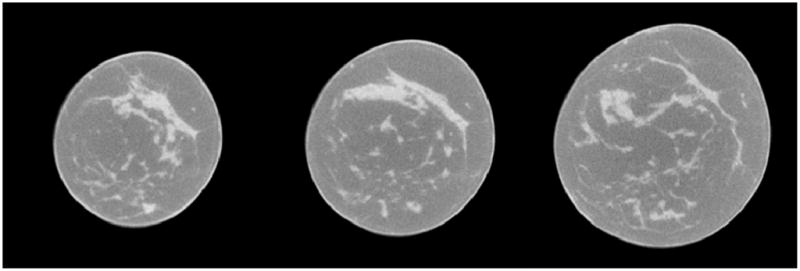
Three breast CT image slices from one patient.
Where I(x) and h(x) denote input images and output images. Wσs measures the geometric closeness between the neighborhood center x and a nearby point ξ; and Wσr measures the photometric similarity between the pixel at the neighborhood center x and that of a nearby point ξ. Thus, the similarity function Wσr operates in the range of the image function I, while the closeness function Wσs operates in the domain of I. It smoothes images while preserving edges by means of a nonlinear combination of nearby image values. The range Gaussian is an edge-stopping function [10]. We reduce the width of the range Gaussian and increase the width of the spatial Gaussian at every scale to filter breast CT images. In our studies we used three scales.
In breast CT images, skin and glandular tissue have similar CT values [11], making them difficult to differentiate based only on the intensity information. Therefore, we use position information to classify the skin and glandular tissue. It has been reported that the skin thickness is 1. 45±0. 30 mm [12,13]. We can calculate the voxel for the skin based on the resolution of the breast CT images. In our studies, the breast CT voxel size is 0. 273×0. 273×0. 273mm3, so we constrain the skin thickness to seven voxels. We use a threshold to get the mask for the whole breast and then use a 7×7 box to perform erosion operations in order to get the mask for the tissue within the skin, i. e. the fatty and glandular tissue. By subtracting the fatty and glandular tissue from the mask of the whole breast, we are able to get the mask for the skin. We use a modified fuzzy C-means (FCM) algorithm to classify the breast CT images [14,15]. Based on the two masks, we perform two classifications, one for the skin and the other for the fatty and glandular tissue.
We validated the classification using a variety of evaluation and analysis methods [16,17,19–21]. In order to evaluate the performance of the classification method, the difference between the classified and manually segmented results was computed using the Dice coefficient [18]. In order to evaluate robustness of our method we added different levels of Gaussian noise to the breast CT images and repeated the classification.
3. RESULTS
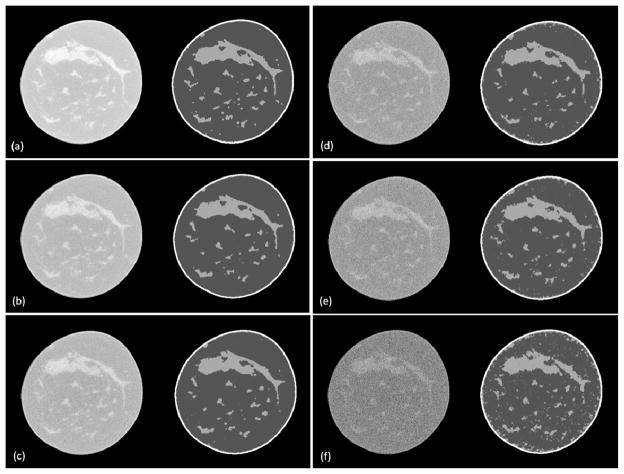
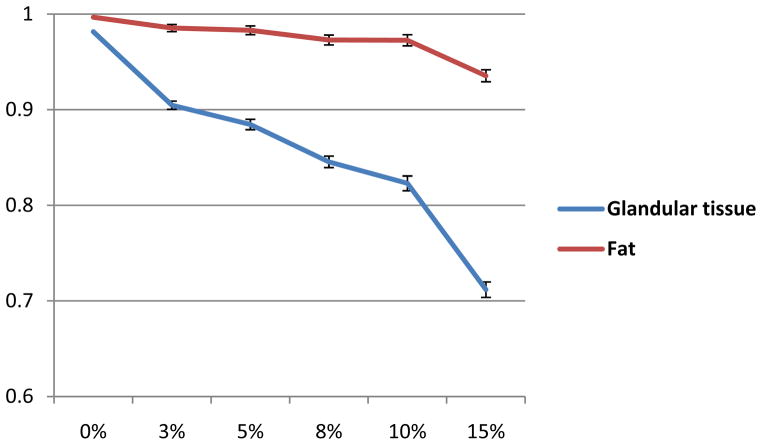
Figure 2 illustrates the visual assessment of the classification results of a breast CT image at different noise levels. The standard deviation of the Gaussian noise is 3%, 5%, 8%, 10% and 15% of the maximum intensity of the CT image. Figure 3 shows the Dice overlap ratios between the manually segmented results of original CT images and our classified results with different noise levels. The overlap ratio is over 82. 9±0. 7% when the original image was added with noise at the 10% level of the maximum CT intensity in the images. The method is robust for noisy images up to 10% added noise.
Figure 2.
Classification results of breast CT at different noise levels. (a) The original breast image and the classified result. (b)–(f) CT images with added 3%, 5%, 8%, 10% and 15% noise, respectively, and the corresponding classified results.
Figure 3.
Overlap ratios of the classification at different noise levels.
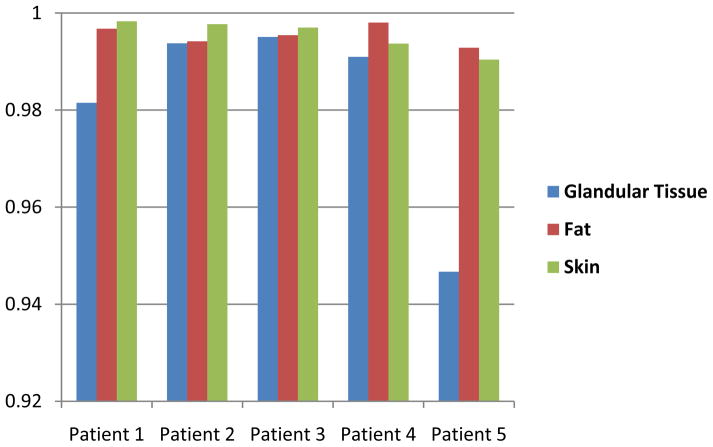
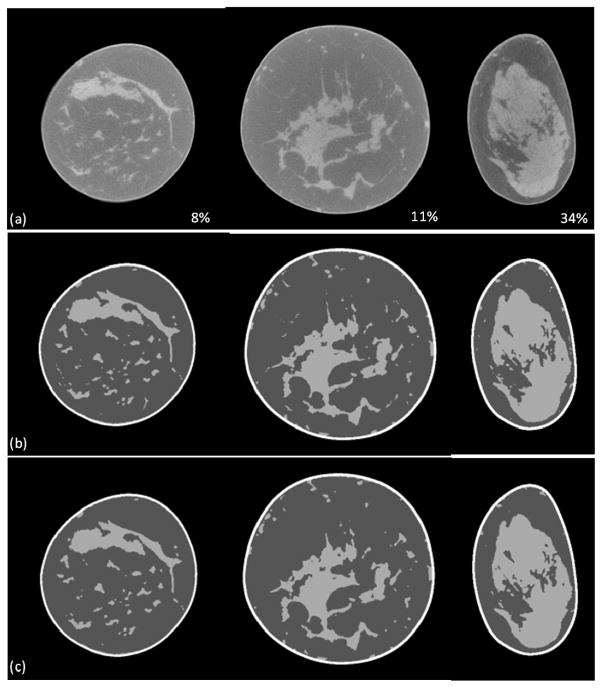
The classification method has been evaluated with five patient images. Each patient had different percentages of glandular tissue in the breast. We randomly selected three slices for each patient and manually segmented the images using a multi-threshold method to evaluate our classification results. Figure 4 shows the classification evaluation results of the five patients. The overlap ratios were more than 94. 7%. Figure 5 illustrates the visual assessment of the classification results on breast CT images with 8%, 11% and 34% glandular tissue.
Figure 4.
Overlaps ratios of glandular, fat and skin tissue for five patients.
Figure 5.
Classification results of breast CT images of three patients (a) Breast CT images of three patients who had a different percentage of glandular tissue (8%, 11%, and 34%). (b) Manual segmented results. (c) Our classified results.
4. DISCUSSIONS AND CONCLUSIONS
We proposed a classification approach for dedicated high-resolution breast CT images to classify breast tissue into three primary constituents of skin, fat and glandular tissue. A mutiscale bilateral filter was designed to process the breast CT images before classification. We compared our classified results with manual segmented results. Evaluation results demonstrated the accuracy and robustness of this method for breast CT image classification. Breast tissue classification from CT images can provide quantitative measurements for breast tissue composition, tissue density and distribution with respect to ages, which may be used for breast cancer detection and diagnosis and identification of high-risk patients.
Acknowledgments
This research is supported in part by NIH grant R01CA156775 (PI: Fei), Coulter Translational Research Grant (PIs: Fei and Hu), Georgia Cancer Coalition Distinguished Clinicians and Scientists Award (PI: Fei), Emory Molecular and Translational Imaging Center (NIH P50CA128301), and Atlanta Clinical and Translational Science Institute (ACTSI) that is supported by the PHS Grant UL1 RR025008 from the Clinical and Translational Science Award program.
References
- 1.American College of Radiology (ACR) Breast Imaging Reporting and Data System (BI-RADS) Atlas. Atlas, Reston, VA: American College of Radiology; 2003. [Google Scholar]
- 2.Carney PA, Miglioretti DL, Yankaskas BC, Kerlikowske K, Rosenberg R, Rutter CM, Geller BM, Abraham LA, Taplin SH, Dignan M, Cutter G, Ballard-Barbash R. Individual and Combined Effects of Age, Breast Density, and Hormone Replacement Therapy Use on the Accuracy of Screening Mammography. Annals of Internal Medicine. 2003;138(3):168–175. doi: 10.7326/0003-4819-138-3-200302040-00008. [DOI] [PubMed] [Google Scholar]
- 3.Boone JM, Nelson TR, Lindfors KK, Seibert JA. Dedicated breast CT: Radiation dose and image quality evaluation. Radiology. 2001;221(3):657–67. doi: 10.1148/radiol.2213010334. [DOI] [PubMed] [Google Scholar]
- 4.Lindfors KK, Boone JM, Nelson TR, Yang K, Kwan ALC, Miller DF. Dedicated Breast CT: Initial Clinical Experience. Radiology. 2008;246(3):725–733. doi: 10.1148/radiol.2463070410. [DOI] [PMC free article] [PubMed] [Google Scholar]
- 5.Sechopoulos I, Feng SSJ, D’Orsi CJ. Dosimetric characterization of a dedicated breast computed tomography clinical prototype. Medical Physics. 2010;37(8):4110–4120. doi: 10.1118/1.3457331. [DOI] [PMC free article] [PubMed] [Google Scholar]
- 6.Meyer CR, Bland PH, Pipe J. Retrospective correction of intensity inhomogeneities in MRI. IEEE Trans Med Imaging. 1995;14:36–41. doi: 10.1109/42.370400. [DOI] [PubMed] [Google Scholar]
- 7.Barrett JF, Keat N. Artifacts in CT: recognition and avoidance. Radiographics. 2004;24(6):1679–1691. doi: 10.1148/rg.246045065. [DOI] [PubMed] [Google Scholar]
- 8.Manjon JV, Lull JJ, Carbonell-Caballero J, Garcia-Marti G, Marti-Bonmati L, Robles M. A nonparametric MRI inhomogeneity correction method. Med Image Anal. 2007;11(4):336–345. doi: 10.1016/j.media.2007.03.001. [DOI] [PubMed] [Google Scholar]
- 9.Tomasi C, Manduchi R. Bilateral filtering for gray and color images. Sixth International Conference on Computer Vision; 1998. pp. 839–846. [Google Scholar]
- 10.Yang X, Fei B. A skull segmentation method for brain MR images based on multiscale bilateral filtering scheme. Proc SPIE 2010: Image Processing. 2010;7623(1):76233K. [Google Scholar]
- 11.Nelson TR, Cervino LI, Boone JM, Lindfors KK. Classification of breast computed tomography data. Med Phys. 2008;35(3):1078–1086. doi: 10.1118/1.2839439. [DOI] [PMC free article] [PubMed] [Google Scholar]
- 12.Huang SY, Boone JM, Yang K, Kwan AL, Packard NJ. The effect of skin thickness determined using breast CT on mammographic dosimetry. Med Phys. 2008;35(4):1199–1206. doi: 10.1118/1.2841938. [DOI] [PMC free article] [PubMed] [Google Scholar]
- 13.Willson SA, Adam EJ, Tucker AK. Patterns of breast skin thickness in normal mammograms. Clinical Radiology. 2001;33(6):691–693. doi: 10.1016/s0009-9260(82)80407-8. [DOI] [PubMed] [Google Scholar]
- 14.Wang H, Feyes D, Mulvihill J, Oleinick N, MacLennan G, Fei B. Multiscale fuzzy C-means image classification for multiple weighted MR images for the assessment of photodynamic therapy in mice. Proceedings of the SPIE - Medical Imaging. 2007;6512 doi: 10.1117/12.710188. [DOI] [PMC free article] [PubMed] [Google Scholar]
- 15.Wang H, Fei B. A modified fuzzy C-means classification method using a multiscale diffusion filtering scheme. Med Image Anal. 2009;13(2):193–202. doi: 10.1016/j.media.2008.06.014. [DOI] [PMC free article] [PubMed] [Google Scholar]
- 16.Guo S, Fei B. A minimal path searching approach for active shape model (ASM)-based segmentation of the lung. Proc SPIE 2009: Image Processing. 2009;7259(1):72594B. doi: 10.1117/12.812575. [DOI] [PMC free article] [PubMed] [Google Scholar]
- 17.Zhang H, Bian Z, Guo Y, Fei B, Ye M. An efficient multiscale approach to level set evolution. Proceedings of the 25th Annual International Conference of the IEEE Engineering in Medicine and Biology Society; 2003. pp. 694–697. [Google Scholar]
- 18.Dice LR. Measures of the Amount of Ecologic Association Between Species. Ecology. 1945;26(3):297–302. [Google Scholar]
- 19.Fei B, Wang H, Meyers JD, Feyes DK, Oleinick NL, Duerk JL. High-field magnetic resonance imaging of the response of human prostate cancer to Pc 4-based photodynamic therapy in an animal model. Lasers Surg Med. 2007;239(9):723–30. doi: 10.1002/lsm.20576. [DOI] [PMC free article] [PubMed] [Google Scholar]
- 20.Bogie K, Wang X, Fei B, Sun J. New technique for real-time interface pressure analysis: getting more out of large image data sets. J Rehabil Res Dev. 2008;45(4):523–35. doi: 10.1682/JRRD.2007.03.0046. [DOI] [PMC free article] [PubMed] [Google Scholar]
- 21.Fei B, Lee Z, Duerk JL, Lewin JS, Sodee DB, Wilson DL. Registration and Fusion of SPECT, High Resolution MRI, and interventional MRI for Thermal Ablation of the Prostate Cancer. IEEE Transactions on Nuclear Science. 2004;51:177–183. [Google Scholar]


