Abstract
Horizontal connections in the primary visual cortex have been hypothesized to play a number of computational roles: association field for contour completion, surface interpolation, surround suppression, and saliency computation. Here, we argue that horizontal connections might also serve a critical role of computing the appropriate codes for image representation. That the early visual cortex or V1 explicitly represents the image we perceive has been a common assumption on computational theories of efficient coding (Olshausen and Field 1996), yet such a framework for understanding the circuitry in V1 has not been seriously entertained in the neurophysiological community. In fact, a number of recent fMRI and neurophysiological studies cast doubt on the neural validity of such an isomorphic representation (Cornelissen et al. 2006, von der Heydt et al. 2003). In this study, we investigated, neurophysiologically, how V1 neurons respond to uniform color surfaces and show that spiking activities of neurons can be decomposed into three components: a bottom-up feedforward input, an articulation of color tuning and a contextual modulation signal that is inversely proportional to the distance away from the bounding contrast border. We demonstrate through computational simulations that the behaviors of a model for image representation are consistent with many aspects of our neural observations. We conclude that the hypothesis of isomorphic representation of images in V1 remains viable and this hypothesis suggests an additional new interpretation of the functional roles of horizontal connections in the primary visual cortex.
Keywords: Color tuning, multiplicative gain, feedback, boundary, surface, figure-ground, contextual modulation, response latency, color filling-in
Introduction
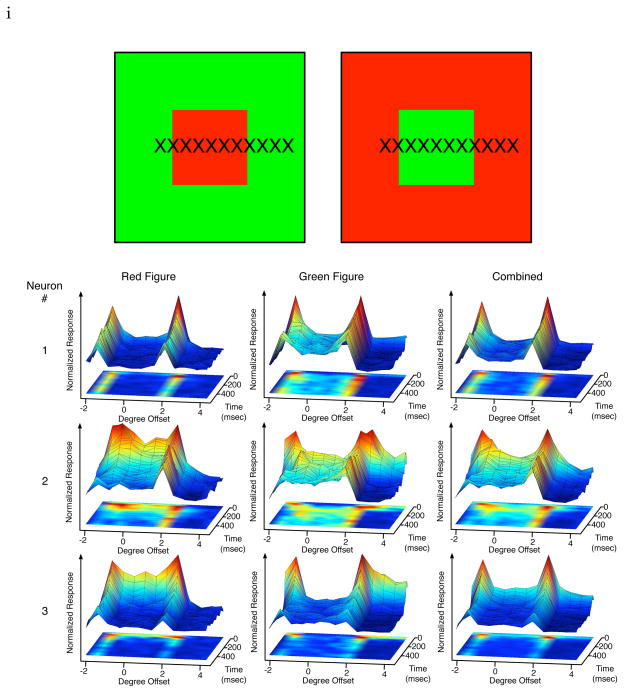
When viewing a figure of solid color or brightness as Figure 1A, we perceive a color or luminance surface. Yet, neurons in the retina and the LGN are mostly excited by chromatic and luminance contrast borders. The earliest theoretical explanation of this perception is advanced by the Retinex Theory (Land 1971), which argues that there is a process for recovering reflectance or perceived lightness within a region based on contrast signals provided by the retinal neurons. This model was implemented in 2D by Horn (1974) using an iterative algorithm with neighboring units propagating brightness measures from contrast borders. Subsequently, Grossberg and Mingolla (1985) proposed the feature contour system/boundary contour system model for V1 in which they described a diffusion-like propagation of brightness and color signals from the luminance and chromatic contrast borders to the surface interior via a synctium in the brightness and color channels respectively.
Figure 1.
A pair of complementary stimuli tested: a red figure in a green background, and a green figure in a red background. The other pair is blue/yellow figure in yellow/blue background. Crosses indicate the 12 RF locations of the neuron for each image to be sampled. The spatiotemporal response profiles of three neurons (one per row) in response to the pair of stimuli above. Each graph depicts the temporal evolution of neural responses at the different spatial locations (indicated by X). The response is normalized against the maximum response of each cell to the pair of the complementary stimuli for easy visualization. The center of the figure in the stimulus was located at 0° along the x location axis, with the borders of the figure located at −2° and 2° Temporal evolution of the spatial representations of 3 V1 cells to the red figure (4°) in the green background (left column) and to the green figure in the red background (middle column). At right, the sum of both responses.
Neurophysiological evidence for isomorphic representation, particularly in the context of color and brightness representations have recently become controversial. While some single unit neurophysiological studies (Rossi et al. 1996, Kinoshita and Komatsu 2001, and Roe et al. 2005, Huang and Paradiso 2008) yielded results that might be consistent with brightness and color filling-in in V1 and V2, von der Heydt et al.’s (2003) single unit recordings, and Cornelissen et al.’s (2006) fMRI studies argued that V1 responess did not appear to support isomorphic representation. These latter authors argued that mental representation of solid color on a surface might be inferred by the brain simply based on chromatic or luminance contrast responses in V1, without needing to synthesize an isomorphic or explicit representation of the input image or mental image in the early visual cortex. Here, we performed single-unit neurophysiological experiments and computational simulations to understand the relationship between color coding and contextual modulation and demonstrated that an image segmentation-based computational model with recurrent horizontal connections accounts for many neurophysiological observations. Our studies suggest that the dynamics of a model for simple image representation accounts for psychologically observed brightness filling-in effects in contrast to classical models based on diffusion mechanisms (Grossberg and Mingolla 1985, Arrington 1994). Taken together, these findings support a theory for isomorphic representation of perceptual images in the primary visual cortex.
Neurophysiological Methods
We will first describe our neurophysiological observations, and then present computational simulations to account for these observations. Neurophysiology was performed on two awake, behaving monkeys. Single-unit recordings were made transdurally from the primary visual cortex of the monkeys with epoxy-coated tungsten electrodes through a surgically implanted well overlying the operculum of area V1. The receptive field (RF) of each cell was mapped with a small bar and with a texture patch to determine the minimum responsive field. The receptive fields were located between 0.5° – 4° eccentricity in the lower left quadrant of the visual field and ranged from 0.5° to 1° in size, while accounting for eye movement jitter. The recording procedure and experimental setup are documented in Lee et al. (2002).
During recording and stimulus presentation the monkeys performed a standard fixation task, where they were trained to fixate on a dot within a 0.7° window on a computer monitor, 58 cm away. After stimulus presentation within a particular trial the fixation dot relocated to another random location, and the monkey was required to saccade to the new location to successfully complete the trial and obtain a juice reward. Each trial had a constant duration. The stimulus for each condition was presented statically on the screen in each trial. Conditions were repeated 20–30 times per trial and randomly interleaved.
Stimuli were presented on a Sony Multisync color video display monitor driven by a TIGAR graphics board via the Cortex data acquisition program developed by NIH. The resolution of the display was 640 × 480 pixels, and the frame rate was 60 Hz. The screen size was 32 × 24 cm. When viewed from a distance of 58 cm, the full screen subtended a visual field 32° × 24° of visual angle. One pixel corresponded to a visual angle of 0.05°.
The stimuli contained a color figure within a contrasting color background. Four contrasting color pairs were tested: red/green and blue/yellow. Fig. 1A illustrates the red-green stimulus pair. The four colors, plus the intertrial gray, were equiluminant at 7.4 cd/m2, as measured using Tektronix J17 Lumacolor Photometer/Colorimeter. Their values in CIE coordinates (x,y) are (0.603, 0.364) for red, (0.286, 0.617) for green, (0.454, 0.481) for yellow and (0.149, 0.066) for blue. In the LMS coordinate system, the cone contrast of red or blue relative to the gray is approximately the same and more than twice that of green or yellow. The colors were chosen to be as saturated as possible; subject only to the equiluminant constraint.
Note that colors used in other color tuning or color coding experiments (Conway 2001, Wachtler et al. 2003, Friedman et al. 2003) are chosen to have equal cone contrasts relative to the adapting gray. This constraint is important for assessing the contributions from the L,M,S cone inputs to the neuron in question. However, these ‘balanced’ colors tend to be unsaturated, pastel-looking in appearance and not very salient. The equiluminant colors we used were not equalized in cone contrast. Thus, the color tuning curves we obtained are not based purely on color, but subject to influence of cone-contrast as well. Our color tuning curve should be interpreted with caution in that regard.
We consider our choice acceptable for the purpose of our questions for the following reasons. First, it is well known that V1 neurons’ color preferences are fairly diverse and dispersed, covering a variety of colors, and are no longer limited to the canonical LMS cone axis (Lennie and Movshon 2005). Hanazawa et al. (2000) demonstrated that V1 cells’ color tunings exhibit preference to a variety of cues and saturation, suggesting an elaboration of color tuning to support color perception. Second, neurons we studied here exhibited a diversity of tuning preferences for the different colors, indicating that V1 neurons are not slaves of the cone-contrast sensitivity but are articulating their own preferences for different colors. The main focus of our study is the relationship between color coding signals and contextual modulation signals. For this particular focus, any set of colors that span the color space and are preferred differently by different neurons would serve our purpose.
In these experiments, we only studied neurons that exhibited sustained response when their their localized receptive fields were fully contained within a uniform (solid) color region. The waveform of the spikes had a SNR of at least 1.5 in peak-to-peak amplitude relative to the background noise. The analysis here is based on single-unit and multi-unit activities. Single units and multi-units are analyzed and reported separately in some cases (Figure 5). If we could not qualitatively distinguish the behavior of single-units and multi-units, we lumped them together in population analysis. Many cells responded well to oriented bars but not to uniform color surfaces. These neurons were also omitted from this study. The color-sensitive cells studied here were about 15 percent of the cells encountered. These cells respond vigorously to chromatic edges and chromatic surfaces. We found a tendency for cells with the same color preference to cluster together in a given recording penetration. For example, in one single session, we would encounter many blue cells, while in another session, we would encounter many red cells.
Figure 5.
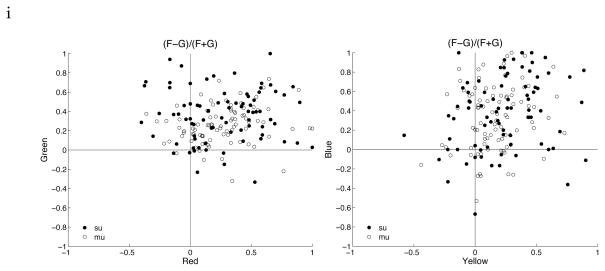
Scatter plots of figure-enhancement for the four colors. Red and Green (left graph). Yellow and Blue (right graph). Substantial and significant figure enhancement effect is observed for all colors.
Spatiotemporal Dynamics of Neural Responses to Color Stimuli
We first studied the spatiotemporal dynamics of neural responses to stimulus images that contain a 4° × 4° solid color figure against a contrasting equiluminant color background (Fig. 1 top row). One stimulus image contains a red figure in a green background while the other contains a green figure in a red background. Each image was presented statically on the screen for 350 msec in each trial. The image was shifted spatially over successive trials, placing the figure at one of the 12 locations relative to the receptive field at 0.66° or 1° intervals, spanning a range of over 10° (as shown in Fig. 1A). This allows monitoring the temporal evolution of the neuron’s response to each particular spatial location of the image, analogous to Lamme (1995) and Lee et al. (1998)’s spatial sampling experiments on texture stimuli.
Fig. 1 presents the temporal responses of three representative V1 neurons to 12 different spatial locations of each of the image pairs shown. Neurons tended to exhibit strong and sustained responses at the boundary, but many cells also exhibited weak sustained responses to the solid color surface where there were no contrast features within the receptive fields. At 2–4° eccentricity, the sizes of the receptive fields were typically less than 1° in spatial extent. Thus, the figure was at least four times the diameter of the receptive field of the tested neuron.
Each row represents the spatiotemporal response of a neuron to the red figure green ground stimulus (first column), to the green figure red ground stimulus (second column), and the sum of the responses of the first two columns at each corresponding location. The first neuron (row 1) showed significant responses at the boundaries of both figures and inside the green figure, but weaker in the green background and less in the red figure and red ground. When the two spatiotemporal responses are combined (third column), there is significantly more response inside the figure than the background despite the neuron’s response to red and green stimuli in both the figure and ground cases. This cell is said to exhibit a figure enhancement effect.
The second neuron (row 2) showed sustained response to both the red and green figure surfaces, and little response to the ground regardless of color. Interestingly, even though the neuron responded strongly to both edges of the figure for both stimuli at the beginning, over time its peak response was localized to the right border of both color conditions. This describes von der Heydt and colleagues’s border-ownership cell, i.e. this cell signalled which side of the border of a figure it was analyzing. Two interesting effects shown here depart from their earlier observation (Zhou et al. 2000): (1) the cell also responded to the figure more than the background, thus exhibiting both figure enhancement effect as well as border-ownership effect; (2) the cell responded initially to both borders, the border ownership signal emerged at the later part of the response.
The third neuron (row 3) initially showed a general preference to red but later develops a stronger response to the green figure (first and second columns). This is another case of the figure enhancement effect without a strong sustained response at the borders.
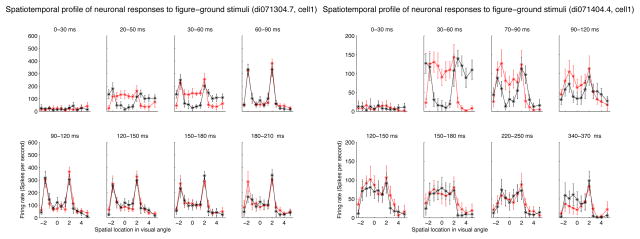
These are just some special examples. We now summarize our general observations of the population of cells’ responses. First, the transition from gray screen to color figure produced a temporal chromatic contrast signal that elicited a fast initial neural response. Although the stimuli were equally luminant as the gray screen, the different color sensitivites of retinal cones provided a differential bottom-up response to the V1 neurons. Secondly, in the later part of the responses, at a maximum of 100 msec after stimulus onset, the neurons exhibited preferences to the different colors inside the figure and ground, independent of the initial bottom-up response. Some neurons preferred red, while other neurons preferred green in the later part of their responses. Thirdly, we found many neurons’ responses were stronger when their receptive fields were inside the figure than when their receptive fields were inside the background. This is evident in the first two neurons shown in Figure 1. Figure 2 shows the spatial response profile of these two neurons in different time windows post-stimulus onset to illustrate more precisely the strong initial responses at the boundary, and the subsequent differential response between the 4-degree figure (between −2 and 2 along the x-axis) and the background.
Figure 2.
Two neurons’s spatial response profile to the two stimuli in Figure 1 in different time windows. Red curves were the responses of the neurons to red figure in a green background, and black curves were the responses of the neurons to a green figure in a red background. The complete reversal of the spatial response profile of the second cell shows it was driven more strongly by the red background in the beginning and more strongly by the green figure later, and exhibited a sharp discontinuity between the response inside the figure and the response outside the border.
Figure Enhancement Contextual Modulation
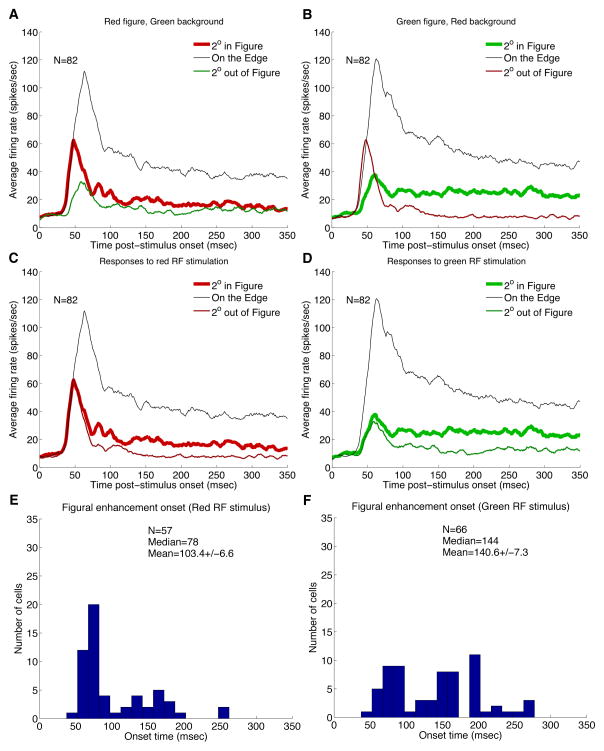
The differential response of the neurons to figure and background in these color stimuli is analogous to the figure enhancement observed by Lamme (1995) on texture figures. Fig. 3 shows the population averaged responses of 82 V1 single-units and multi-units in response to three distinct regions (the figure center, the figure border, and 2° outside the figure border) of the two test stimuli shown in Fig. 1. Each cells’ peri-stimulus time histogram (PSTH) was smoothed with a 10 msec window before population averaging. The population responses were initially stronger for the red figure than for the green background (Fig. 3A), and were initially stronger for the red background than the green figure (Fig. 3B). These results indicate that the red stimulus, or more precisely, the transition from gray to red, might be a more potent bottom-up stimulus. However, over time, the later part of the population PSTH was stronger in the green figure than in the red background (Fig. 3B). Thus, the sustained neural activity in the later response is stronger inside the figure than the background, regardless of the color of the receptive field stimulus. This is a rather dramatic effect and was not observed in neural responses to texture stimuli (Lamme 1995, Lee et al. 1998).
Figure 3.
(A,B) Population responses of V1 neurons to three specific locations of each one of the complementary stimulus pair. (C,D) Population responses of V1 neurons to same RF color stimulus in the figure or the ground context. Border response is also shown for reference. (E,F) Distribution of the figure enhancement onset time for red surface and green surface.
Figs. 3C and 3D compare the average temporal response of this population to the same receptive field stimulus (red or green respectively) in the figure (center) condition and in the background condition (2 degrees outside). The responses to the figure and the background conditions begin diverging significantly at 70 msec for red and 66 msec for green. We assessed the figure enhancement onset time for each neuron by performing a running T-test with a window of 20 msec, starting with stimulus onset, to determine when the responses (across different trials) at the figure center became greater than the responses in the surround with statistical significance (with a p ≤ 0.05). To make the estimation robust against noise, we additionally required the enhancement be statistically significant for at least 70 percent of the subsequent 20 windows, shifted by 1-msec step.
The ‘figural enhancement’ response, as observed by Lamme for texture stimuli, is an enhancement in response for identical receptive field stimulus within the figure than when in the background. However, this effect for color figure stimuli is much greater than that for texture stimuli (Lamme 1995, Zipser et al. 1996, Lee et al. 1998, Rossi et al. 2001). The onset time of the figure enhancement effect for color stimuli could be as early as 50–60 msec, but on average emerge in the later part (approximately 100 ms post-stimulus onset) of the response (see Figure 3E and 3F).
Figure Enhancement and Color Selectivity
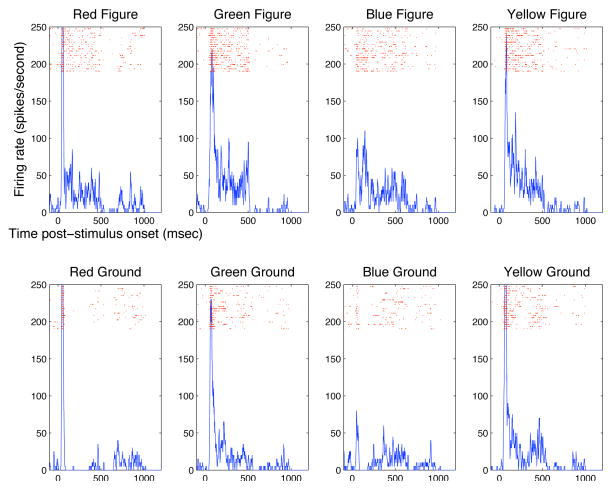
To evaluate the figural enhancement effect as a function of color, we measured 81 (54 from monkey D, and 27 from monkey B) V1 single and multi-units’ responses to the four colors (equiluminant red/green and yellow/blue stimuli) when the receptive field was at the center of the figure and in the background (5° away from the figure’s border). Responses to equiluminant gray screen was used as baseline. Figure 4 shows a typical neuron’s response to the four colors in the figure condition (first row) and the ground condition (second row). It can be observed that the neuron’s responses when its receptive field was inside the figure was significantly stronger than its responses when its receptive field was in the background, for all four colors.
Figure 4.
A V1 neuron’s response to the four colors in the figure condition (first row) and the ground condition (second row). This neuron cell prefers yellow the most, but also responds considerably to blue. Comparing the first row (responses when the cell’s receptive field is inside the color figures) and the second row (responses when the cell’s receptive field is in the background with the same color as the the figure’s color in the first row), we found the responses were stronger in the first row than the second row for each corresponding color (column), even though the stimuli over the receptive field were identical for each column. The receptive field diameter was 1 degree and was “looking at” the center of a figure of 4-degree in diameter.
To compare the figure enhancement effect observed in color figures with data from earlier texture studies (Lamme 1995, Zipser et al. 1996, Lee et al. 1998, Rossi et a. 2001), we computed the figure enhancement index for each color as (F−G)/(F+G), where F is the response of the cell inside the figure of a particular color, and G is the response inside the background of the same color. Figure 5 shows the scatter plots of the figure enhancement indices for the four colors, with single units labeled in solid dots and multi-unit labeled in empty circles. The results from single units and multi-units are basically the same for this measure, so we lumped them together. The mean figure enhancement indices in this population of V1 neurons are 0.26, 0.36, 0.24, 0.38 for red, green, yellow and blue figures respectively, which are much stronger than the mean figure enhancement index (about 0.1) observed in V1 for texture stimuli (Lee et al. 1998). We found 51% of the cells showed significant enhancement for all four colors, 27% for three, 16% for two, 6% for one color only. Thus, the figure-enhancement effect observed in solid color figures is significantly stronger than the effect observed for texture stimuli.
While many of our recorded cells tend to respond more strongly to red or blue than to green and yellow, their preference changes to different colors in the later part of their response. Fig. 1 and Fig. 2 show examples of single-cells and Fig 3B shows population averages that initially responded predominantly to red ground and later to green figure. This later dominance of response to the green figure over red background in Figure 3B can arise from a stronger response inside the figure due to figure enhancement and/or a development of a preference for green color in the same neurons.
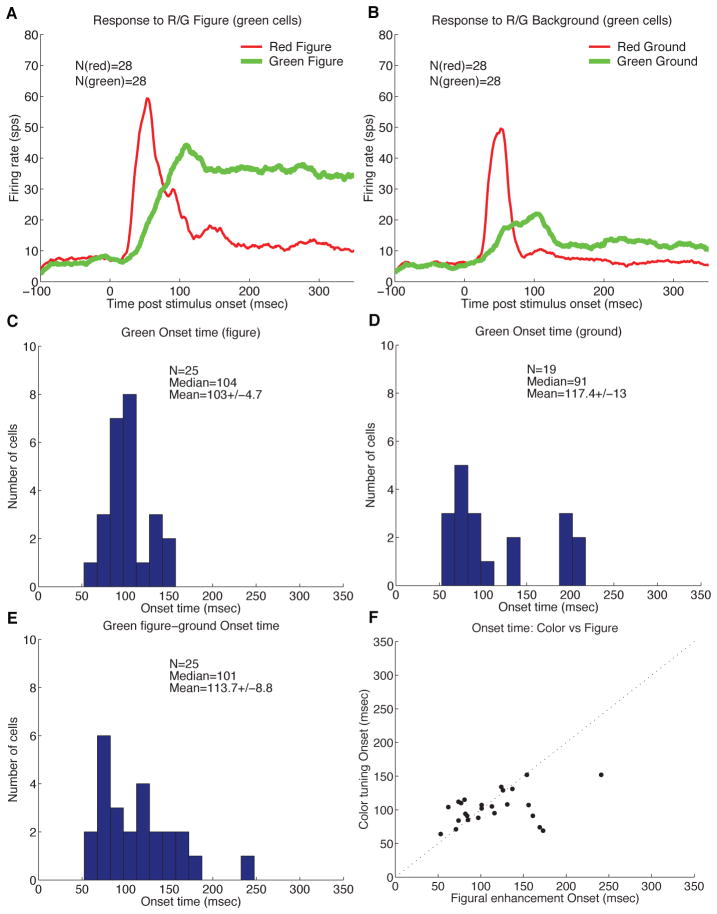
To separate the effects of figure enhancement and color preference, we analyzed the neuronal responses to red and green in either the figure context or the background context separately. We separate the cells into groups depending on their color preference based on the later part of their responses to the different colors in the figure condition. The responses of the neurons that ultimately prefer green over red are the most revealing, as shown in Figure 6. Among these 81 neurons, 25 exhibited preference for green over other colors in the later part of their responses. From their population PSTHs in response to red and green figures (Fig. 6A), and red and green backgrounds (Fig. 6B), in both cases we observed that the response to the green surface became greater than the response to the red surface at about 90 msec. We estimated the contextual color preference onset for each of the green-preferring cells, based on the time its response to green overtook its response to red, using the same running T-test used for estimating figure enhancement onset. Fig. 6C and 6D show the distribution of the contextual color tuning onset (based on green-red crossing), yielding a mean of 103 msec for the figure condition, and 117 msec for the background condition.
Figure 6.
(A,B) Population average PSTHs of 25 green cells in response to the green figure versus the red figure (A), and to the green ground versus the red ground (B). (C,D) Distribution of onset of contextual color tuning in these green neurons in the figure condition (C) and the ground condition (D). (E) Distribution of onset timing of the figure enhancement effect for these green neurons. (D) Comparison between the figure enhancement onset and the contextual color tuning onset.
We take this later onset of preference for green, or other colors, over red, as evidence for the articulation of color preference in V1 neurons happening in the later part of their responses. We computed likewise the figure enhancement modulation onset for this population of neurons. The distribution of figure enhancement effect (Figure 6E) shows a mean of 113 msec (median = 101 msec), comparable to the distribution of color tuning onset time observed above. Fig. 6F compares the color tuning onset and the figure enhancement onset estimated for each neuron. Except for three or four neurons, whose figure enhancement onset was significantly delayed relative to color tuning onset, the figure enhancement and the color tuning appeared to emerge almost simultaneously for most neurons inside the 4° × 4° figure, lagging behind the border response by 70 msec.
We found the neurons’ preferences for color in the later part of their responses were diverse, preferring different colors. Figure 7 shows example tuning curves of four neurons preferring the four distinct colors in both the figure and the background conditions. Among the 81 selected color sensitive cells studied, 17 of them preferred red, 36 cells preferred green, 28 cells preferred yellow, and 18 cells preferred blue. However, the 17 ‘red’ cells and the 36 ‘yellow’ cells have 6 cells in common, i.e. these cells prefer red and yellow almost equally (‘orange’ cells). Similarly, there were 13 cells (‘yellowish green’ cells) shared by the yellow cells and the green cells, 8 cells (’cyan’ cells) shared by the green cells and the blue cells, and 6 cells (’magenta’ cells) shared by the blue cells and red cells. The remaining 15 preferred antagonistic colors – (red and green) or (blue and yellow). The final set preferred one or two (non-opponent color) of the four colors strongly over the rest. For neurons that were sharply tuned to one of the four tested colors, most exhibit similar color tunings in figure and ground conditions. For neurons that were more broadly tuned in either condition, over half exhibited some changes in the color preference between the figure and ground conditions.
Figure 7.

Examples of color tuning in four individual neurons, preferring one of the four colors. The thick line is the color tuning in the figure condition while the thin line is the color tuning in the ground condition. Typically, the cells exhibit enhancement when they are in the figure condition than when they are in the ground condition, for their preferred as well as less preferred colors.
Overall, the neurons we studied appeared to be tuned to a spectrum of color, as described in Hanazawa et al. (2000).
Timing and Contribution of Contextual Modulation
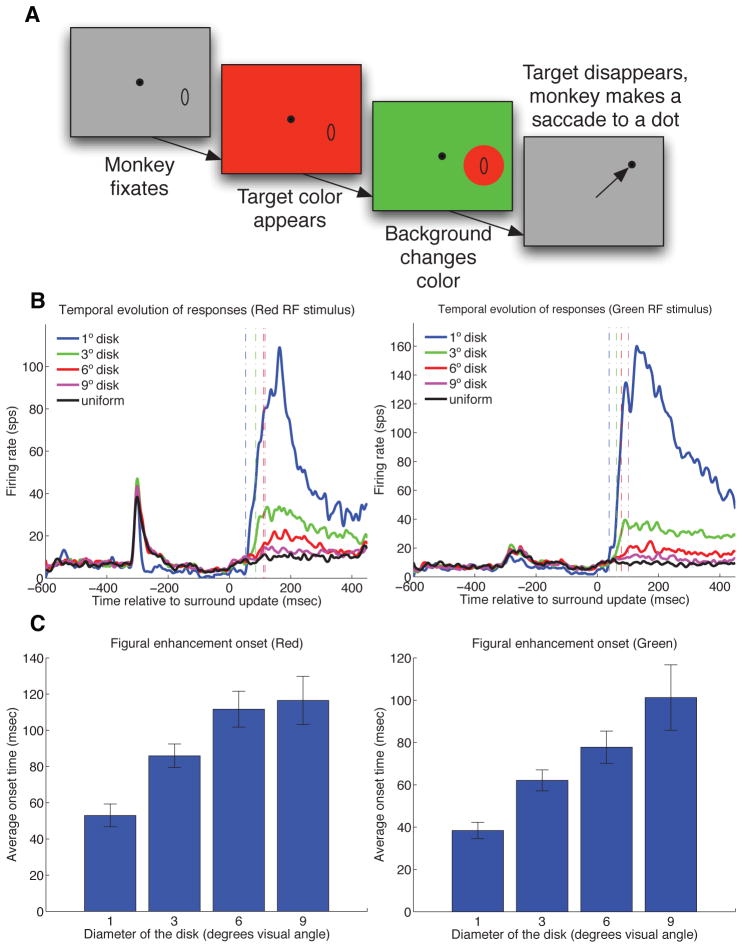
The articulation of color tuning and the figure enhancement effect appeared to emerge at the same time, with an average latency around 80–100 msec. This was significantly later than the responses to the boundary (30–50 msec), and therefore might involve contextual modulation. To what extent are the neural responses to color surfaces due to receptive field stimulation or contextual modulation? To separate receptive field effect and contextual effect, and to measure the time course of the contextual modulation more precisely, we designed the paradigm as shown in Fig. 8A to decompose the receptive field stimulation and the contextual modulation. An additional 55 neurons were tested, drawn evenly from the two monkeys.
Figure 8.
(A) Asynchronous update paradigm. The entire screen was turned red at −350 msec, followed by the appearance of a green background surrounding the RF at 0 msec, making visible a circular red disk over the RF. (B) Population PSTH of cells responding to red figure (left panel) and green figure (right panel) of different diameters (1, 3, 5, 9) as well as full color screen. Surround update occurred at 0 msec. Only 12 cells were recorded for the 1 degree figure later on in this experiment to provide a reference for the onset of boundary response. All other sizes were tested with 55 neurons. Note that the graph of the average response to the 1 degree figure appeared to be different from those for the other sizes after the first update even though the stimulus is identical. This is because the average is based on 12 neurons, while the others are based on 55 neurons. (C) Mean response onset to ‘red figure’ subsequent to surround update as a function of the figure’s diameter (left panel). Mean response onset to the ‘green figure’ (right panel).
In each trial, while the monkey fixated, the color of the full screen was first changed from gray (which was presented between trials) to one of the four colors; 350 msec later, the region outside and surrounding the receptive field of the neuron was abruptly changed to a contrasting color, making visible a disk figure over the receptive field without changing the receptive field stimulus. Figures of four sizes (1, 3, 6, 9 degrees in diameter) were presented across trials. Each remained on the screen for 400 msec.
When the entire screen changed color in the first update, V1 neurons typically gave a transient weak response followed by a weak sustained response. When the surround changed to another color in the second (surround) update, the neurons gave a strong and sustained response, even though nothing was changed within the receptive field or in its proximal surround. This response to the contextual stimulation is in fact much stronger than the direct receptive field stimulation in the first update, as shown in the PSTHs in Fig. 8B.
The responses to the second (surround) update (at 0 msec) were sustained and were statistically significant (relative to the baseline) for 27 cells for the 3-degree figure, 20 cells for the 6-degree figure, and 17 cells for the 9-degree figure. The strength and sustained nature of this signal suggests that much of the sustained neural responses to color surfaces in our first experiment in fact came from contextual modulation.
For the 1 degree figure the chromatic contrast border in the second update likely encroached on the receptive fields of the cells, leading to rather rapid responses (53 msec response onset for red figure, and 36 msec for green figure estimated population PSTH). For the larger disks, the chromatic borders were outside and relatively far away from the receptive fields of the cells. The spatial extent of all the receptive fields was less than 1 degree in diameter. We found the onset of this contextual response was increasingly delayed with an increase in the size of the disk, or the distance of the chromatic border. The mean onset time of the contextual responses, estimated based on the cells that showed measurable and significant responses, were 86, 112, 116 msec for red figure of 3,6,9-degree in diameter, 62, 76, 101 msec for green figure, 81, 100, 107 msec for yellow figure, and 67, 93, 115 for blue figure respectively.
This response onset time metric is often used in physiological experiments (Maunsell and Gibson 1992, Huang and Paradiso 2008) to estimate response onset, and corresponds well to the time at which such percept is detectable in humans. Sometimes, it is used to infer propagation delay (Huang and Paradiso 2008). However, it is really just the time relative to stimulus onset at which the responses to the contextual modulation became statistically discernible from the baseline activities. We believe amore apt name should be “detectable response” time, as a slower detectable response time could arise from an input arriving at the cell later, or the input signal being weak and thus taking longer to integrate to threshold. We explored various ways to distinguish the two scenarios but could not come to a solid conclusion. We found there was a delay of 14 msec between the peak response time to the 6-degree figure relative to that of the 3-degree figure, but the estimated peak time for the 9-degree figure was actually shorter than both. In any case, whether the detectable response delay is due to slower arrival of input or a weaker input is not crucial from the perspective of our theoretical framework to be discussed next.
Theoretical model of image representation
What is the nature of the contextual modulation signal coming from the chromatic contrast border? One can argue that in this second experiment (Figure 8), the neural code for color should have been established after the first update, since the screen was readily perceived as red before the second update took place. Thus, the wave of strong contextual modulation should not be signaling color, but representing something different such as figure-ground segregation or perceptual saliency that modulates the color codes. This reasoning rests on the implicit assumption that uniform brightness or color are represented by spatially uniform neural activities in neurons of a particular chromatic or brightness channel. Such an assumption is not necessarily correct.
We will now discuss a model that suggests that activities of the neurons for representing an image could change as a function of the global image as a whole, even though the receptive field stimulus of the neurons remains constant. We call this the image representation model (Daugman 1988, Lee 1996), which assumes faithful image representation is an objective of the primary visual cortex. Such a model is also the basis of sparse coding in development or learning of the simple cell receptive fields in V1 (Olshausen and Field 1996). This model prescribes that V1 simple cells, modeled as an overcomplete set Gabor wavelets, can be used to synthesize or represent any arbitrary image (Daugman 1988, Lee 1996):
| (1) |
where n is noise or factors unaccounted for. The represented (input or perceived) image Î attempts to explain the input image I(x, y) as a linear weighted sums of wavelets. The weight ai of each wavelet φi (presumably the firing rates of simple cells) are obtained by minimizing the following objective function, which is the squared error of how well these weighted sum can explain the image (Eq. 2),
| (2) |
The φ is related to the synthesis basis of a simple cell, which is complementary to the conventional filter notion of receptive field, and ai the cell’s firing rate. It has been shown that the filters and the basis derived from independent analysis resembled the receptive fields of V1 neurons.
The Gabor wavelet representation that we used, as in the brain, is overcomplete (Lee et al. 1993). Hence, the initial responses ai of the cells, computed from receptive field linear filtering, produce a highly redundant representation, even though individually they can be learned based on the sparseness principle. We can adjust ai of all the neurons over time to reduce the redundancy of the representation by minimizing the squared error above. This can be accomplished by taking the partial derivative of E with respect to ai and obtain the following descent equation,
| (3) |
The first term of the descent equation (Eq. 3) specifies the feedforward input to the neuron based on its receptive field, which is given by the dot product between the receptive field and the input stimulus. The second term specifies that the interactions between neuron i and any other Gabor wavelet neuron depends on their redundancy, or overlap in their receptive fields. That is, two neurons will inhibit each other when the dot product of their ‘receptive fields’ are positive, and facilitate each other when the dot products of their ‘receptive fields’ are negative. When their receptive fields are orthogonal, i.e. zero dot product, there will be no interaction between them. Note that the interactions in this model are strictly local, between neurons of overlapping receptive fields. Association fields for contour completion is not considered in this model. The second term can be interpreted and implemented by horizontal connections between the neurons. As the error function is convex, simple gradient descent can be used to compute ai that minimizes the error. Here, we assume the number of iterations can be compared qualitatively to the time elapsed post-stimulus onset.
The implemented model consists of a retinotopic map of cortical hypercolumns covering an input image of 192×192 pixels. We do not model the change in retinal or cortical receptive field size as a function of eccentricity, i.e. the spatial resolution is assumed to be uniform across the retinotopic map. The pixel intensities of the input image were rescaled to max (white) of 127.5, min (black) of − 127.5 and mean (gray) of 0. The image was represented by a set of Gabor wavelets specified by (Eq. 4), as in Lee (1996). The Gabor wavelets were constrained to a single scale with 8 orientations, at 22.5° intervals. In each orientation, the Gabor filters exist in both even and odd-symmetric forms, with zero d.c. response (Lee 1996).
| (4) |
For simplicity, we only used the model with the single (finest) scale, with a spatial sampling of 2 pixels, spatial frequency of 0.314 pixels, spatial frequency bandwidth of 3.5 octaves, and two spatial phases, i.e. even and odd symmetric Gabor wavelets, which is sufficient to represent uniform luminance images. We have also tried multi-scale representations as in Lee (1995) and found the results to be qualitatively similar.
These zero-dc wavelets, in both sine and cosine varieties, will have zero feedforward responses to uniform luminance or color stimulus. Yet, this set of overcomplete wavelets are known to be able to represent arbitrary images, we want to know how this could be done and what the activity ai would be in order to represent the uniform luminance or color surface.
Without loss of generality, we considered the luminance Gabor wavelets here, and tested the responses of the neurons to a disk of uniform luminance. We examined the spatial and temporal evolution of the synthesized image Î, the wavelet coefficients, as well as the sum of the absolute values of wavelets of both sine and cosine varieties. The represented images were rescaled to 8-bit, grayscale, pixel intensities. Individual hypercolumn responses represent the average magnitude response of all the wavelets φi at each scale populating that corresponding spatial location.
Our conjecture is that the spatiotemporal profile of neural responses observed in experiments can be understood in terms of the spatiotemporal profile of the wavelet coefficients (or its absolute value) for representing the luminance disk.
Filling-in and Image Representation
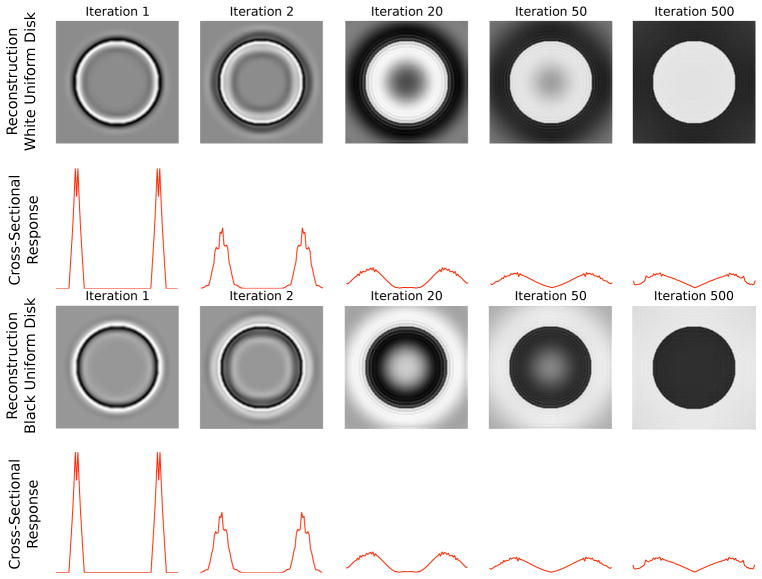
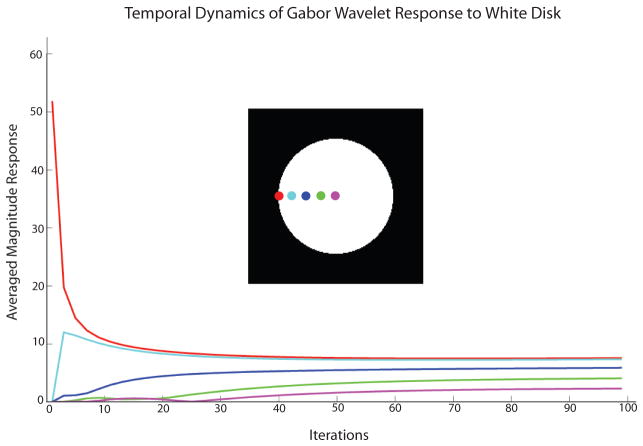
Fig. 9 shows that a white disk and a black disk can be represented by these zero-dc wavelets, and the ‘neural activities’ required to accomplish the representation. The temporal evolution of the synthesized image Î(x, y) shows first a representation of the contrast border of the white disk, followed by a filling-in of brightness in the surface of the disk. To examine the evolution of total neural responses within each hypercolumn at different spatial locations across a cross-section of the disk along midline that accompany the evolution of the represented image (Fig. 9), we summed the absolute values of the coefficients of Gabor wavelets (all orientations, even and odd-symmetric) at each location. Note that all these neurons are orientation tuned with zero dc components. Over time (iterations), the coefficients (firing rates) can be adjusted so that these Gabor wavelets can represent the disk perfectly. This simulation shows that even though a uniform brightness disk is represented at the end, the sum of neural activities across the hypercolumn is not uniform across space.
Figure 9.
Sum of responses of neurons at all orientations at each position along the horizontal midline to show the temporal evolution of the population responses. The white and the black disks excited complementary sets of neurons. but the total population responses to the two stimuli were equal. There is a gradual decrease in response away from the border toward the center in most neurons.
It is interesting to note that the temporal evolution of the synthesized image by gradient descent through network interaction exhibit the same brightness filling-in dynamics observed by Paradiso and Nakayama (1991) in their psychophysical experiments. The final column is illustrative of the fact that a uniform luminance disk can be represented by these population of wavelet neurons with a distribution of coefficients that emphasize on the edge over the interior, which become a bit more smoothed over time. The response plotted here is the sum of neurons of all orientations at each spatial location, and is comparable to the observations in Cornelissen et al.’s (2006) fMRI study, in which every voxel was the BOLD signal that reflect the sum of activities of all neurons in the voxel.
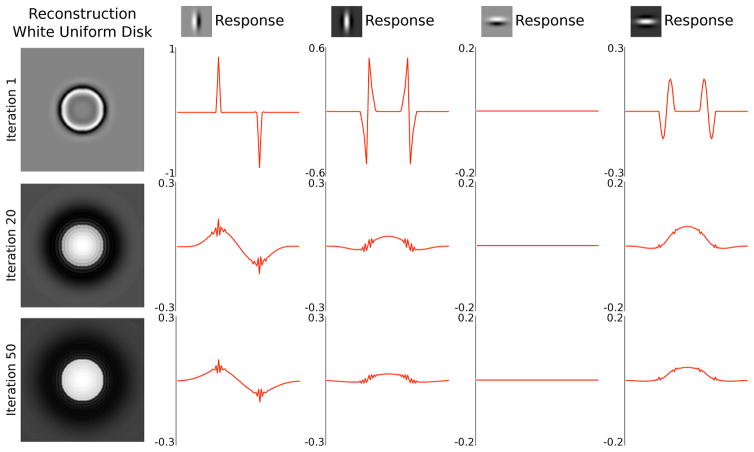
Figure 10 dissects this population response, plotting only the responses of vertical and horizontal selective neurons, each of the even and odd symmetric varieties (receptive fields are shown in the icons). The figure was also made smaller than that in Figure 9. It reveals that the odd symmetric vertical cells are responsible for the lion share of the representation. Their responses started with sharp edge responses that spread out over time. The even symmetric neurons, of both vertical and horizontal orientation selectivities started out with edge responses but exhibited uniform enhancement (or responses) inside the bright disks later on. Note that here the on-center even-symmetric cells exhibited the enhancement in this example of a bright disk, while the off-center even-symmetric cells would exhibit the enhancement inside the figure in response to the black disk stimulus. Complex cells can be modeled as the sum of the absolute or squared values of simple cells of 4 phases for each orientation and exhibit enhancement within the figure.
Figure 10.
Neuronal responses to the white disk at 1st, 20th and 50th iterations are separated into the vertically oriented odd-phase (second column) and even-phase (third column) neurons’ responses and the horizontal odd-phase (fourth column) and even-phase (fifth column) neurons’ responses. The response has both positive and negative components. It is understood that the positive components are carried by the neurons with the receptive field shown, while the negative components are carried by the neurons with complementary receptive fields, i.e. with 180 phase shift, comparable to on and off-center cells in the retina. It shows that the odd symmetric filters carry the lion share of response and strong edge responses spread over time away from the initial border responses, while the responses of the even symmetric filters exhibit stronger responses inside the figure in the later part of the responses. This positive even symmetric neurons exhibit an increase in response inside this bright disk figure, and the negative even symmetric neurons will exhibit an increase in response inside the black figure. Thus, figure enhancement response can be observed in the even symmetric neurons, while the odd symmetric neurons exhibit edge response spreading that is slightly stronger inside the figure as well.
Temporally, strong response was observed at the contrast border of the disk immediately after stimulus onset, which rapidly declined and approached steady-state over time. The latencies to achieve steady state response by the surface hyper-columns monotonically increases with distance from the border to the center. The steady-state average magnitude response of the cross-sectional hypercolumns also decreases with increasing distance from the border (Fig. 11), as we observed in our physiological data. When we made the size of the disk smaller (comparing Figure 9 and 10), the convergence to steady state was more rapid, and the responses inside the figure also became more elevated relative to the responses of the background (see Fig. 10). Thus, the magnitude of the responses the neurons with their receptive fields at the center of the disk will decrease, and detectable response onset latency increases as the size of the disk increases, as observed in our second experiment.
Figure 11.
The responses of the simulated neuronal population at each spatial location relative to the contrast border, sum of absolute values of wavelet coefficients of wavelets of different orientations and phases at each location, show that as the distance away from the border increases, the response onset increases, and the magnitude of the responses decreases, as also observed in our single and multi-unit data.
The progressive delay of detectable response onset to color figure in our experiment and in our simulation as a function of size of the figure is similar to what Huang and Paradiso (2008) found for luminance disks in their study. Huang and Paradiso (2008) tested the responses of V1 neurons to the center of a white disk in a black background. As they changed the size of the white disk, the onset of the neurons’ detectable responses became progressively delayed. They interpreted this effect as ‘brightness’ filling-in. However, without also testing the neural response to a black disk in a white background, one cannot be certain whether the delayed neural responses observed inside the figure was coding brightness or coding figure enhancement. Furthermore, they do not have an explanation of why a larger disk of the same brightness will be represented with neural responses of smaller magnitude.
Our simulation resolves these issues by showing that neural activities for representing uniform brightness can exhibit a similar figure-size dependency and the same detectable response onset delay. Thus, the contextual modulation signals Huang and Paradiso (2008) observed might indeed be representing brightness filling-in as in Paradiso and Nakayama (1991) and the contextual modulation signals we observed might be representing color filling-in. However, our image representation model suggests that this filling-in phenomenon is not necessarily mediated by a “diffusion mechanism” advanced by earlier models (Grossberg and Mingolla 1985) but simply results from a computational process for constructing a mental image to match the input image. Because all the connections and computations are local in this model, the contextual effect appears to propagate from the border. However, in such a network, after the first iteration, all the neurons will experience changes in input and respond simultaneously. That is, within one synaptic time, the membrane potential of all the neurons will experience some input. Neurons closer to the border will receive stronger input. Significant or detectable changes would appear to exhibit a propagation-like effect both in neural measurement and in psychophysical measurement, but the underlying mechanism does not have to be a diffusion mechanism.
Figure Enhancement and Image Representation
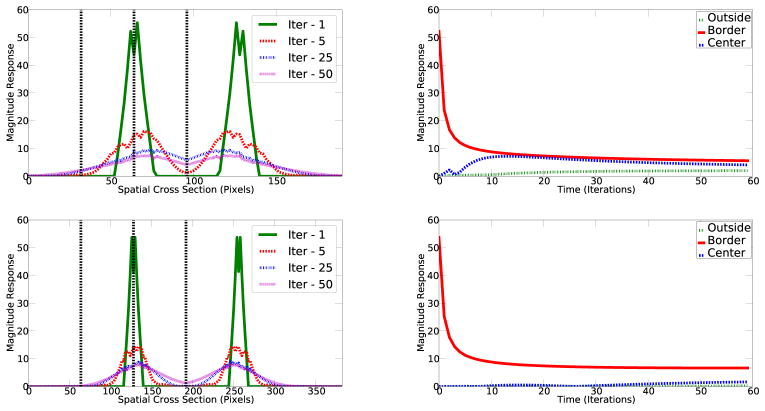
We next investigated to what extent the model for image representation can explain the figure enhancement effects shown in Figures 1–3. We plotted the sum of all the cells’ responses (i.e. the absolute values of the responses of all Gabor wavelets) at each location along the midline cross-section of the image containing the white figure. Absolute values are taken because Gabor wavelets can have positive and negative responses, in reality each wavelet is represented by two cortical neurons, similar to ON and OFF-center retinal ganglian cell representing the negative and positive of a Laplacian of Gaussian filter. Figure 12 shows the temporal evolution of the spatial response profile of the neuronal population along the cross-section. It shows significant boundary response and an increase of the responses at the interior of the figure over time, as observed neurophysiologically. One distinction between the simulation and experimental result is the gradual spread of boundary responses outside the figure, just as Cornelissen et al. (2006) observed in their fMRI study. Figure 12 (right column) plotted the temporal evolution of all cells at the border, at the figure center and background equidistant to the border. We observed a strong figure enhancement effect, parallel to the results in Figure 3.
Figure 12.
Left: The temporal evolution of spatial response profile in response to a white disk in a black blackground. The response is the combined absolute response of all the neurons to different parts of the image. Top row: Figure size 64 × 64 pixels in diameter in an image of 192 × 192. Boundary at pixel location 64 and 128. Receptive field wavelength is 10 pixels. Bottom row: Figure size 128 × 128 pixels in diameter in a 384 × 384 image. Boundary at pixel location 128 and 256. Right: The temporal responses at the center of the disk, the border of the disk, and outside the disk at a point at the same distance from the border as the disk center, indicated by the three dotted vertical lines on the corresponding left graphs.
The global population response, as measurable by fMRI, is different from single unit recording results in one important aspect. Lamme (1995) showed that the figure enhancement response exhibits a sharp discontinuity across the figure-ground boundary (see Figure 1–2, also Lee et al. (1998)). In single-unit recordings, we considered neurons of one orientation at a time, this sharp discontinuity in figure-ground enhancement can be produced in the vertical and horizontal neurons. It is not difficult to see how the vertical and horizontal simple cells’ responses shown in Figure 10 can be used to generate complex cells’ responses that will have boundary responses as well as a sharp discontinuity between the responses inside and outside the figure.
Thus, we demonstrated that almost all aspects of the contextual figure-ground modulation effects observed for uniform chromatic figures at the population level such as figure size dependency, border-distance dependency, delay onset, enhancement inside the figure relative to the background can be observed in this model, at least qualitatively, without evoking additional processes and representations. It is very possible that the figure-ground enhancement effect observed in texture stimuli (Lamme 1995, Zipser et al. 1996, Lee et al. 1998), and very similar classical surround suppression effect observed in sinewave grating are related as both of which exhibit a decrease in response with an increase of similar featuers in the surround. It will be interesting to explore whether these effects can be explained by the image representation model.
Redundacy Reduction and Sparse Code
A puzzle concerning the notion of redundancy reduction in our model is that the model’s neurons initially give a sparse response to the uniform disk, but as the model iterates, more neurons become active as more Gabor filters are required to represent a uniform field. This is a necessary consequence of the image representation framework when using Gabor filters, and it could be a good model for neural responses, but is confounded by the notion of redundancy reduction when the sparse code is shifting to a distributed code. Redundancy reduction in this model is not entirely equivalent to a sparse code. The Gabor wavelet codes we used, as well as the representation of simple cells in V1, are highly overcomplete (Lee 1996). This results in the same image being represented multiple times redundantly. The lateral inhibition between neurons representing the same information helps remove this redundancy. Individual Gabor filters are sparse such that they efficiently capture and represent an independent cause (e.g. an edge) in natural scene images and their responses follow a Laplacian distribution. This response profile implied that Gabor filters will respond to some specific features in natural scenes, while ignoring most others. However, this does not mean that the feedforward neural responses are not redundant. It has been observed that the overcomplete nature of the cells requires recurrent or horizontal connections to remove the redundancy (Daugman 1988, Lee 1995, Rozell et al. 2008). Thus, even though more cells are being recruited to represent the uniform disk region, the overall responses of the entire population of neurons, particularly those at the contrast border, actually decrease over time, as shown in Figure 12. Figure 13 shows that the response distribution at the 50th iteration of the model for the white disk image (as in Figure 10), and for a natural image image, both showed significant reduction of the population response. The later responses remain sparse in the sense of remaining a Laplacian distribution.
Figure 13.

Left. Distribution of the activity of all neurons in the model in response to the white disk in a black background at the 1st and the 50th iterations. Right. Distribution of the activity of all neurons in the model in response to a natural image (Lena) at the 1st and the 50th iterations. The distibutions of responses contracted in both cases. The later representation is more efficient and fair in the framework of overcomplete representation, and sparse in the sense of remaining Laplacian, but not necessarily more sparse in the sense that the 1 % becomes richer at the expense of the 99 %.
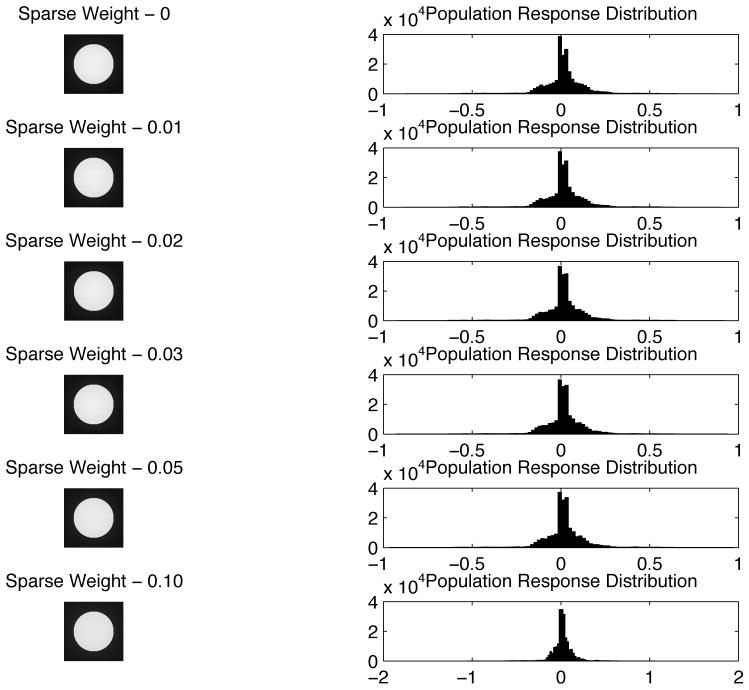
We investigated whether adding an additional sparse constraint such as λ log(1+a2) to the energy function, as in the works of Rozell, would make the distribution more sparse. Figure 14 shows the response distributions retain similar Laplacian profiles with an increased assertion of the sparseness constraint (i.e. increase in λ). Thus, the significant attenuation of most of the responses and exaggeration of a few responses that characterize the sparse code, as observed in Vinje and Gallant (2000), likely require additional neural mechanism such as the well-known expansive nonlinearity in V1 neurons. These effects are not captured in our linear-filter simple cell model. A more realistic network model with such nonlinearity could potentially reproduce the sparse code behaviors in V1 neurons as observed by Vinje and Gallant (2000). Nevertheless, it is interesting that this simplistic model of V1 circuit can already capture many aspects of the contextual modulation effects.
Figure 14.
The sparseness of the resulting neural response distribution to the white disk does not seem to significantly change as with larger sparseness constraint.
Conclusion: Contextual Modulation and Image Representation
In this paper, we have advanced the ‘radical idea’ that image representation furnishes a model for explaining and reconciling a number of neurophysiological observations on contextual modulation. The image representation assumption has been central to the efficient sparse coding account of the development of simple cell receptive fields (Olshausen and Field 1996, Lewicki and Olshausen 1999), and the predictive coding model (Rao and Ballard 1999) and the high-resolution buffer theory of V1 of Lee and Mumford (2003) for visual reasoning in the hierarchical visual cortex. Because of the overcomplete nature of simple cells representation, recurrent circuits through either V1-LGN feedback, normalization, or horizontal connections (Daugman 1988, Lee 1995) would be required to reduce redundancy. Although this hypothesis has received some attention recently in the theoretical neuroscience community (Rozeel et al. 2008, Druckmann and Chklovskii 2011), its implication has not been seriously considered in the physiological community.
To investigate this hypothesis, we performed a series of experiments to study how surface color is processed and represented by V1 neurons, particularly in the context of figure-ground effects. We found neural responses to be strong at the chromatic contrast border but also significant inside the uniform color surface. The responses of the cells are stronger inside the color surface of a figure than in the background of the same color. This ‘figure enhancement effect’ for color is analogous to what had been observed in Lamme (1995) for texture figures, except the enhancement ratio is much stronger (Figure 5). This response inside the figure is progressively weaker when the neuron’s receptive field is analyzing locations further away from the chromatic contrast border or as the size of the figure increases. This resembles the classical surround suppression effect observed in sinewave grating experiments. Thus, our data suggest that surround suppression can be observed in the color domain. We found simulation with the image representation model can actually account for many aspects of these figure ground enhancement effect, i.e. a stronger response inside the figure versus outside the figure, a progressive decrease in response and in figure-enhancement away from the border and even sharp enhancement discontinuity for some cells (Lamme 1995, Zipser et al. 1996, Lee et al. 1998).
The simulation results also dispel a misconception on how neurons need to respond in order to represent uniform surface brightness and color in a region. Cornelissen et al.’s (2006) fMRI study showed that voxel activation for a uniform figure emphasizes the boundary but has a larger spatial spread from the borders not predicted by simple filter responses (see Fig. 10). The activation profile demonstrated a smearing of activation that was much wider that could be predicted based on edge filter response. The lack of uniformity in response within a region of uniform brightness was cited by Cornelissen et al. (2006) as evidence against the notion of isomorphic representation of visual imagery in the brain. The simulation of the image representation model replicated their experimental findings (Figure 12) but argued against their conclusion: the spatial profile in neural activation that they observed is consistent with the network’s responses for representing a uniform region in a overcomplete representation scheme, and is not inconsistent with the notion of isomorphic representation.
Huang and Paradiso (2008) observed a similar progressive decay in response magnitude and delay in response onset as a function of figure size for a brightness figure, when the receptive field of neuron is situated at the center of a uniform white disk. However, they only tested the response of neurons to white disk in a black background but not a black disk in a white background, and as such they cannot claim whether the response observed was encoding figure saliency or figure brightness. Furthermore, they there was no explanation as to why the response decreases with the increase in figure size even though the percept of the brightness remains the same regardless of figure size. The simulation of our model appears to support their claim that the responses are for encoding brightness, but additionally provides an explanation.
An important contribution of this paper is to offer a new interpretation regarding brightness filling-in, in terms of image representation. The temporal evolution of synthesized images in Figure 9 exhibits the same perceptual phenomenon observed in Paradiso and Nakayama’s (1991) psychophysical study on brightness filling-in. All other existing models for explaining this filling-in phenomenon assumes there is a brightness channel in V1 in which the brightness or darkness signals propagate by a diffusion mechanism (Grossberg and Mingolla 1985, Arrington 1994). Our simulation shows this apparent ‘diffusion effect’ does not have to be mediated by a diffusion mechanism, but is simply the consequence of an unfolding gradient descent computation for removing redundancy for image representation. In image representation computation, the response onset of all neurons are simultaneous, albeit some more significantly than others, and that statistically detectable responses might appear to have a progressive onset delay. While we found the detectable response onset time increased with figure size in our physiological experiments, the lack of strong evidence for a delay in 30 percent or 100 percent peak response time for figures of different sizes suggests that this underlying mechanism for generating the progressive detectable response onset time might not be a real propagation by diffusion, but only an apparent propagation of responses as the computation unfolds. The fact that local interaction can mediate global contextual effect in both the model suggests that Paradiso and Nakayama’s (1991) psychophysical result can be interpreted as an indirect evidence in support of an isomorphic representation of images in the visual cortex, rather than a reflection of some kind of diffusion mechanism.
However, data provided by von der heydt et al’s (2005) study on color filling-in in the Troxler illulsion remain a serious challenge to the isomorphic representtion theory. Von der Heydt and colleagues did not find corresponding change in neural activities of ‘surface’ neurons when the monkeys started to report seeing the filling-in. A red neuron remains responding to the red stimuus even though the monkey is seeing green! But they did see a decrease in responses of the border neurons looking at the chromatic borders that were disappearing when filling-in perception was reported. Could it be that the neurons we studied in our experiments were more similar to their ‘border’ neurons than to their ‘surface’ neurons, as our neurons responded very strongly to the chromatic border and only modestly to the background color surface (Fig 8). Our simulation shows that surface and boundary need not be represented by two distinct sets of neurons, and that uniform surface color can be represented by border sensitive neurons, consistent with our physiological observation. However, further experiments and analysis are required to test whether these border cells looking at the color surface would exhibit filling-in behaviors inside the surface in Troxler illusion.
In earlier studies, we have found that the enhanced responses inside the figure reflect perceptual saliency (Lee et al. 2002), as this signal is proportional to the monkeys’ reaction speed and accuracy in target detection. Here, the simulation seems to suggest that enhancement inside the figure could emerge directly from image representation computation without the need of an explicit saliency computation. How can these two views be reconciled? One can argue that the figure enhancement effect could emerge as a by-product of the computation for representing images, with smaller areas characterized by stronger neural responses, which could be treated by the downstream neurons as a saliency signal. Even though the connectivity required in the image representation network is very local, only between neurons with overlapping receptive fields, signals can still propagate long-range far from the source over time, as shown in Fig. 9. It would be interesting to investigate what aspects of the classical surround suppression, and other contextual modulation effects can also be accounted for in terms of image representation model.
On the other hand, image representation seems to be a relatively trivial and boring task from computer vision perspective. V1, endowed with almost 20 percent of the visual cortical real-estate in the brain, likely engages in a variety of high-resolution visual computation. From the perspective of visual cortex performing inference using a generative model, V1 can serve a unique role of representing detailed mental images interpreted based on the retinal image in computation that involves recurrent interaction with many visual areas along the hierarchy, as suggested by Lee and Mumford’s (2003) ‘high-resolution buffer’ hypothesis. Therefore, our image representation model can serve as an infrastructure for constructing perceptual and mental image. Computing these perceptual images that we actually see, as in Kanizsa triangle, requires the connections encoding statistical priors from natural scenes to support perceptual inference. Thus, the circuit of redundancy removal for image representation discussed here is likely embedded inside a rich set of horizontal circuits for other well known phenomena observed in V1 (Angelucci and Bressloff 2006, Bringuier et al. 1999, Fregnac 2003): contour linking (Li et al. 2008, Gilbert and Sigman 2007), surface interpolation (Samonds et al. 2009), disparity filling-in (Samonds et al. 2012), surround suppression, pop-out and saliency computation (e.g. Knierim and Van Essen 1992, Lee et al. 2002). Understanding how multiple functional horizontal and recurrent feedback circuits can coexist and work together with the circuit of image representation is a major challenge for future theoretical and experimental research.
Acknowledgments
This work was supported by CISE IIS 0713206, NIH R01 EY022247, NIH P41 EB001977, NIH NIDA R09 DA023428, and a grant from Pennsylvania Department of Health through the Commonwealth Universal Research Enhancement Program. We thank Ryan Kelly, Jason Samonds, Matt Smith, Karen McCracken, Karen Medler for helpful comments and technical assistance. A protocol covering these studies was approved by the Institutional Animal Care and Use Committee of Carnegie Mellon University, in accord with Public Health Service guidelines for the care and use of laboratory animals.
References
- Albrechet DG, Geisler WS, Frazor RA, Crane AM. Visual cortical neurons of monkeys and cats: temporal dynamics of the contrast response function. J Neurophysiology. 2002;88:888–913. doi: 10.1152/jn.2002.88.2.888. [DOI] [PubMed] [Google Scholar]
- Angelucci A, Bressloff P. Contribution of feedforward, lateral and feedback cnnec-tions to the classical receptive field center and extra-classical receptive field surround of primate V1 neurons. In: Martinez-Conde, Macknik, Martinez, Alonso, Tse, editors. Progress in Brain Research. Vol. 154. 2006. pp. 93–120. [DOI] [PubMed] [Google Scholar]
- Arrington KF. The temporal dynamics of brightness filling-in. Vision Res. 1994;34(24):3371–87. doi: 10.1016/0042-6989(94)90071-x. [DOI] [PubMed] [Google Scholar]
- Bringuier V, Chavane F, Glaeser L, Frgnac Y. Horizontal propagation of visual activity in the synaptic integration field of area 17 neurons. Science. 1999;283:695–699. doi: 10.1126/science.283.5402.695. [DOI] [PubMed] [Google Scholar]
- Connor CE, Egeth HE, Yantis S. Visual attention: Bottom-up vs. top-down. Current Biology. 2004;14:850–852. doi: 10.1016/j.cub.2004.09.041. [DOI] [PubMed] [Google Scholar]
- Conway BR. Spatial structure of cone inputs to color cells in alert macaque primary visual cortex (V1) J Neuroscience. 2001;21:2768–2783. doi: 10.1523/JNEUROSCI.21-08-02768.2001. [DOI] [PMC free article] [PubMed] [Google Scholar]
- Conway BR, Hubel DH, Livingstone MS. Color contrast in macaque V1. Cereb Cortex. 2002;12(9):915–25. doi: 10.1093/cercor/12.9.915. [DOI] [PubMed] [Google Scholar]
- Cornelissen FW, Wade AR, Vladusich T, Dougherty RF, Wandell BA. No functional magnetic resonance imaging evidence for brightness and color filling-in in early human visual cortex. J Neurosci. 2006;26:3634–3641. doi: 10.1523/JNEUROSCI.4382-05.2006. [DOI] [PMC free article] [PubMed] [Google Scholar]
- Daugman J. Complete discrete 2D Gabor transform by neural networks for image analysis and compression. IEEE Trans Acoustics, Speech, and Signal Processing. 1988;36:1169–1179. [Google Scholar]
- De Weerd P, Gattass R, Desimone R, Ungerleider LG. Responses of cells in monkey visual cortex during perceptual filling-in of an artificial scotoma. Nature. 1995;377:731–734. doi: 10.1038/377731a0. [DOI] [PubMed] [Google Scholar]
- Druckmann S, Chklovskii D. Over-complete representations on recurrent neural networks can support persistent percepts. NIPS. 2010:541–549. [Google Scholar]
- Fregnac Y. Neurogeometry and entoptic visions of the functional architecture of the brain. J Physiol Paris. 2003;97:87–92. doi: 10.1016/j.jphysparis.2003.12.001. [DOI] [PubMed] [Google Scholar]
- Friedman HS, Zhou H, von der Heydt R. The coding of uniform color figures in monkey visual cortex. J Physiol (Lond) 2003;548:593–613. doi: 10.1113/jphysiol.2002.033555. [DOI] [PMC free article] [PubMed] [Google Scholar]
- Gerrits HJM, Vendrik AJH. Simultaneous contrast, filling-in process and information processing in man’s visual system. Exp Brain Res. 1970;11:411–430. doi: 10.1007/BF00237914. [DOI] [PubMed] [Google Scholar]
- Gilbert CD, Sigman M. Brain states: Top-down influences in sensory processing. Neuron. 2007;54(5):677–696. doi: 10.1016/j.neuron.2007.05.019. [DOI] [PubMed] [Google Scholar]
- Grossberg S, Mingolla E. Neural dynamics of form perception: boundary completion, illusory figures, and neon color spreading. Psychol Rev. 1985;92(2):173–211. [PubMed] [Google Scholar]
- Hanazawa A, Komatsu H, Murakami I. Neural selectivity for hue and saturation of colour in the primary visual cortex of the monkey. European Journal of Neuroscience. 2000;12:1753–1763. doi: 10.1046/j.1460-9568.2000.00041.x. [DOI] [PubMed] [Google Scholar]
- Horn BKP. Determinig lightness from an image. Computer Graphics and Image Processing. 1974;3:277–299. [Google Scholar]
- Huang X, Paradiso MA. V1 response timing and surface filling-in. Journal of Neurophysiology. 2008;100:539–547. doi: 10.1152/jn.00997.2007. [DOI] [PMC free article] [PubMed] [Google Scholar]
- Knierim JJ, van Essen DC. Neuronal responses to static texture patterns in area V1 of the alert macaque monkeys. J Neurophysiol. 1992;67:961980. doi: 10.1152/jn.1992.67.4.961. [DOI] [PubMed] [Google Scholar]
- Kinoshita M, Komatsu H. Neural representation of the luminance and brightness of a uniform surface in the macaque visual cortex. J Neurophysiology. 2001;86:2559–2570. doi: 10.1152/jn.2001.86.5.2559. [DOI] [PubMed] [Google Scholar]
- Lamme VA. The neurophysiology of figure-ground segregation in primary visual cortex. J Neurosci. 1995;15(2):1605–15. doi: 10.1523/JNEUROSCI.15-02-01605.1995. [DOI] [PMC free article] [PubMed] [Google Scholar]
- Land E. The retinex theory of color vision. Sci Am. 1977;237:108–28. doi: 10.1038/scientificamerican1277-108. [DOI] [PubMed] [Google Scholar]
- Lee TS, Mumford D, Romero R, Lamme VA. The role of the primary visual cortex in higher level vision. Vision Res. 1998;38(15–16):2429–54. doi: 10.1016/s0042-6989(97)00464-1. [DOI] [PubMed] [Google Scholar]
- Lee TS, Yang CF, Romero RD, Mumford D. Neural activity in early visual cortex re-flects behavioral experience and higher-order perceptual saliency. Nat Neurosci. 2002;5(6):589–97. doi: 10.1038/nn0602-860. [DOI] [PubMed] [Google Scholar]
- Lee TS, Mumford D. Hierarchical Bayesian inference in the visual cortex. Journal of Optical Society of America, A. 2003;20(7):1434–1448. doi: 10.1364/josaa.20.001434. [DOI] [PubMed] [Google Scholar]
- Lennie P, Movshon JA. Coding of color and form in the geniculostriate visual pathway. JOSA. 2005;22(10):2013–2033. doi: 10.1364/josaa.22.002013. [DOI] [PubMed] [Google Scholar]
- Li W, Piech V, Gilbert CD. Learning to link visual contours. Neuron. 2008;57(3):442–451. doi: 10.1016/j.neuron.2007.12.011. [DOI] [PMC free article] [PubMed] [Google Scholar]
- Livingstone MS, Hubel DH. Anatomy and physiology of a color system in the primate visual cortex. J Neurosci. 1984;4:309–356. doi: 10.1523/JNEUROSCI.04-01-00309.1984. [DOI] [PMC free article] [PubMed] [Google Scholar]
- Luck SJ, Chelazzi L, Hillyard SA, Desimone R. Neural mechanisms of spatial selective attention in areas V1, V2, and V4 of macaque visual cortex. J Neurophysiol. 1997;77(1):24–42. doi: 10.1152/jn.1997.77.1.24. [DOI] [PubMed] [Google Scholar]
- McAdams CJ, Maunsell JH. Attention to both space and feature modulates neuronal responses in macaque area V4. J Neurophysiol. 2000;83(3):1751–5. doi: 10.1152/jn.2000.83.3.1751. [DOI] [PubMed] [Google Scholar]
- Marcus DS, Van Essen DC. Scene segmentation and attention in primate cortical areas V1 and V2. J Neurophysiology. 2002;88:2648–2658. doi: 10.1152/jn.00916.2001. [DOI] [PubMed] [Google Scholar]
- Maunsell JH, Gibson JR. Visual response latencies in striate cortex of the macaque monkey. J Neurophysiol. 1992;68(4):1332–44. doi: 10.1152/jn.1992.68.4.1332. [DOI] [PubMed] [Google Scholar]
- Palmer SE. Vision Science: Photons to Phenomenology. MIT press; 1999. [Google Scholar]
- Paradiso MA, Nakayama K. Brightness perception and filling-in. Vision Research. 1991;31:1221–1236. doi: 10.1016/0042-6989(91)90047-9. tion and Performance 9, 183–193. [DOI] [PubMed] [Google Scholar]
- Rao RPN, Ballard DH. Predictive coding in the visual cortex: A functional interpretation of some extra-classical receptive-field effects. Nature Neuroscience. 1999;2(1):79–83. doi: 10.1038/4580. [DOI] [PubMed] [Google Scholar]
- Roe AW, Lu H, Hung CP. Cortical processing of a brightness illusion. Proc Natl Acad Sci USA. 2005;102:3869–3874. doi: 10.1073/pnas.0500097102. [DOI] [PMC free article] [PubMed] [Google Scholar]
- Rozell CJ, Johnson DH, Baraniuk RG, Olshausen BA. Sparse coding via thresholding and local competition in neural circuits. Neural Computation. 2008;20(10):2526–2563. doi: 10.1162/neco.2008.03-07-486. [DOI] [PubMed] [Google Scholar]
- Rossi AF, Desimone R, Ungerleider LG. Contextual modulation in primary visual cortex of macaques. J Neurosci. 2001;21(5):1698–709. doi: 10.1523/JNEUROSCI.21-05-01698.2001. [DOI] [PMC free article] [PubMed] [Google Scholar]
- Rossi AF, Rittenhouse CD, Paradiso MA. The representation of brightness in primary visual cortex. Science. 1996;273:1104–1107. doi: 10.1126/science.273.5278.1104. [DOI] [PubMed] [Google Scholar]
- Samonds JM, Potetz B, Lee TS. Cooperative and competitive interactions facilitate stereo computations in macaque primary visual cortex. J Neuroscience. 2009;29(50):15780–15795. doi: 10.1523/JNEUROSCI.2305-09.2009. [DOI] [PMC free article] [PubMed] [Google Scholar]
- Sasaki Y, Watanabe T. The primary visual cortex fills in color. PNAS. 2004;101(52):18251–18256. doi: 10.1073/pnas.0406293102. [DOI] [PMC free article] [PubMed] [Google Scholar]
- von der Heydt, Friedman HS, Zhou H. Searching for the neural mechanism of color filling-in. In: Pessoa L, de Weerd P, editors. “Filling-in”: from perceptual completion to cortical reorganization. New York: Oxford University Press; 2003. pp. 106–127. [Google Scholar]
- Wachtler T, Sejnowski TJ, Albright TD. Representation of color stimuli in awake macaque primary visual cortex. Neuron. 2003;37:681–691. doi: 10.1016/s0896-6273(03)00035-7. [DOI] [PMC free article] [PubMed] [Google Scholar]
- Vinje W, Gallant J. Sparse coding and decorrelation in primary visual cortex during natural vision. Science. 2000;287:1273–1276. doi: 10.1126/science.287.5456.1273. [DOI] [PubMed] [Google Scholar]
- Zhou H, Friedman HS, von der Heydt R. Coding of border ownership in monkey visual cortex. J Neuroscience. 2000;20:6594–6611. doi: 10.1523/JNEUROSCI.20-17-06594.2000. [DOI] [PMC free article] [PubMed] [Google Scholar]
- Zipser K, Lamme VAF, Schiller P. Contextual Modulation in Primary Visual Cortex. Journal of Neuroscience. 1996;16(22):7376–7389. doi: 10.1523/JNEUROSCI.16-22-07376.1996. [DOI] [PMC free article] [PubMed] [Google Scholar]


