

Abstract
A microfluidic oxygenator is used to deliver constant oxygen to rodent brain slices, enabling the loading of the cell-permeant calcium indicator Fura-2/AM into cells of adult brain slices. When compared to traditional methods, our microfluidic oxygenator improves loading efficiency, measured by the number of loaded cells per unit area, for all tested age groups. Loading in slices from 1-year-old mice was achieved, which has not been possible with current bulk loading methods. This technique significantly expands the age range for which calcium studies are possible without cellular injection. This technique will facilitate opportunities for the study of calcium signaling of aging and long term stress related diseases. Moreover, it should be applicable to other membrane-permeant physiological indicator varieties.
Keywords: Hippocampus, Fura-2, Bulk loading, Oxygen, PDMS, Microchannel
1. Introduction
Success in identifying the pivotal signaling mechanism of hypoxic damage in neuronal cells is greatly aided by the ability to monitor and measure the cascade of cellular processes triggered by the onset of the hypoxic insult. An increase of intracellular calcium within the cell is a principal component in this cascade (Small et al., 1997), and as such has garnered a great deal of interest from neuroscientists. One of the main techniques used to relate hypoxia to intracellular calcium is fluorescent imaging, namely, calcium imaging (Chen et al., 2006). However, information in a majority of these studies comes from neonatal subjects, whereas information from older subjects, arguably more relevant to hypoxia diseases, is severely lacking (Peterlin et al., 2000). Most studies that use calcium imaging to quantify hypoxic insults employ the brain slice preparation, especially the oxygen sensitive hippocampal preparation (Peterson et al., 2012; Mauleon et al., 2012). Prevalent techniques used to load calcium indicator dyes into cells are microinjection and bulk loading (Regehr et al., 1991). Microinjection requires the user to impale a single cell with an intracellular electrode to load it with the dye (Regehr et al., 1991). This technique, while accurate and necessary for calibration of the intracellular calcium, can become cumbersome if a population of neuronal cells is the subject of the experiment. On the other hand, the bulk loading method allows several cells to be loaded with the dye in a simple step (Regehr et al., 1991). In the bulk loading technique, the brain slices are incubated in the membrane permeable ester form of a calcium indicator dye (Smetters et al., 1999). One of the most widely used calcium indicators is the Fura-2/AM (acetoxymethyl) (Barreto-Chang et al., 2009). Using this method, the Fura-2 molecule is able to cross the cell membrane and once inside, it is de-esterafied by intracellular esterases, trapping the indicator in the cytoplasm (Roe et al., 1990). However, this method has limited loading when the brain slices originate from adult mice (Peterlin et al., 2000; Barreto-Chang et al., 2009; Stosiek et al., 2003), for reasons thought to be related to the development of the neuropil over time after birth.
Different techniques have attempted to improve the loading efficiency of calcium indicators in brain slices, especially in adult tissue with varying degrees of success. Various groups tried to increase the incubation periods (Lin et al., 2003; Kirischuk et al., 1996); others would incubate the slices under atmospheric air (Beierlein et al., 2002), while others would bubble carbogen gas in the incubation media (Yuste et al., 2011). Some groups developed elaborate loading protocols ranging from a double incubation (Peterlin et al., 2000) to a “multicell bolus loading (MCBL)” approach (Stosiek et al., 2003). Some groups are even using genetically encoded calcium indicators (Lin et al., 2012). While these techniques allowed their respective groups to obtain quality data, they suffer from the need of specialized equipment (Stosiek et al., 2003; Lin et al., 2012), time-consuming and intricate protocols (Peterlin et al., 2000), and yet still limited in practice to samples originating from mice younger than 25 days old (Peterlin et al., 2000; Lin et al., 2003; Beierlein et al., 2002).
Using microfluidic technology, neuroscience researchers can improve on the current techniques available for calcium loading. Our group, as well as others, has had success employing a standard bulk loading method that requires the slices to rest in the incubation media for a short period of time (20 minutes for slices up to P20) (Peterson et al., 2012; Beierlein et al., 2002). In the present study, we will compare this standard method to a new microfluidic protocol developed by our group. Using a modified version of an incubator used for open-top cell culture oxygen incubation (Lo et al., 2010), we incubated brain slices in Fura-2/AM for longer periods of time than currently achievable. The microfluidic oxygenator uses gas microfluidic channels with a thin gas permeable membrane to diffuse oxygen to the brain slice and helps to maintain viability while improving calcium indicator loading. This microfluidic method is more efficient in oxygenating thin brain slices by eliminating boundary layers in bulk convective mass transfer. Using this device, the brain slice is in direct contact with the oxygen-permeable membrane substrate. This direct diffusion process allows us to achieve a more stable and uniform oxygen environment throughout the brain slice, thus keeping the tissue healthier. We show that we can improve calcium indicator loading at a wide range of tissue ages culminating in tissue from mice over a year old. We demonstrate the functionality of the loading by subjecting the slice of a mouse older than 1 year old to a period of hypoxia and measuring the calcium response as a proof of concept.
2. Materials and Methods
2.1 Fabrication of microfluidic oxygenator
The microfluidic oxygenator consists of 3 polymeric parts (Fig. 1): the microfluidic network, the gas-permeable membrane, and the incubation well. The microfluidic channel and the membrane were fabricated out of the elastomer polydimethylsiloxane (PDMS) using soft lithography as previously described (Lo et al., 2010). To fabricate the incubation well, PDMS was poured into a 6-well cell plate until it reached a thickness of 1 centimeter deep, and this was allowed to cure. After this, the cured PDMS wells were taken out from the 6-well cell plate and using a sharpened hole-punch with a 1cm diameter, the incubation area was formed. Alignment marks were used to create inlet and outlet ports in the PDMS membrane and in the incubation well in such a way that they allowed the oxygen to flow into and out of the microfluidic channel below the gas permeable PDMS membrane. Once the individual parts were aligned, they were irreversibly bonded using a plasma wand, (Electro-Technics, Inc.) to complete the device. Tygon tubing was attached to multiple incubation wells using plastic connectors where one gas line input could oxygenate all 6 incubation wells. Additionally, the oxygen flow rate within the microfluidic gas channels is at 40 cc/min, which is sufficient to maintain an infinite source for diffusion but low enough to prevent distending of the diffusion membrane. The incubation wells allow the slice to be completely submerged under the HEPES buffered aCSF solution while the PDMS membrane provides a mechanically stable surface for the tissue.
Fig. 1.

Standard method versus the microfluidic oxygenator. (A) Standard method of dye loading where the tissue is placed in a dish with the dye. (B) Schematic of the microfluidic oxygenator which consists of 3 independent pats: the microfluidic network, the gas-permeable membrane, and the incubation well. Gas flows beneath the membrane where the tissues sits and diffusion from the gas channel oxygenates the tissue via diffusion. (C) Photograph showing the features of the microfluidic oxygenator from above.
2.2 Animals and experimental groups
The Animal Care and Use Committee at the University of Illinois Chicago approved all of the procedures reported here. Experiments were performed on male and female BL7 mice (bred from stock obtained from Charles River Laboratories, Wilmington, MA). Experiments were conducted on postnatal mice [12–30 days old (P12–30)] and adult mice [P50- 1 year old] housed under normoxic laboratory conditions.
2.3 Brain slice preparation
Mice were deeply anesthetized using Aerrane (isoflurane, USP) and decapitated. Brains were rapidly removed from the skull and placed in chilled (3–7°C) high-sucrose cutting solution. Then, the cerebellum was separated and disposed, while the rest of the brain tissue was glued to an agar block using cyanoacryl glue with the cerebral cortex facing down. Next, while in high-sucrose cutting solution, 350μm thick hippocampal slices were cut with a tissue slicer (Vibratome Series 1000 Classic) along the transverse plane. The slices were then placed in a custom-made holding chamber containing high-sucrose cutting solution and incubated at 34°C for 35 minutes. Then, the slices were transferred to another chamber containing artificial cerebral spinal fluid (aCSF) and incubated at the same temperature for 25 minutes. Following the incubation period, the brain slices were kept at room temperature. 95% O2/5% CO2 gas was continually bubbled into all solutions the brain slices were kept in. The cutting solution contained (in mM) 82.70 NaCl, 23.81 NaHCO3, 2.41 KCl, 2.65 Na2HPO4, 14.53 MgCl2, 0.64 CaCl2, 23.70 Glucose and 71.19 Sucrose. The aCSF solution used during slice incubation and experiments contained (in mM): 124.98 NaCl, 23.01 NaHCO3, 2.50 KCl, 2.36 Na2HPO4, 0.43 MgCl2, 0.26 CaCl2, and 25 Glucose. The osmolarity of the solution was 300–310 mOsm, adjusted with sucrose. All experiments were performed at room temperature.
2.4 Validation of device using fiber optic oxygen sensor
A fiber optic oxygen sensor (Neofox, Ocean optics) was used to compare the microfluidic oxygenator versus the standard method. The tip of the oxygen probe has a diameter of 200μm and uses photoluminescence-quenching of a ruthenium compound to detect oxygen molecules. The sensor was calibrated according to the manufacturer’s instructions. First, the probe is exposed to gas containing 0% O2 (95% N2/5% CO2) for 30 seconds, followed by gas containing 95% O2 (95% O2/5% CO2) for 30 seconds. The CO2 is present as it can also alter the fluorescence of the probe. Once calibrated, the probe was lowered into the microfluidic oxygenator and the oxygen concentration in the Hepes buffered aCSF solution was recorded; the same procedure was repeated for the standard method. Then, the oxygen concentration inside the brain slice — the hippocampal CA1 area, P30 mice — was gathered while the slice was incubated for 90 minutes as shown in figure 2A. In figure 2B, we show the results obtained from a two-tailed, unpaired t-test (Excel) to compare the oxygen concentration values obtained from the standard method and the microfluidic oxygenator at predetermined time periods (30, 60, and 90 minutes). In order to measure the oxygen concentrations inside the brain slice, the oxygen probe was attached to a piezoelectric micromanipulator that could maneuver the probe in the x, y, and z planes with a resolution of 0.1μm. For our purposes, the oxygen concentration at a height (measured from the bottom of the chamber) of 250μm was recorded within the 350μm brain slice.
Fig. 2.
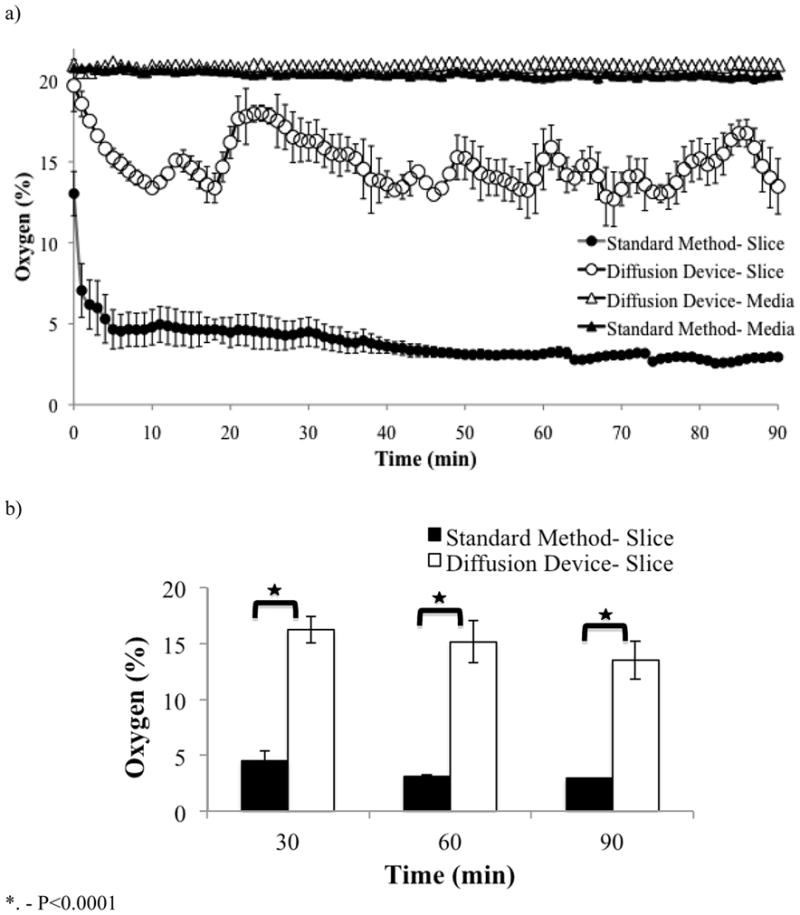
Validation of the microfluidic oxygenator with an oxygen sensor. (A) Using an oxygen probe (NeoFox, Ocean Optics), the oxygen concentration dissolved in the HEPES buffered aCSF solution was measured for the microfluidic oxygenator and the standard method. There is no difference in the oxygen concentration found in the HEPES buffered aCSF solution for these 2 methods. Using the oxygen sensor mounted to an electric translation manipulator, the oxygenation inside the brain slices of P30 mice at a height of 250μm was measured. The microfluidic oxygenator is able to continually oxygenate the brain slice for a period of 90 minutes with an average of 15% O2. The standard method cannot oxygenate the brain slice in an efficient manner. During the 90 minutes incubation period, the average oxygen concentration inside the slice was less than 5%. Error bars represent standard error. (B) Summary data comparing the oxygen concentration values obtained from the standard method and the microfluidic oxygenator at predetermined time periods (30, 60, and 90 minutes) where the error bars represent standard error.
2.5 In vitro loading of brain slice with Fura-2/AM
In order to determine the intracellular calcium response of the brain slice, Fura-2/AM (acetoxymethyl ester) (Biotium) was used. After finishing the aCSF incubation period, Fura-2/AM was dissolved in DMSO plus 20% Pluronic F-127 to yield a concentration of 5μM. Using a pipette, 1ml of HEPES buffered aCSF solution was deposited into the wells of the microfluidic incubation device as well as on the chamber used for the standard method. Pairs of slices from the same mouse were then simultaneously placed into the wells filled with the HEPES buffered aCSF solution and the Fura-2/AM dye was puffed onto the brain slices focusing on the hippocampal area.
Incubation times were changed depending on the age of the tissue starting with 20 minutes and ending with 3 hours to maximize dye loading but minimizing loading time. The microfluidic oxygenator was continuously perfused with 21% oxygen/5% carbon dioxide while the standard method used only atmospheric air. After the allotted incubation time, the slices were placed back into the holding chamber containing aCSF.
2.6 Live/dead assay
Following the incubation period in the aCSF, the hippocampal brain slices were stained with the calcium indicator using the 2 different methods previously outlined. The incubation period varied based on the age of the mice according to table 1. To assess for cell death after the incubation period in both of the different methods, the brain slices were subjected to a live/dead viability assay as per manufacturer’s protocol; briefly, the slices were incubated in 4μM of ethidium homodimer-1 (to highlight the dead cells) and 2μM of calcein acetoxymethyl ester (to highlight the live cells) in the dark for 30 minutes. The slices were then washed in control aCSF at room temperature for 15 minutes. The number of live and dead cells was quantified in a given field of view using a 10X objective and fluorescence microscopy with the appropriate filters.
Table 1.
Summary of microfluidic oxygenator advantages over standard method
| Age | Loading Time (min) | Viability Improvement (Fold) | Loading Improvement (Fold) |
|---|---|---|---|
| P12 | 20 | 1.0X | 1.1X |
| P20 | 30 | 1.0X | 1.5X |
| P30 | 90 | 1.2X | 2.0X |
| P50 | 120 | 2.0X | 3.0X |
| P70 | 150 | 2.2X | 11.0X |
| 1 yr old | 180 | 3.4X | 2.5X |
2.7 Quantifying Calcium in Mice Under a Hypoxic Insult
In order to create a hypoxic insult, which would allow us to monitor the resulting intracellular calcium increase; we followed the procedure outlined in Mauleon et al (Mauleon et al., 2012). Briefly, a microfluidic device capable of manipulating the oxygen concentration inside the brain slice was used. The brain slice was placed inside the oxygen delivery device. Then, the chamber was filled with aCSF (no flow), and the oxygen concentration was varied from 95% to 0%. Images used to measure the calcium response were obtained from the CA1 area of the hippocampus by measuring the Fura-2 fluorescence emission at 510nm using a fluorescent inverted microscope (Olympus IX71). The ratiometric data was obtained by exciting the samples with 340/380 nm wavelengths using the image acquisition and analysis software MetaFluor Imaging System (Universal Imaging Corp.). For statistical analysis, the ratiometric data (340 nm intensity divided by 380 nm intensity) were converted to percent change in fluorescence by dividing the ratios obtained from each image by the average intensity ratio during the baseline-recording period (initial 5 minute period) and multiplying the result by 100; the pictures were acquired using the 10X objective.
2.8 Statistical analysis
Experiments involving animal tissue were performed on a minimum of 3 brain slices obtained from 3 different animals for a total of 9 individual data sets, except slices from mice older than one year as only 4 animals were available in this group. Experiments not involving animal tissues were repeated a minimum of three times. Cell counting was performed using Image J. Graphs show the average value with the error bars representing standard error. In addition, we used a two-tailed, unpaired t-test (Excel) to compare the data obtained from the incubation device and the standard method at the different mice ages.
3. Results
3.1 Characterization of the microfluidic oxygenator
When the brain slices are loaded with Fura-2 using the standard method, they are incubated under normal atmospheric conditions; as such, the HEPES buffered aCSF solution contains an oxygen concentration of 21% (Fig. 2A). Using the microfluidic oxygenator, the HEPES solution contains the same oxygen concentration. However, as shown in figure 2B, by measuring the oxygen concentration inside the brain slice at a height (starting from the bottom of the chamber) of 250μm, we demonstrated that the microfluidic oxygenator is significantly better at oxygenating the brain slice than the standard method throughout the entire incubation period. Using the standard method, the inside of the brain slice receives an average of 3.7% O2, while the microfluidic oxygenator provides the brain slice with an average concentration of 14.9% O2 during a period of 90 minutes, p<0.0001, t-test.
3.2 Live/dead assay
Using a standard live/cell assay, we tested the tissue viability of different age groups of mice. Starting with the P12 to 1 year old mice, we saw that as the age of the tissue increases, the viability of the cells decrease as shown by the live/dead assay using both methods (Fig. 3); however, the rate of decreased cell viability is considerably different from the two methods studied. The device and the standard method produce similar viability percentages up to age P20, as were expected considering the success rate of dye loading into neonate tissue. Starting with the P30 mice tissue, there is a small drop off in the viability from the standard method that is not seen with the microfluidic oxygenator. By P50 and on, the viability difference becomes statistically significant when compared to the microfluidic oxygenator method. Using the microfluidic oxygenator, brain slices from mice older than 1 year are kept viable during the incubation period.
Fig. 3.

Live dead assay results. Quantification of the percent of cells left alive, as shown by the live/dead assay kit, after different incubation periods. P12-P30 showed no difference based on the different incubation protocols, however, starting with P50, there is a consistent drop off in cell viability in the standard method not experienced by the oxygenator method. The 1 yr old mice data was obtained from only 1 mouse (due to lack of older mice), with 3 different slides stained with the live/dead assay kit. This means that the error bars represent 3 data points. All other age groups were obtained from 3 different mice for a total of 9 data points for each condition.
3.3 Fura-2 loading
There was no statistically difference between the P12 groups when incubated by either method (Fig. 4A). This is consistent with the common observation that neonatal brain tissue works well for bulk dye loading. However, as early as P20, we see an improved loading efficiency when using the microfluidic oxygenator. In a similar manner, the loading efficiency increases twofold at P30, while at P50 the efficiency increases by a factor of 3 with the device. At P70, a previously impossible age to load; we see a 10-fold increase in the number of cells loaded with the dye. Finally, loading of brain slices from 1 year old mice was successfully done using the microfluidic oxygenator and using ratiometric imaging, we are able to confirm the effectiveness of the loading procedure by means of calcium recording from a hypoxic insult (Fig. 4B). Figure 4C shows representative images from the loaded neuronal cells from both methods at all age groups investigated.
Fig. 4.


Fura incubation results. (A) Quantification of the number of cells loaded with Fura-2 by two different methods. Using image J, we measured the number of loaded cells per unit area in a given image. The microfluidic oxygenator is able to better load the slices with the Fura-2 dye, even loading brain slices older than 50 days old. (B) During a hypoxic insult, the intracellular calcium increases as shown by the Fura-2 data. Brain slice originated from a mouse older than 1 year old. (C) Representative images from the different age groups
4. Discussion
Previously we demonstrated precise delivery of oxygen to the acute brain slice preparation using patterned microfluidic substrates (Lo et al., 2010; Mauleon et al., 2012). This same technology now provides us the opportunity to improve on current dye loading protocols in order to obtain information from a group different from neonates; adult tissue. Previously used loading procedures were excellent when the brain slices came from neonates, however, even the most intricate protocols could not effectively load Fura-2 dye into mice older than P20 (Peterlin et al., 2000). With our microfluidic oxygenator, we can effectively oxygenate the brain slice for longer incubation periods. For this study, we chose to investigate the optimal loading time necessary to effectively load the calcium indicator into the tissue. Unfortunately, the Fura-2/AM loading period for brain slices is not consistent from study to study (Lin et al., 2003; Kirischuk et al., 1996), however, studies do show that a longer incubation period would lead to improved dye loading. Our results indicate that the standard method of dye loading results in oxygen within the brain slice to drop to an average of 3.8% O2. From the microfluidic oxygenator data, we see that the oxygen concentration fluctuates, perhaps from cellular respiration, but still holding above 15% O2 and reaching 19% O2. Thus, the microfluidic oxygenator better oxygenates the slice for longer periods of time.
By adding the constant oxygen delivery from the bottom of the slice, the slices are better oxygenated for longer periods of time and the lack of bubbles prevents stress experienced by the slices. Other groups and us alike have seen that the standard method is able to load Fura-2 molecules into brain slices of neonates up to an age of 20 days old (Peterlin et al., 2000). However, after this time period, the success rate decreases. It was our theory that this drop off in loading occurred due to loss of cell viability as the oxygen drops to 5% in 20 minutes. As demonstrated with a live/dead assay kit, we confirmed our hypothesis by testing different age groups of mice. As can be seen from figure 3, the microfluidic oxygenator allows the brain slices to stay viable even after longer incubation periods than currently employed.
By using the microfluidic oxygenator, we are able to increase the dye loading times of the brain slices. This enabled us to increase the loading times with increased age, following trends reported by other researchers, while making sure to still use the least amount of time possible. The ability to load brain slices with Fura-2 dye is an important goal, one that has inspired several studies (Peterlin et al., 2000; Stosiek et al., 2003; Lin et al., 2003; Kirischuk et al., 1996). Our device has demonstrated to be superior compared to these other protocols since it integrates the advantages from other protocols (increased loading times, constant oxygenation, simplicity), while avoiding the flaws (bubble stress, complexity, age limit) to achieve an optimized dye loading.
It is important to emphasize that we used the shortest incubation period possible while still obtaining optimal dye loading. One major concern facing the increase in loading time is the concomitant increase in background fluorescence (Kirischuk et al., 1996), especially if the dye remains intercellular instead of inside viable cells. However, loading and viability were improved for all time durations tested, minimizing these unusable background signals (Fig. 4B). Moreover, we can see increases in intracellular calcium during hypoxic insults in 1-year-old tissue demonstrating the microfluidic diffusion device dye loading method is still able to generate useable data. These calcium intensities are spatially correlated to labeled nuclei, demonstrating the expected hypoxia response of functional neuronal cells, as shown in figure 4B and 4C. It is important to note that this technique could be generalized for loading dye into other tissue preparations.
5. Conclusions
Our novel device has many possible applications as a physiological tool for brain slice preparation in neuroscience and also other tissue requiring incubation preparations. While in this study Fura-2/AM was the only dye used, it is possible to use this oxygenator for others dyes that take advantage of the membrane permeable esters for loading. Similarly, since the oxygen diffuses throughout the PDMS membrane, the gases do not disturb the slice mechanically, allowing sensitive tissues to be incubated for long periods of time. In the past, we have applied this technology to study neuronal tissues from species as different as naked mole rats and mice (Peterson et al., 2012). The ability to investigate tissue from older animals even up to 1 year of age may enable many studies in aging and long-term stress related diseases. Other tissues employing sensitive calcium imaging, such as pancreatic islets, heart tissue, liver sinusoids, and retina tissues can benefit from microfluidic oxygenator enhanced dye loading. In the wide spread application of calcium imaging for investigations in live tissues, the microfluidic oxygenator has potential to be an important and indispensable tool.
Highlights.
A microfluidic oxygenator is used to deliver constant oxygen to rodent brain slices
Device improves loading efficiency of calcium indicator Fura-2/AM into cells of slice
Loading in slices from 1-year old mice was achieved
Technique significantly expands the age range for which calcium studies are possible
Acknowledgments
The authors are grateful for the support of the NIMH Neurotechnology program through R21MH085073 and Chicago Biomedical Consortium with support from the Searle Funds at The Chicago Community Trust.
Footnotes
Publisher's Disclaimer: This is a PDF file of an unedited manuscript that has been accepted for publication. As a service to our customers we are providing this early version of the manuscript. The manuscript will undergo copyediting, typesetting, and review of the resulting proof before it is published in its final citable form. Please note that during the production process errors may be discovered which could affect the content, and all legal disclaimers that apply to the journal pertain.
References
- Barreto-Chang OL, Dolmetsch RE. Calcium imaging of cortical neurons using fura-2 AM. JoVE. 2009:23. doi: 10.3791/1067. [DOI] [PMC free article] [PubMed] [Google Scholar]
- Beierlein M, Fall CP, Rinzel J, Yuste R. Thalamocortical bursts trigger recurrent activity in neocortical networks: Layer 4 as a frequency-dependent gate. The Journal of Neuroscience. 2002;22(22):9885–94. doi: 10.1523/JNEUROSCI.22-22-09885.2002. [DOI] [PMC free article] [PubMed] [Google Scholar]
- Chen TW, Lin BJ, Brunner E, Schild D. In situ background estimation in quantitative fluorescence imaging. Biophysical Journal. 2006;90:2534–47. doi: 10.1529/biophysj.105.070854. [DOI] [PMC free article] [PubMed] [Google Scholar]
- Kirischuk S, Verkhratsky A. [Ca2+](i) recordings from neural cells in acutely isolated cerebellar slices employing differential loading of the membrane permeant form of the calcium indicator fura-2. Pflug Arch Eur J Phy. 1996;431(6):977–83. doi: 10.1007/s004240050094. [DOI] [PubMed] [Google Scholar]
- Lin X, Webster P, Li Q, Chen S, Ouyang Y. Optical recordings of Ca2 signaling activities from identified inner ear cells in cochlear slices and hemicochleae. Brain Research Protocols. 2003;11:92–100. doi: 10.1016/s1385-299x(03)00019-9. [DOI] [PubMed] [Google Scholar]
- Lin T, Hires SA, Looger LL. Imaging neuronal activity with genetically encoded calcium indicators. Cold Spring Harb Protoc. 2012 doi: 10.1101/pdb.top069609. [DOI] [PubMed] [Google Scholar]
- Lo JF, Sinkala E, Eddington DT. Oxygen gradients for open well cellular cultures via microfluidic substrates. Lab on a Chip. 2010;10(18):2394–401. doi: 10.1039/c004660d. [DOI] [PMC free article] [PubMed] [Google Scholar]
- Mauleon G, Fall CP, Eddington DT. Precise spatial and temporal control of oxygen within in vitro brain slices via microfluidic gas channels. PLoS ONE. 2012;7(8):e43309. doi: 10.1371/journal.pone.0043309. [DOI] [PMC free article] [PubMed] [Google Scholar]
- Peterlin ZA, Kozloski J, Mao BQ, Tsiola A, Yuste R. Optical probing of neuronal circuits with calcium indicators. PNAS. 2000;97(7):3619–24. doi: 10.1073/pnas.97.7.3619. [DOI] [PMC free article] [PubMed] [Google Scholar]
- Peterson BL, Larson J, Buffenstein R, Park TJ, Fall CP. Blunted neuronal calcium response to hypoxia in naked mole-rat hippocampus. PLoS ONE. 2012;7(2):e31568. doi: 10.1371/journal.pone.0031568. [DOI] [PMC free article] [PubMed] [Google Scholar]
- Regehr WG, Tank DW. Selective fura-2 loading of presynaptic terminals and nerve cell processes by local perfusion in mammalian brain slice. Journal of Neuroscience Methods. 1991;37:111–9. doi: 10.1016/0165-0270(91)90121-f. [DOI] [PubMed] [Google Scholar]
- Roe MW, Lemasters JJ, Herman B. Assessment of fura-2 for measurements of cytosolic free calcium. Cell Calcium. 1990;11:63–73. doi: 10.1016/0143-4160(90)90060-8. [DOI] [PubMed] [Google Scholar]
- Small R, Monette R, Buchan AM, Morley P. Identification of calcium channels involved in neuronal injury in rat hippocampal slices subjected to oxygen and glucose deprivation. Brain Research. 1997;753:209–18. doi: 10.1016/s0006-8993(96)01385-6. [DOI] [PubMed] [Google Scholar]
- Smetters D, Majewska A, Yuste R. Detecting action potentials in neuronal populations with calcium imaging. METHODS: Companion to Methods in Enzymology. 1999;18:215–21. doi: 10.1006/meth.1999.0774. [DOI] [PubMed] [Google Scholar]
- Stosiek C, Garaschuk O, Holthoff K, Konnerth A. In vivo two-photon calcium imaging of neuronal networks. PNAS. 2003;100(12):7319–24. doi: 10.1073/pnas.1232232100. [DOI] [PMC free article] [PubMed] [Google Scholar]
- Yuste R, MacLean J, Vogelstein J, Paninski L. Imaging action potentials with calcium indicators. 2011. [DOI] [PubMed] [Google Scholar]