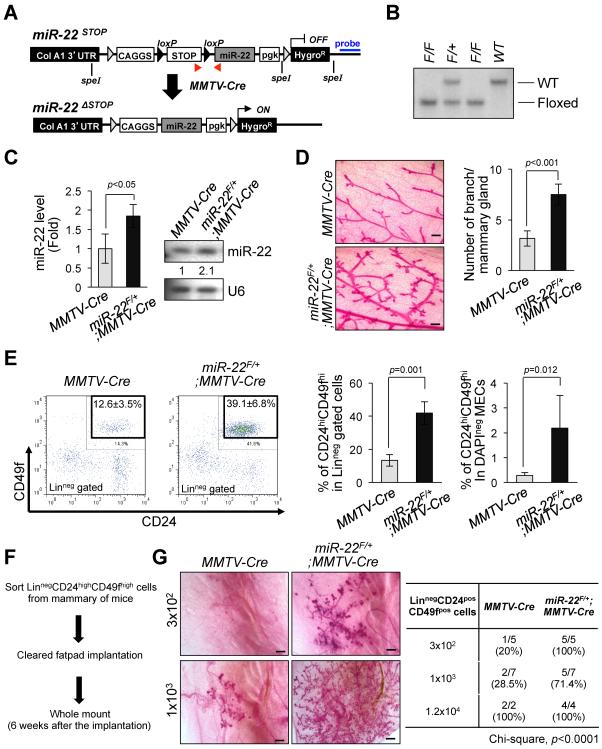
Figure 2. miR-22 increases mammary gland side-branching and stemness in vivo in transgenic mice.
(A) Schematic representation of the strategy for generation of floxed miR-22 mouse embryonic stem cells. Red arrows indicate the positions of primers used for genotyping the miR-22 transgenic mice. Blue line indicates the position of probe for the Southern blot analysis. The F1 floxed miR-22 founder mice were bred to MMTV-Cre strain to delete LoxP site.
(B) Genomic DNAs were isolated from the tails of miR-22-LoxP mice were digested by Spe I and subjected to Southern blot analysis.
(C) Total RNAs isolated from mammary gland tissues of miR-22F/+;MMTV-Cre mice were subjected to real-time qPCR (left) (n=4) or Northern blot analysis (right) to evaluate miR-22 expression.
(D) Whole mount analyses were conducted on 7-weeks old miR-22F/+;MMTV-Cre mice and MMTV-Cre littermates (left) and the number of mammary gland side-branches was quantified (right) (n=3). Scale bars, 500 μm.
(E) Distribution of CD45negCD31negCD140anegTer119neg mouse mammary cells according to their expression of CD24 and CD49f were analyzed on 7-weeks old miR-22F/+;MMTV-Cre mice and littermate controls (left). Mouse mammary stem cells (MSCs) according to their expression of CD24highCD49high in Lineagenegative (middle) or total mammary epithelial cells (right) were quantified by a flow cytometric analysis (n=4).
(F and G) Schematic representation of limiting dilution transplantation experiments with CD24highCD49fhigh MSCs (F). 3 × 10², 1 × 10³ or 1.2 × 10⁴ LinnegCD24highCD49high MSCs isolated from 7-weeks old miR-22F/+;MMTV-Cre mice and littermate controls were injected into the cleared fat-pad of 3-weeks old FVB/NJ female mice and whole mount analyses were then conducted at 6 weeks after injection (G). Representative images of mammary gland side-branches are shown in the left panel. The resulting data were also analyzed by Chi-square test (right).
“see also Figures S1H–S1J”.

