

Abstract
NO synthase (NOS) enzymes convert L-arginine to NO in two sequential reactions whose rates (kcat1 and kcat2) are both limited by the rate of ferric heme reduction (kr). An enzyme ferric heme-NO complex forms as an immediate product complex and then undergoes either dissociation (at a rate that we denote as kd) to release NO in a productive manner, or reduction (kr) to form a ferrous heme-NO complex (FeIINO) that must react with O2 (at a rate that we denote as kox) in a NO dioxygenase reaction that regenerates the ferric enzyme. The interplay of these five kinetic parameters (kcat1, kcat2, kr, kd, and kox) determine NOS specific activity, O2 concentration response, and pulsatile versus steady-state NO generation. Here we utilized stopped-flow spectroscopy and single catalytic turnover methods to characterize the individual temperature dependencies of the five kinetic parameters of rat neuronal NOS (nNOS). We then incorporated the measured kinetic values into computer simulations of the nNOS reaction using a global kinetic model to comprehensively model its temperature-dependent catalytic behaviors. Our results provide new mechanistic insights and also reveal that the different temperature dependencies of the five kinetic parameters significantly alter nNOS catalytic behaviors and NO release efficiency as a function of temperature.
Keywords: Nitric Oxide Synthase, Stopped-flow, Electron transfer, kox, Heme reduction, Enthalpy, Heme protein
Introduction
Nitric oxide (NO) is a biological mediator produced in animals by three NO synthase isozymes (NOS, EC 1.14.13.39): inducible NOS (iNOS), neuronal NOS (nNOS), and endothelial NOS (eNOS) [1;2]. NOS enzymes catalyze a stepwise oxidation of L-arginine (Arg) to form nitric oxide and citrulline [3–5]. In the first reaction Arg is hydroxylated to form Nω-hydroxy-L-arginine (NOHA), and in the second reaction the NOHA intermediate is oxidized to form NO and citrulline (Scheme 1) [1]. Both steps consume one molecule of O2 and utilize NADPH-derived reducing equivalents. NOS proteins are comprised of an N-terminal oxygenase domain and a C-terminal flavoprotein domain, with a calmodulin (CaM)-binding site connecting the two domains [6] and each NOS is only active as a homodimer [6;7]. The oxygenase domain binds Fe-protoporphyrin IX (heme), the substrate Arg, and the essential cofactor (6R)-tetrahydrobiopterin (H4B) [8;9], while the flavoprotein domain binds FAD, FMN, and NADPH [10–12]. During catalysis, the flavoprotein domain provides electrons to the heme in the NOS oxygenase domain, which enables the heme to bind O2 and initiate oxygen activation in both reactions of NO synthesis [13–15]. Heme reduction also requires that CaM be bound to NOS, and is rate-limiting for the NO biosynthetic steps.
Scheme 1.
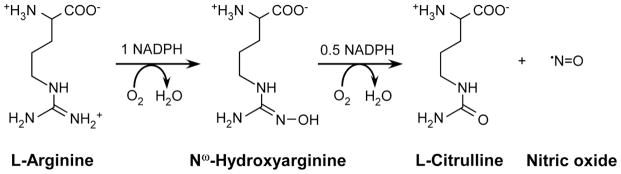
Biosynthesis of nitric oxide from L-arginine.
NOS enzymes operate under the constraint of being heme proteins that generate NO, a good heme-binding ligand. Indeed, their newly-made NO binds to the ferric heme many times before it can exit the enzyme [16]. How this intrinsic heme-NO binding event impacts NOS catalytic cycling is shown in Fig. 1, and has been previously discussed in detail [16–20]. The Arg to NO biosynthetic reactions (FeIII to FeIIINO steps in Fig. 1) involves two sequential oxidation reactions whose rates are both limited by the rate of ferric heme reduction (kr), because all subsequent catalytic steps in either reaction (termed kcat1 and kcat2 in Fig. 1) occur faster than kr. Once the ferric heme-NO product complex forms in NOS, it can either dissociate and enable release of NO into the medium (at a rate kd as shown in Fig. 1), or become reduced by the flavoprotein domain (at a rate kr′ in Fig. 1; thought to be equal to kr) [21] to form the enzyme ferrous heme-NO species (FeIINO), which releases NO extremely slowly [18;19]. Consequently, the FeIINO species must undergo reaction with O2 at a rate kox (Fig. 1) to regenerate the ferric enzyme and return to an active form. Thus, two cycles exist during steady state NO synthesis (Fig. 1): NO dissociation from the enzyme (kd) is part of a “productive cycle” that is essential for NOS bioactivity, whereas reduction of the FeIIINO product complex (kr′) channels NOS into a “futile cycle” that actually represents a NO dioxygenase activity. The rate constants for each step of NOS catalysis are shown in Supplemental Fig. S1.
Fig. 1. Global kinetic model for NOS catalysis.
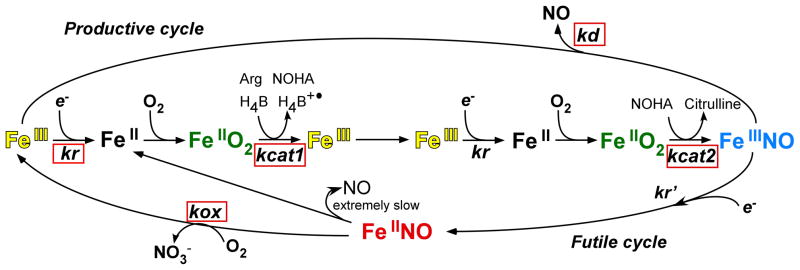
NOS enzymes start with their heme in the ferric state (left side, yellow FeIII). The FMN-to-heme electron transfers (designated kr) allow O2 to bind to heme to start catalysis, and are rate-limiting for the two sequential oxidation reactions (horizontal line). kcat1 and kcat2 are the conversion rates of the enzyme FeIIO2 species (green) to products in the L-Arg and Nω-hydroxy-L-arginine (NOHA) oxidation reactions, respectively. A ferric heme-NO product complex (FeIIINO, blue) can either release NO (kd) or become reduced (kr′) to a ferrous heme-NO complex (FeIINO, red), which reacts with O2 (kox) to regenerate ferric enzyme through a futile cycle that destroys the NO. The five kinetic parameters and reactions we studied are designated by the red boxes.
Observed rates for kr, kcat, kd, and kox have been measured in NOS enzymes in single catalytic turnover reactions [14;18;19;22–25]. However, because most of the measures have been obtained at only a single temperature (10 °C, or less often at 25 °C), little or nothing is understood regarding the temperature dependencies and thermodynamic properties of the individual steps, and how they combine to govern the catalytic behavior and overall activities of NOS enzymes. This information would improve our understanding NOS catalysis and enable accurate modeling of its catalytic cycle under physiologic temperatures and conditions. In this report, we poised rat nNOS at different points in the cycle, and utilized stopped flow spectroscopy to characterize the temperature dependence of five individual kinetic parameters (kr, kcat1, kcat2, kd, and kox). The thermodynamic parameters of these individual reactions provide new insights regarding NOS structure-reactivity relationships and provide a better understanding of its physiological relevance.
Results and Discussion
Temperature Dependence of Heme Reduction (kr)
We directly assessed electron transfer from FMN hydroquinone to heme using stopped-flow spectroscopy under anaerobic conditions. Heme reduction was monitored via the formation of the enzyme ferrous heme–CO complex at 444 nm. Once ferrous heme is formed by electron transfer from the FMN, the fast and stable binding of CO prevents accumulation of the ferrous species and makes the electron transfer reaction essentially irreversible. This mimics the normal condition of having O2 present to react with ferrous heme, and insures that the observed rate of heme reduction does not have a significant back reaction component. The reactions were initiated by mixing CaM-bound nNOS with excess NADPH [26], and heme reduction rates (kr) were measured at 5, 10, 15, 20, 25, 30 and 37 °C. Representative diode array spectra (Fig. 2, upper panel) and the resulting kinetic trace (Fig. 2, upper panel inset) are shown. We fit the kinetic traces to a bi-exponential function, with the initial fast phase representing an absorbance decrease due to flavin reduction by NADPH and the subsequent slower phase representing the absorbance increase due to heme reduction in the presence of CO. The observed rates obtained for heme reduction at each temperature are listed in Table 1. The heme reduction rate increased approximately 1.5-fold with every 10 degrees rise in temperature. Fitting the experimental data to the linearized form of the Arrhenius equation yielded an activation energy Ea = 31.5 kJ mol−1. A linear Eyring plot (Fig. 2, middle panel) of the data yielded the following values for the enthalpy and entropy of activation for the heme reduction step: ΔH‡ = +29.1 kJ mol−1; ΔS‡ = −128 J mol−1K−1 (Table 2). The derived Gibbs free energy of activation ΔG‡ at 25 °C was calculated to be 67.2 kJ mol−1. The ΔG‡ increases with temperature, which is expected, given the negative entropic contribution. The activation enthalpy and entropy values for heme reduction that we determined for nNOS are similar to values recently reported for human iNOS (36.9 kJ mol−1 and −89.7 J mol−1K−1 respectively), which were derived using a different measurement method (flash photolysis) [27]. This suggests similar mechanisms may govern heme reduction among NOS isozymes.
Fig. 2. Temperature-dependence of ferric heme reduction (kr) in nNOS.

Anaerobic ferric nNOS (~10 μM) was mixed at various temperatures with NADPH (100 μM) in CO-saturated buffer in the stopped flow apparatus and buildup of the FeIICO absorbance peak (444 nm) was used to measure the rate of heme reduction. Upper panel- Rapid scanning spectra recorded during a representative reaction run at 10 °C and the accompanying kinetics of spectral change (inset). Middle panel- Eyring plot of the measured heme reduction rates, with slope = −ΔH‡/R and the intercept = ΔS‡/R + ln(kB/h). Lower panel- Temperature dependence of the nNOS heme reduction rate in the context of the Marcus ET theory. The solid line represents a nonlinear least-squares fit of the data using equation 1 as described in the text. The derived Marcus parameters (λ and HDA) giving the best fit are reported in the Figure.
Table 1.
Measured rates (± SD) at different temperatures.
| Temperature (°C) | kr (s−1) | kcat1 (s−1) | kcat2 (s−1) | kd (s−1) | koxa (s−1) | NO synthesis (s−1) |
|---|---|---|---|---|---|---|
| 5 | 4.2 ± 0.3 | 9.2 ± 0.8 | 16.4 ± 1.9 | 1.6 ± 0.2 | 0.063 ± 0.002 | 0.12 ± 0.01 |
| 10 | 5.3 ± 0.2 | 13. 5 ± 1.3 | 29 ± 3 | 3.7 ± 0.3 | 0.081 ± 0.005 | 0.27 ± 0.02 |
| 15 | 6.5 ± 0.4 | 21 ± 2 | 52 ± 5 | 5.9 ± 0.2 | 0.102 ± 0.002 | 0.35 ± 0.03 |
| 20 | 8.1 ± 0.6 | 31 ± 3 | 93 ± 4 | 10.7 ± 0.1 | 0.130 ± 0.001 | 0.55 ± 0.05 |
| 25 | 10.4 ± 0.5 | 46 ± 3 | 162 ± 15 | 20.1 ± 1.5 | 0.161 ± 0.003 | 0.82 ± 0.04 |
| 30 | 12.7 ± 1.1 | 68 ± 5 | 278 ± 18 | 31 ± 1 | 0.211 ± 0.004 | 1.12 ± 0.10 |
| 37 | 17.2 ± 0.6 | 113 ± 9 | 572 ± 36 | 58 ± 6 | 0.254 ± 0.002 | 1.40 ± 0.08 |
Determined at ~ 202 μM O2, 180 μM O2, 162 μM O2, 145 μM O2, 135 μM O2, 125μM O2, and ~108 μM O2 at 5, 10, 15, 20, 25, 30 and 37 °C, respectively (i.e. half air saturated concentration at respective temperature).
Table 2.
Thermodynamic parameters for kr, kox, kd, NO synthesis, kcat1 and kcat2. Errors reported are SD from at least three measurements
| Reaction | Ea (kJ.mol−1) | ΔH‡ (kJ.mol−1) | ΔS‡ (J.mol−1K−1) |
|---|---|---|---|
| kr | 31.5 ± 0.5 | 29.1 ± 0.5 | −128 ± 3 |
| kcat1 | 57.1 ± 2.3 | 54.7 ± 2.3 | −29 ± 1 |
| kcat2 | 79.5 ± 2.7 | 77 ± 3 | +56 ± 2 |
| kd | 83.1 ± 1.7 | 80.7 ± 1.7 | +50 ± 1 |
| kox | 31.9 ± 1.0 | 29.4 ± 1.0 | −161 ± 14 |
| NO synthesis | 54.1 ± 4.5 | 51.7 ± 4.5 | −74 ± 9 |
Ea values are calculated from Arrhenius plot
Activation parameters of heme reduction have been determined for other heme proteins such as azurin, cytochrome c oxidase and cd1 nitrite reductase [28–31]. Particularly, activation parameters determined for interprotein electron transfer reactions, such as in cytochrome c-plastocyanin [32–34], indicate modest enthalpies and high negative entropies, similar to the values that we found for nNOS, for its putative inter-domain FMN-to-heme electron transfer. The high negative activation entropy determined for nNOS suggests that the rate-limiting elementary step of the heme reduction process is characterized by a relatively ordered transition state.
Because heme reduction in nNOS involves an electron transfer (ET) reaction between the FMN and heme prosthetic groups, we analyzed the temperature dependence data of heme reduction in the framework of the semi-classical Marcus theory describing nonadiabatic electron transfer reactions [35]. This approach has been successfully applied to several biological electron transfer systems in order to shed light on quantitative aspects of the ET step [36;37]. It is important to note that heme reduction in NOS enzymes is a relatively complex multi-step process. A protein conformational change that involves both long- and short-range motions are expected to bring the FMN domain into close proximity to the heme center in the NOSoxy domain [38;39]. Mutational and kinetic studies suggest that the FMN domain first undergoes a long range motion to swing away from the FNR domain and then undergoes short-range sampling motions to productively dock on the NOSoxy domain, which is in part guided by complementary charged residues on the domain-domain interface [11;39–41]. These conformational change(s) precede the actual ET and could conceivably influence the kinetics and thermodynamic behavior of the heme reduction that we observe. The ET process would be gated if the conformational change is rate-limiting, whereas if the actual FMN-to-heme ET step is rate-limiting, the process could be either true-ET or coupled-ET. In true-ET, the electron transfer step is rate-limiting and not kinetically influenced by preceding steps, while in coupled-ET the electron transfer reaction is still rate-limiting but is preceded by a relatively fast and thermodynamically unfavorable non-ET reaction such as conformational change. Although the FMN to heme ET in NOS enzymes has been reported to be conformationally-gated [42], a detailed study on this aspect is lacking. Application of the Marcus ET formalism to our temperature dependence data provides an opportunity to quantify parameters such as the required reorganization energy as well as electronic coupling between the FMN electron donor and heme electron acceptor during ET. The rate constant for nonadiabatic electron transfer, kET, is generally described by equations 1 and 2 which respectively, derive from the prediction that rates of ET exhibit Gaussian free-energy dependence, and from the fact that electronic coupling drops exponentially with distance between redox partners.
| (Equation 1) |
| (Equation 2) |
Where: λ is the reorganization energy, ΔG° is the thermodynamic driving force determined from the redox potential difference for the redox partners (FMN and Heme in this case). The other parameters have their usual meanings: Planck’s constant (h), the gas constant (R), and absolute temperature (T). HDA describes the electronic coupling between electron donor (FMN) and electron acceptor (Heme). In equation 2: ko =1013 s−1 is the characteristic maximum limit for kET when donor and acceptor are in van der Waals’ contact (i.e. at ro = 3 Å) and when no activation is involved (i.e. when and λ = −ΔG°). The value of parameter β reflects the nature of the intervening medium in mediating the ET, and a value of 1.4 Å−1 is widely used for proteins [36].
In Fig. 2 (lower panel) the heme reduction data as a function of temperature were fit using equation 1 to obtain estimates of the reorganization energy (λ) and the electronic coupling element (HDA). The ΔG° value used for the fitting was −0.030 eV (or −2.9 kJ mol−1). This driving force is determined from the difference of midpoint values of the FMN hydroquinone/semiquinone couple and the heme FeIII/FeIICO couple in nNOS [38;43–46]. Using this ΔG° value, the non-linear fitting yielded best-fit values for the reorganization energy λ = 139 kJ mol−1 (or ~1.4 eV) and an electronic coupling factor HDA = 0.2 cm−1. We have varied ΔG° to see if the values determined by fitting are affected by the driving force used. Changes as much as ±60 mV in ΔG° do not result in significant changes in the fitted values of λ or HDA. Fitting the same data to equation 2 gave a similar value for the reorganization energy λ = 135 kJ mol−1 (Supplemental Fig. S2, Upper panel), which is not significantly different from λ = 139 kJ mol−1 determined using equation 1.
The estimate for HDA in nNOS is within the range known for nonadiabatic electron transfer [35], while the estimated reorganization energy (λ = 1.4 eV) lies on the higher end but is still within the range of reorganizational energies reported for most physiological ET reactions (i.e. λ = 0.5 to 2.3 eV) [36]. The relatively high value of λ in our case reflects a possible coupling of ET to the pre-requisite conformational change needed to bring the FMN domain within a distance required for ET to the heme in the nNOSoxy domain. Whether an ET reaction is gated or coupled depends on the relative rates of the ET and prerequisite non-ET steps. An estimated value of Keq = 9.0 was reported for the FMN-FNR domain off/on conformational equilibrium for the reduced, CaM-bound nNOS at 10 °C [38], indicating that, once reduced, the FMN domain is mostly away from the FNR and thus in a conformation that could interact with nNOSoxy for ET. However, the corresponding koff value associated with the FNR-FMN equilibrium under this condition is not yet known, and in our experimental design the FMN domain must first receive electrons from the FNR to become reduced. Also, the Keq for the corresponding FMN-NOSoxy equilibrium has been studied in the CaM-bound nNOS poised at different redox states. The data indicate a low value (Keq ≤ 0.2) [47;48] exists in all cases. This suggests that very little FMN-nNOSoxy complex is present at equilibrium and that their interaction is intermittent and/or transient. Given the relatively slow rates for heme reduction that we observe in nNOS, the relatively high corresponding reorganization energy, and the unfavorable on/off thermodynamic equilibrium for the FMN-nNOSoxy interaction, ET from FMN to heme in nNOS is likely coupled to the pre-requisite conformational movement of the FMN domain. Similar ET reactions that are coupled to conformational equilibria are known. An example is the electron transfer reaction from methanol dehydrogenase to the heme in cytochrome c-551i where the electron transfer is rate-limiting but still influenced by a pre-requisite rapid but unfavorable conformational arrangement [49].
Our fit of the heme reduction versus temperature data to equation 2 also yielded an estimate for the distance ‘r’ (FMN-to-Heme distance) (Supplemental Fig. S2). The estimated distance at the time of the ET event is r ‘ 13.4 Å. It is important to note that this distance does not change significantly (r =13.1 Å) when the data is fit with equation 2 using the λ value found in nonlinear fitting with equation 1 (λ = 139 kJ mol−1) (Supplemental Fig. S2, Lower panel). This estimate is in excellent agreement with 9–15 Å FMN-to-heme distances proposed based on docking models for FMN-NOSoxy complexes [40;50]. The value is also consistent with the proposed range (12–13 Å) suggested for nNOS based on the kinetics of heme-to-FMN back electron transfer determined by pulse radiolysis [42] and the recent studies on FMN-heme coupling by pulsed EPR for human iNOS [51]. In this case a 18.8 Å distance between the FMN-N5 atom and the heme iron was determined, that could correspond to a FMN-heme distance as short as 13.1 Å [51]. Comparable distances have been reported in related flavocytochrome systems. For instance, a value of 18.4 Å has been reported for the FMN to heme iron distance in the complex between the heme and FMN-binding domain of cytochrome P450BM-3 [52].
Temperature dependence of the oxygenation reactions (kcat1 and kcat2)
The kcat1 and kcat2 parameters represent the conversion rates of the heme FeIIO2 species to products in the Arg hydroxylation and NOHA oxidation reactions, respectively. We utilized stopped-flow spectroscopy to compare the nNOS heme transitions that occur during the single turnover reactions as reported in previous studies [53;54]. The reactions were initiated by rapid-mixing an oxygen-containing buffer with pre-reduced ferrous nNOS proteins that contained H4B and either Arg or NOHA as substrate. For the Arg reactions we observed two consecutive heme transitions: FeII → FeIIO2 → FeIII and in the reaction with NOHA we observed three transitions: FeII → FeIIO2 → FeIIINO → FeIII. Global analysis of the spectral data according to these models yielded the spectrum of each species (Fig. 3A & B, upper panels). The two middle panels of Fig. 3 show how the concentration of each species changed with time during the reactions. Linear Eyring plots of the observed rates (Fig 3A & B, lower panels) show that both kcat1 and kcat2 increase as the temperature increases (Table 1), but do so according to significantly different ratios, such that the slope of kcat2 is 1.4 times higher than that of kcat1 (Fig 3A & B, lower panels). Fitting the experimental data to the Arrhenius equation yielded an activation energy Ea = 57.1 kJ mol−1 for kcat1 and 79.5 kJ mol−1 for kcat2. The linear Eyring plots gave the following values for the enthalpy and entropy of activation were derived for kcat1; ΔH‡ = +54.7 kJ mol−1; ΔS‡ = −29 J mol−1K−1 (Table 2), whereas the values for the enthalpy and entropy of activation derived for kcat2 are: ΔH‡ = +77 kJ mol−1; ΔS‡ = +56 J mol−1K−1 (Table 2). The thermodynamic parameters derived for kcat1 are distinguished from kcat2 by a negative entropic component. The relative entropic cost observed in the first catalytic step may be attributed to the necessary change in the hydrogen-bonding network expected at the active site upon the transformation of L-arginine to the enzyme bound N-hydroxy-L-arginine [55].
Fig. 3. Temperature dependence of the Arg and NOHA oxidation reactions (kcat1 and kcat2) measured by single catalytic turnover reactions.

Ferrous nNOSoxy containing H4B and either Arg or NOHA was mixed at various temperatures with air-saturated buffer in the stopped flow apparatus and diode array spectral data were collected. Upper panels, A & B show the spectrum of each heme species that was detected during each reaction as calculated by global analysis. Middle panels, A & B show the concentration versus time profiles for each heme species detected in each reaction. Lower panels, A & B show Eyring plots (ln(kcat/T) vs 1/T) for the kcat1 and kcat2 transitions.
Temperature Dependence of NO dissociation (kd)
A variety of studies [14;25;56;57] indicate that newly-formed NO binds to the NOS ferric heme before it can exit the enzyme. This causes a ferric heme–NO product complex to form at the end of each catalytic cycle in all NOS enzymes examined to date [19]. In the NOHA single turnover reactions there was a clear buildup of this immediate FeIIINO product complex (Fig. 3B, upper and middle panels), which allows us to determine the macroscopic off-rate of NO by monitoring its transition to ferric enzyme (kd parameter in Fig. 1). The macroscopic, observed dissociation rate (kd) of the ferric heme-NO product complex is an important parameter, because it impacts NOS enzyme distribution during catalysis and consequently, the steady-state NO synthesis activity [19;23;25]. Linear Eyring plots of the observed rates (Table 1 and Fig. 4, upper panel) revealed that the kd parameter has a relatively large temperature dependence, increasing more than three times every 10 degrees. The thermodynamic parameters of the reaction were derived from the linear Eyring plot and Arrhenius equation, and gave the following values: Ea = 83.1 kJ mol−1; ΔH‡ = 80.7 kJ mol−1; ΔS‡ = 50 J mol−1K−1 (Table 2). The activation energy for NO dissociation from FeIII-nNOS (kd) is quite close to the activation energy for citrulline formation by nNOS as reported earlier by Iwanaga (~103 kJ mol−1) [58]. Also, the relatively large positive activation entropy we calculate for the kd in nNOS is similar to values measured for NO dissociation from other ferric heme proteins like metmyoglobin (ΔH‡ = 78 kJ mol−1; ΔS‡ = 46 J mol−1K−1) [59] and the camphor-bound cytochrome P450cam (ΔH‡ = 84 kJ mol−1; ΔS‡ = 41 J mol−1K−1) [60]. Overall, the process of NO release from ferric heme in nNOS exhibits similar thermodynamic behavior to that of other heme proteins [59;60] as indicated by comparing Eyring plots for NO release data for the different heme proteins across a range of temperatures (Fig. 4, lower panel). Their similar thermodynamic behaviors is indicative of a common mechanism regulating NO dissociation from the ferric heme and its escape into solution.
Fig. 4. Temperature dependence of NO release (kd) from the FeIIINO product complex of nNOS.

NOHA single turnover reactions were run with nNOSoxy at different temperatures as described in Fig. 3. Upper panel- Eyring plot of measured NO release rates that were determined from the indicated spectral transition. Lower panel- Eyring plots of the NO release rates of nNOS (this work), metmyoglobin [59], and cytochrome P450cam proteins [60].
What is the basis for the relatively large temperature effect on kd? Binding and dissociation of diatomic ligands such as NO, CO, and O2 to heme proteins is generally accompanied by conformational changes that sometimes extend far beyond the local heme binding site [61–63]. This is a consequence of the disparate geometric, electronic, and electrostatic requirements imposed by ligand binding and dissociation. The local and global conformational changes and dynamic electrostatic interactions in the binding pocket modulate not only ligand affinities but also the discrimination between similar diatomic ligands [64;65]. The large temperature dependence of the observed rate of NO dissociation from ferric-heme in nNOS and other heme proteins may reflect the control of NO binding at multiple levels. At the heme level, heme distortions have been shown to be critical for stabilizing the FeIIINO complex, particularly in heme proteins whose physiological functions depend on controlling NO release from FeIII-heme [63]. In NOS proteins, the observed out-of-plane modes in the low frequency regions of Raman spectra of the FeIIINO species (iNOSoxy and eNOSoxy) have been assigned to heme distortions and have been shown to be critical in increasing dxy-dπ orbital overlap, which stabilizes the FeIII-heme-NO species [62]. At the global protein level, it has been suggested that inter-subunit interactions in the NOS dimer may be important in modulating heme distortion modes [62], which in turn would affect the heme-NO dissociation rate kd. Also, point mutagenesis studies on NOS enzymes identified amino acids near the opening of the heme pocket that help to kinetically gate release of NO [25;66;67]. Thus, the large dependence of kd on the temperature is likely due to a general temperature effect on both the heme and protein structural fluctuations and dynamics.
Reaction of O2 with the Enzyme Ferrous Heme-NO Complex (kox)
During NO synthesis a portion of the ferric heme-NO product complex is reduced by the NOS reductase domain and the resulting ferrous heme-NO complex must then react with O2 to return to the catalytic cycle. The rate of this reaction, termed kox, is a kinetic parameter (Fig. 1) that impacts NOS enzyme distribution during catalysis and, consequently, its steady state behavior and NO synthesis activity [19;68–70]. We determined kox values by mixing anaerobic samples of the nNOSoxy ferrous heme-NO species with an air-saturated solution in the stopped-flow spectrophotometer at 5, 10, 15, 20, 25, 30 and 37 °C and then following the reactions using a diode array detector. Figure 5 (upper panel) contains representative spectral data collected during the reaction of the nNOSoxy FeIINO complex with air-saturated buffer in the presence of both H4B and L-Arg at 10 °C. The spectral changes are consistent with conversion of the FeIINO complex into the FeIII high-spin form of nNOSoxy. The reaction was a single-step process with no discernible accumulation of intermediate species, as indicated by the several isosbestic points in the spectra (Fig. 5, upper panel) and by the single-exponential decay of the absorbance signal at two different wavelengths (Fig. 5, upper panel, inset), that followed the rate of FeIINO complex disappearance (436 nm) and the rate of ferric enzyme formation (393 nm). The spectral and fitting results obtained for reactions run at other temperatures were highly similar (data not shown), and the observed kox rates are listed in Table 1. The corresponding Eyring plot (Fig. 5, lower panel) and Arrhenius equation were used to calculate the following thermodynamic parameters: Ea = 31.9 kJ mol−1; ΔH‡ = 29.4 kJ mol−1; ΔS‡ = −161 J mol−1K−1) (Table 2).
Fig. 5. Temperature dependence of the O2 reaction with the FeIINO species (kox).

Anaerobic FeIINO nNOSoxy was reacted at various temperatures with air-saturated buffer in the stopped flow instrument. Upper panel- rapid scanning spectra recorded during a representative reaction, with arrows indicating the direction of the absorbance changes. Inset, absorbance changes versus time at 436 nm (FeIINO disappearance) and 393 nm (FeIII buildup). Lower panel- Eyring plot of the measured kox values.
The activation enthalpy for oxidation of the nNOS ferrous-heme complex is much lower than the values reported for oxidation of ferrous heme-nitrosyl hemoglobin and myoglobin or for their various mutants (ΔH‡ = 110–120 kJ mol−1) [61;71]. Their higher activation enthalpies have been rationalized in terms of a rate-limiting NO dissociation step governing the kinetics of the reversible ligand exchange reaction with O2 that precedes the irreversible oxidation [71]. In contrast, the relatively low ΔH‡ (29.4 kJ mol−1) that we measured for oxidation of the nNOS ferrous heme-nitrosyl species effectively argues against a NO dissociative mechanism being involved in this case, because it is insufficient for breaking the strong heme-FeII-NO bond. The relatively low activation barrier for the nNOS reaction supports our recent mechanistic investigation of nNOS and iNOS heme-nitrosyl oxidation reactions, which suggested it involves a comparatively fast and direct reaction between the ferrous heme-nitrosyl and dioxygen [24].
Steady-state NO synthesis activity
The steady state NO synthesis activity is a combined reflection of all the individual steps in Fig. 1, thus its temperature dependence provides apparent thermodynamic parameters for the global process. Table 1 contains NO synthesis activities we measured across the temperature range for this study (5 to 37 °C). The activity increased about 12-fold over this range. The activity data gave a linear Eyring plot (Fig. 6), from which we determined the following activation parameters: Ea = 54.1 kJ mol−1; ΔH‡ = 51.7 kJ mol−1; ΔS‡ = −74 J mol−1K−1 (Table 2). Our Ea value differs somewhat from an earlier study that reported an activation energy of 79.4 kJ mol−1 for the steady-state activity of nNOS, which was derived using measures of citrulline formation from [14C]L-Arg [58].
Fig. 6. Eyring plot of nNOS steady-state NO synthesis activities recorded at different temperatures.

Activities were measured in a conventional spectrophotometer using the oxyhemoglobin assay for NO as described in Experimental Methods.
Implications for nNOS catalytic behavior
Because the five kinetic parameters studied here differed in their temperature dependencies, this means that the distribution pattern of nNOS enzyme species during steady-state NO synthesis, and thus nNOS catalytic behaviors, will be temperature-dependent. We utilized the kinetic values we measured for the five parameters at three different temperatures (10, 25, and 37 °C) in computer simulations of the global kinetic model (Fig. 1) [21] to explore this concept. The model reports on the five main enzyme species that are present during steady-state NO synthesis, namely the ferric, ferrous, ferrous-O2 (or ferric-superoxy), ferric-NO, and ferrous-NO forms (Fig. 1). Any additional kinetic values for associated reactions (i.e., like O2 binding) that we needed for the simulations, besides the five kinetic parameters measured here, are described in Experimental procedures.
At 10 °C, the simulation showed that the fast kr relative to the slower kd and kox values causes the nNOS enzyme to exist predominantly as the ferrous-NO species during the steady state [19;21]. The modeled enzyme distribution indicated that ~10 % of nNOS is present as ferric enzyme and about 86% as the ferrous heme-NO species (Fig. 7) at 10 °C, with the remaining ~4% of nNOS mainly distributed between the FeIIO2 and FeIIINO species. This falls close to estimates reported in literature [16;19;21;72;73], which range between 67 and 85% ferrous heme-NO complex during steady state catalysis at 10 °C. However, our experimental data reveal that at higher temperatures the rate of ferric heme-NO dissociation (kd) increases significantly faster than the kr and the other kinetic parameters. The simulations indicate how this will alter the steady-state enzyme distributions: At 25 °C ~16% of nNOS is present as ferric enzyme and about 81% as the ferrous heme-NO species (Fig. 7), with the remaining ~3% of nNOS mainly distributed between the FeIIO2 and FeIIINO species, whereas at 37 °C, which is near the physiologic temperature of rats (~38 °C) [74;75], only about 73% of nNOS is present as the ferrous-NO species and ~24% is present as ferric enzyme. These simulations clearly show that rat nNOS gains in ferric character and has less ferrous heme–NO complex buildup during NO synthesis as the temperature increases. Overall, the different thermodynamic behaviors of the individual kinetic steps will cause nNOS to become more and more efficient at NO release as the temperature increases, while diminishing the enzyme cycling into the non-productive NO dioxygenase pathway (see Fig. 1).
Fig. 7. Temperature effect on the distribution of the five principal enzyme species during steady-state NO synthesis by nNOS.

Distributions were calculated by computer simulating a global kinetic model similar to the one shown in Fig. 1. Rate constants used for the calculations are given in Table 3. Steady state values were determined after 50s of simulated reaction although a steady state distribution is reached within 5–10 seconds in all cases.
A related consequence of the different temperature dependencies is that the relative contributions of the individual kinetic steps toward limiting the NO synthesis activity, and in determining the enzyme’s catalytic behaviors, will change with temperature. For example, at low temperatures like 10 °C, the kd and kr have similar magnitudes. This equivalence diminishes the release of NO due to its causing about half of the FeIIINO product complex to be diverted into the futile cycle. Consequently, this increases the impact of kox on the observed enzyme NO synthesis activity and on its apparent oxygen concentration dependence (i.e., apparent KmO2). Specifically, NO synthesis activity becomes much more dependent on the oxygen concentration relationship of the NO dioxygenase reaction described by kox [72], which displays a linear relationship with O2 concentration across the entire physiologic range [24]. However, at higher temperatures the kd becomes increasingly faster than the kr, which enables a quicker and greater release of NO from the FeIIINO product complex, consequently diminishing enzyme partitioning into the futile cycle. This in turn diminishes the role of kox in limiting the overall NO synthesis activity and diminishes its role in determining the apparent KmO2 for NO synthesis activity, such that the apparent KmO2 becomes more reflective of the oxygen concentration dependence of the biosynthetic reactions, which depend on the ferrous heme affinity for O2 binding. Thus, at higher temperatures (i.e., 37 °C) the contribution of kr in determining the overall NO synthesis activity is increased, while the contribution of kox is diminished, with accompanying changes in nNOS enzyme behavior and O2 concentration response.
Experimental Procedures
General Methods and Materials
All reagents and materials were obtained from Sigma-Aldrich, Amersham Biosciences or other sources as previously reported [20;70;76]. Absorption spectra and steady-state kinetic data were obtained using a Shimadzu UV-2401PC spectrophotometer. Stopped flow experiments were performed using a Hi-Tech Scientific KinetAsyst SF-61DX2 stopped-flow system equipped with anaerobic set-up and rapid scanning photodiode array detector. Data from multiple identical stopped-flow experiments were averaged to improve the signal-to-noise ratio. We didn’t see much difference in values when individual rates are averaged or the rate is calculated from averaged trace. We calculated SD values from the individual observed rates. The spectral traces were fit according to single or multiple exponential equations using software provided by the instrument manufacturer. The best fit was determined when adding further exponentials did not produce a significant improvement of the fit as judged from the residuals. All plots and some additional curve-fitting were done using Origin® 8.0 (OriginLab, Northampton, MA). Anaerobic samples were prepared in an air-tight cuvette using repeated cycles of vacuum followed by a positive pressure of catalyst-deoxygenated nitrogen gas.
Expression and Purification of Wild-type Protein
All proteins were purified in the presence of H4B and L-Arg as described previously [20;26;70;76]. The ferrous heme-CO adduct absorbing at 444 nm was used to measure heme protein content with an extinction coefficient of 444 = 74 mM−1 cm−1 (A444–A500) [76]. Purity of each protein was assessed by SDS-PAGE and spectral analysis.
NO Synthesis measurement
Steady-state NO synthesis was determined at 5, 10, 15, 20, 25, 30 and 37 °C using the spectrophotometric oxyhemoglobin assay as described previously [76].
Anaerobic Heme Reduction Measurements
The kinetics of heme reduction were analyzed at 5, 10, 15, 20, 25, 30 and 37 °C as described previously [20;26;70;76;77] using a stopped-flow apparatus and diode array detector (Hi-Tech Scientific KinetAsyst SF-61DX2) equipped for anaerobic analysis.
Reaction of Ferrous Heme-NO Complexes with Oxygen
The kinetics of Ferrous heme-NO oxidation were analyzed at 5, 10, 15, 20, 25, 30 and 37 °C as described previously in detail [24;70] using a stopped-flow apparatus and diode array detector (Hi-Tech Scientific KinetAsyst SF-61DX2) equipped for anaerobic analysis.
Single turnover reactions
Arginine hydroxylation experiments were carried out in a Hi-Tech SF61-DX2 stopped-flow instrument (Hi-Tech Scientific, Salisbury, UK) coupled to a diode array detector, as previously described [14]. The reactions were studied at 5, 10, 15, 20, 25, 30 and 37 °C in the presence of 50 μM H4B, 2.5 mM L-Arginine, 150 mM NaCl, 10 % Glycerol, 1 mM DTT in 40 mM EPPS buffer, pH 7.6. 10 μM nNOSoxy was titrated with sodium dithionite and mixed with air-saturated buffer at respective temperatures ([O2] = ~360 μM, 270 μM and ~215 μM at 10, 25 and 37 °C, respectively). NOHA oxidation was studied in the same conditions replacing L-Arginine by 1 mM NOHA. Sequential spectral data were fitted to A→ B→ C (Arg hydroxylation; FeII→ FeIIO2→FeIII) and A→ B→ C→ D (NOHA oxidation; FeII→FeIIO2→FeIIINO→FeIII) kinetic models using the Specfit/32 global analysis software, Version 3.0 (Spectrum Software Associates, Marlborough, MA) to obtain the spectra of the different species and the reaction rates. From the Specfit analysis software we calculated rates for kcat1 (during Arg hydroxylation) and kcat2 (during NOHA oxidation).
Temperature-Dependence and Thermodynamic Analysis
The natural log of the observed rates or rate constants for each averaged set of experimental data were plotted against the reciprocal of the absolute temperature. To calculate the activation energy, the data were then fit to the Arrhenius equation (Equation 3) using the linear fitting function using Origin® software (OriginLab, Northampton, MA). In this equation, A is the Arrhenius pre-exponential factor and R is the gas constant and Ea is activation energy. Activation enthalpy (ΔH‡) and activation entropy (ΔS‡) were calculated on the basis of Eyring equation (Equation 4) and Eyring plot (ln (k/T) vs. 1/T). Because the Gibbs free energy of activation (ΔG‡) depends on temperature, it can be calculated for each step at a given temperature and we calculated ΔG‡ at 25 °C using the Equation 5, whereas, ΔS‡ and ΔH‡ are virtually independent of temperature.
| (Equation 3) |
| (Equation 4) |
| (Equation 5) |
Where,
k = reaction rate constant
T = absolute temperature
R = gas constant (8.314472 J mol−1 K−1)
kB = Boltzmann constant(1.3806504 × 10⁻²³ J K−1)
h = Planck’s constant (6.626 × 10⁻³⁴J s)
ΔH‡ = Enthalpy of activation
ΔS‡ = Entropy of activation
ΔG‡ = Gibbs free energy of activation
Ea = Energy of activation
Simulations of nNOS Distribution During Steady-state NO Synthesis
The NO synthesis kinetics were simulated using the global model as implemented in MathCAD 7.0 [18;21] or Gepasi 3.30 [78]. Slight changes in the model were introduced to account for the pterin reduction step as shown in Fig. 1. Both methods yielded similar results. Simulations assume constant values for [O2] = ~360 μM, 270 μM and ~215 μM at 10, 25 and 37 °C, respectively, and [NADPH] = 40 μM. This approximation allows to treat all the processes as unimolecular reactions and assimilate the observed rates to apparent rate constants. Thus, for bimolecular reactions k2, k6 and k10 (Table 3) the observed rate is the product of the real rate constant multiplied by the concentration of oxygen. We base our simulations on the observed rates using a correction factor to estimate the value in air-saturated buffer instead of the half air-saturated experimental conditions. Experimentally observed oxidation rates (kox), which we derived at half air-saturated condition, were multiplied by a factor of 1.5 to approximate a full air-saturated condition according to the dependence observed previously [24]. We also multiplied the observed oxygen binding rates k2 and k6 values by a factor of 2.0 to get a full air-saturated condition assuming that the rate is proportional to [O2]. The values for heme reduction (kr), NO dissociation (kd), ferrous heme-NO oxidation (kox) and all other rates at different temperatures are shown in Table 3. Percentage of species in the steady state is calculated after 50 s of simulation, although a steady state distribution is reached within 5–10 seconds in all cases.
Table 3.
Calculated rates used for computer simulations
| Temperature | |||||||||
|---|---|---|---|---|---|---|---|---|---|
|
| |||||||||
| 5 °C | 10 °C | 15 °C | 20 °C | 25 °C | 30 °C | 37 °C | |||
| k1 | FeIII(a) → FeII(a) | kr | 4.16 | 5.26 | 6.54 | 8.11 | 10.4 | 12.7 | 17.2 |
| k2 | FeII(a) (+ O2) → FeIIO2(a) | 56.8 | 115 | 228 | 438 | 826 | 1526 | 3488 | |
| k3 | FeIIO2(a) → FeIII(b*) | kcat1 | 9.2 | 13.5 | 20.6 | 31 | 46.1 | 67.7 | 113 |
| k4 | FeIII(b*) → FeIII(b) | kr′ | 4.16 | 5.26 | 6.54 | 8.11 | 10.4 | 12.7 | 17.2 |
| k5 | FeIII(b) → FeII(b) | kr″ | 4.16 | 5.26 | 6.54 | 8.11 | 10.4 | 12.7 | 17.2 |
| k6 | FeII(b) (+ O2) → FeIIO2(b) | 56.8 | 115 | 228 | 438 | 826 | 1526 | 3488 | |
| k7 | FeIIO2(b) → FeIIINO | kcat2 | 16.4 | 28.7 | 52.2 | 92.9 | 162 | 278 | 572 |
| k8 | FeIIINO → FeIII(a) + NO | kd | 1.58 | 3.68 | 5.89 | 10.7 | 20.1 | 31.1 | 58.2 |
| k9 | FeIIINO → FeIINO | kr‴ | 4.16 | 5.26 | 6.54 | 8.11 | 10.4 | 12.7 | 17.2 |
| k10 | FeIINO (+ O2) → FeIII(a) + NOx | kox | 0.0948 | 0.121 | 0.153 | 0.191 | 0.233 | 0.31 | 0.381 |
| k11 | FeIINO → FeII(a) + NO | 0.000052 | 0.000096 | 0.00018 | 0.00031 | 0.00054 | 0.00092 | 0.0019 | |
denotes L-Arg-bound enzyme;
denotes NOHA-bound enzyme;
FeIII(b*) indicates the ferric enzyme with NOHA and H4B radical bound, see scheme in Fig. 1 for details. All values are in s-1. For bimolecular reactions (k2, k6, k10) the value used in the calculations is the product of the “actual” value and the concentration of oxygen, which is considered to remain constant during the reaction. For k2 and k6 the values used are the experimental values multiplied by 2 (assumes the rate is proportional to [O2], experimental values are determined in half air-saturated conditions). For k10 the values used are the experimentally determined values x 1.5 (based on observed oxygen dependence seen in Tejero et al [24]). k11 values are interpolated from Salerno et al paper [17].
Supplementary Material
Supplemental Fig. S1: Global kinetic model for NOS.
Supplemental Fig. S2: Analysis of the temperature dependence data of observed heme reduction rates for nNOS using the modified Marcus equation with distance dependence.
Acknowledgments
This work was supported by National Institutes of Health Grants GM51491 and HL58883 to D.J.S.
Abbreviations
- EPPS
4-(2-hydroxyethyl)-1-piperazinepropanesulfonic acid
- FeIIINO
ferric heme–NO complex
- FeIINO
ferrous heme–NO complex
- H4B
(6R)-5,6,7,8-tetrahydro-L-biopterin
- kd
dissociation rate of NO from the ferric heme–NO complex of NOS
- kox
oxidation rate of the ferrous heme–NO complex of NOS
- kr
reduction rate of heme by the reductase (flavoprotein) domain of NOS
- nNOS
neuronal nitric oxide synthase, nNOSoxy, oxygenase domain of the nNOS
- NOS
nitric oxide synthase
- CaM
Calmodulin
- FNR
ferredoxin NADP-reductase
Footnotes
The following supplementary material is available.
References
- 1.Griffith OW, Stuehr DJ. Nitric oxide synthases: properties and catalytic mechanism. Annu Rev Physiol. 1995;57:707–736. doi: 10.1146/annurev.ph.57.030195.003423. [DOI] [PubMed] [Google Scholar]
- 2.Knowles RG, Moncada S. Nitric oxide synthases in mammals. Biochem J. 1994;298 (Pt 2):249–258. doi: 10.1042/bj2980249. [DOI] [PMC free article] [PubMed] [Google Scholar]
- 3.Alderton WK, Cooper CE, Knowles RG. Nitric oxide synthases: structure, function and inhibition. Biochem J. 2001;357:593–615. doi: 10.1042/0264-6021:3570593. [DOI] [PMC free article] [PubMed] [Google Scholar]
- 4.Gorren ACF, List BM, Schrammel A, Pitters E, Hemmens B, Werner ER, Schmidt K, Mayer B. Tetrahydrobiopterin-free neuronal nitric oxide synthase: Evidence for two identical highly anticooperative pteridine binding sites. Biochemistry. 1996;35:16735–16745. doi: 10.1021/bi961931j. [DOI] [PubMed] [Google Scholar]
- 5.Wei CC, Crane BR, Stuehr DJ. Tetrahydrobiopterin radical enzymology. Chem Rev. 2003;103:2365–2383. doi: 10.1021/cr0204350. [DOI] [PubMed] [Google Scholar]
- 6.Masters BS, McMillan K, Sheta EA, Nishimura JS, Roman LJ, Martasek P. Neuronal nitric oxide synthase, a modular enzyme formed by convergent evolution: structure studies of a cysteine thiolate-liganded heme protein that hydroxylates L-arginine to produce NO. as a cellular signal. FASEB J. 1996;10:552–558. doi: 10.1096/fasebj.10.5.8621055. [DOI] [PubMed] [Google Scholar]
- 7.Stuehr DJ. Structure-function aspects in the nitric oxide synthases. Annu Rev Pharmacol Toxicol. 1997;37:339–359. doi: 10.1146/annurev.pharmtox.37.1.339. [DOI] [PubMed] [Google Scholar]
- 8.Crane BR, Arvai AS, Ghosh DK, Wu C, Getzoff ED, Stuehr DJ, Tainer JA. Structure of nitric oxide synthase oxygenase dimer with pterin and substrate. Science. 1998;279:2121–2126. doi: 10.1126/science.279.5359.2121. [DOI] [PubMed] [Google Scholar]
- 9.Fischmann TO, Hruza A, Niu XD, Fossetta JD, Lunn CA, Dolphin E, Prongay AJ, Reichert P, Lundell DJ, Narula SK, Weber PC. Structural characterization of nitric oxide synthase isoforms reveals striking active-site conservation. Nat Struct Biol. 1999;6:233–242. doi: 10.1038/6675. [DOI] [PubMed] [Google Scholar]
- 10.Gachhui R, Presta A, Bentley DF, Abu-Soud HM, McArthur R, Brudvig G, Ghosh DK, Stuehr DJ. Characterization of the reductase domain of rat neuronal nitric oxide synthase generated in the methylotrophic yeast Pichia pastoris. Calmodulin response is complete within the reductase domain itself. J Biol Chem. 1996;271:20594–20602. doi: 10.1074/jbc.271.34.20594. [DOI] [PubMed] [Google Scholar]
- 11.Garcin ED, Bruns CM, Lloyd SJ, Hosfield DJ, Tiso M, Gachhui R, Stuehr DJ, Tainer JA, Getzoff ED. Structural basis for isozyme-specific regulation of electron transfer in nitric-oxide synthase. J Biol Chem. 2004;279:37918–37927. doi: 10.1074/jbc.M406204200. [DOI] [PubMed] [Google Scholar]
- 12.Sheta EA, McMillan K, Masters BS. Evidence for a bidomain structure of constitutive cerebellar nitric oxide synthase. J Biol Chem. 1994;269:15147–15153. [PubMed] [Google Scholar]
- 13.Ledbetter AP, McMillan K, Roman LJ, Masters BS, Dawson JH, Sono M. Low-temperature stabilization and spectroscopic characterization of the dioxygen complex of the ferrous neuronal nitric oxide synthase oxygenase domain. Biochemistry. 1999;38:8014–8021. doi: 10.1021/bi990619h. [DOI] [PubMed] [Google Scholar]
- 14.Wang ZQ, Wei CC, Stuehr DJ. A conserved tryptophan 457 modulates the kinetics and extent of N-hydroxy-L-arginine oxidation by inducible nitric-oxide synthase. J Biol Chem. 2002;277:12830–12837. doi: 10.1074/jbc.M111967200. [DOI] [PubMed] [Google Scholar]
- 15.Wei CC, Wang ZQ, Wang Q, Meade AL, Hemann C, Hille R, Stuehr DJ. Rapid kinetic studies link tetrahydrobiopterin radical formation to heme-dioxy reduction and arginine hydroxylation in inducible nitric-oxide synthase. J Biol Chem. 2001;276:315–319. doi: 10.1074/jbc.M008441200. [DOI] [PubMed] [Google Scholar]
- 16.Abu-Soud HM, Wang J, Rousseau DL, Fukuto JM, Ignarro LJ, Stuehr DJ. Neuronal nitric oxide synthase self-inactivates by forming a ferrous-nitrosyl complex during aerobic catalysis. J Biol Chem. 1995;270:22997–23006. doi: 10.1074/jbc.270.39.22997. [DOI] [PubMed] [Google Scholar]
- 17.Salerno JC. Neuronal nitric oxide synthase: prototype for pulsed enzymology. FEBS Lett. 2008;582:1395–1399. doi: 10.1016/j.febslet.2008.03.051. [DOI] [PubMed] [Google Scholar]
- 18.Santolini J, Meade AL, Stuehr DJ. Differences in three kinetic parameters underpin the unique catalytic profiles of nitric-oxide synthases I, II, and III. J Biol Chem. 2001;276:48887–48898. doi: 10.1074/jbc.M108666200. [DOI] [PubMed] [Google Scholar]
- 19.Stuehr DJ, Santolini J, Wang ZQ, Wei CC, Adak S. Update on mechanism and catalytic regulation in the NO synthases. J Biol Chem. 2004;279:36167–36170. doi: 10.1074/jbc.R400017200. [DOI] [PubMed] [Google Scholar]
- 20.Haque MM, Panda K, Tejero J, Aulak KS, Fadlalla MA, Mustovich AT, Stuehr DJ. A connecting hinge represses the activity of endothelial nitric oxide synthase. Proc Natl Acad Sci U S A. 2007;104:9254–9259. doi: 10.1073/pnas.0700332104. [DOI] [PMC free article] [PubMed] [Google Scholar]
- 21.Santolini J, Adak S, Curran CM, Stuehr DJ. A kinetic simulation model that describes catalysis and regulation in nitric-oxide synthase. J Biol Chem. 2001;276:1233–1243. doi: 10.1074/jbc.M006858200. [DOI] [PubMed] [Google Scholar]
- 22.Adak S, Bilwes AM, Panda K, Hosfield D, Aulak KS, McDonald JF, Tainer JA, Getzoff ED, Crane BR, Stuehr DJ. Cloning, expression, and characterization of a nitric oxide synthase protein from Deinococcus radiodurans. Proc Natl Acad Sci U S A. 2002;99:107–112. doi: 10.1073/pnas.012470099. [DOI] [PMC free article] [PubMed] [Google Scholar]
- 23.Ray SS, Tejero J, Wang ZQ, Dutta T, Bhattacharjee A, Regulski M, Tully T, Ghosh S, Stuehr DJ. Oxygenase domain of Drosophila melanogaster nitric oxide synthase: unique kinetic parameters enable a more efficient NO release. Biochemistry. 2007;46:11857–11864. doi: 10.1021/bi700803p. [DOI] [PubMed] [Google Scholar]
- 24.Tejero J, Santolini J, Stuehr DJ. Fast ferrous heme-NO oxidation in nitric oxide synthases. FEBS J. 2009;276:4505–4514. doi: 10.1111/j.1742-4658.2009.07157.x. [DOI] [PMC free article] [PubMed] [Google Scholar]
- 25.Wang ZQ, Wei CC, Sharma M, Pant K, Crane BR, Stuehr DJ. A conserved Val to Ile switch near the heme pocket of animal and bacterial nitric-oxide synthases helps determine their distinct catalytic profiles. J Biol Chem. 2004;279:19018–19025. doi: 10.1074/jbc.M311663200. [DOI] [PubMed] [Google Scholar]
- 26.Adak S, Aulak KS, Stuehr DJ. Chimeras of nitric-oxide synthase types I and III establish fundamental correlates between heme reduction, heme-NO complex formation, and catalytic activity. J Biol Chem. 2001;276:23246–23252. doi: 10.1074/jbc.M102509200. [DOI] [PubMed] [Google Scholar]
- 27.Li W, Chen L, Fan W, Feng C. Comparing the temperature dependence of FMN to heme electron transfer in full length and truncated inducible nitric oxide synthase proteins. FEBS Lett. 2012;586:159–162. doi: 10.1016/j.febslet.2011.12.009. [DOI] [PMC free article] [PubMed] [Google Scholar]
- 28.Farver O, Pecht I. Long-range intramolecular electron transfer in azurins. Proc Natl Acad Sci U S A. 1989;86:6968–6972. doi: 10.1073/pnas.86.18.6968. [DOI] [PMC free article] [PubMed] [Google Scholar]
- 29.Farver O, Einarsdottir O, Pecht I. Electron transfer rates and equilibrium within cytochrome c oxidase. Eur J Biochem. 2000;267:950–954. doi: 10.1046/j.1432-1327.2000.01072.x. [DOI] [PubMed] [Google Scholar]
- 30.Farver O, Kroneck PM, Zumft WG, Pecht I. Intramolecular electron transfer in cytochrome cd(1) nitrite reductase from Pseudomonas stutzeri; kinetics and thermodynamics. Biophys Chem. 2002;98:27–34. doi: 10.1016/s0301-4622(02)00082-0. [DOI] [PubMed] [Google Scholar]
- 31.Farver O, Brunori M, Cutruzzola F, Rinaldo S, Wherland S, Pecht I. Intramolecular electron transfer in Pseudomonas aeruginosa cd(1) nitrite reductase: thermodynamics and kinetics. Biophys J. 2009;96:2849–2856. doi: 10.1016/j.bpj.2008.12.3937. [DOI] [PMC free article] [PubMed] [Google Scholar]
- 32.Chien JC, Gibson HL, Dickinson LC. Ferricytochrome c oxidation of cobaltocytochrome c. Comparison of experiments with electron-transfer theories. Biochemistry. 1978;17:2579–2584. doi: 10.1021/bi00606a019. [DOI] [PubMed] [Google Scholar]
- 33.Ivkovic-Jensen MM, Kostic NM. Effects of temperature on the kinetics of the gated electron-transfer reaction between zinc cytochrome c and plastocyanin. Analysis of configurational fluctuation of the diprotein complex. Biochemistry. 1996;35:15095–15106. doi: 10.1021/bi961608g. [DOI] [PubMed] [Google Scholar]
- 34.King GC, Binstead RA, Wright PE. NMR and kinetic characterization of the interaction between French bean plastocyanin and horse cytochrome c. Biochim Biophys Acta. 1985;806:262–271. doi: 10.1016/0005-2728(85)90104-5. [DOI] [PubMed] [Google Scholar]
- 35.Marcus RA, Sutin N. Electron Transfers in Chemistry and Biology. Biochimica et Biophysica Acta. 1985;811:265–322. [Google Scholar]
- 36.Davidson VL. Protein Control of True, Gated, and Coupled Electron Transfer Reactions. Acc Chem Res. 2008;41:730–738. doi: 10.1021/ar700252c. [DOI] [PMC free article] [PubMed] [Google Scholar]
- 37.Gray HB, Winkler JR. Electron flow through metalloproteins. Biochim Biophys Acta. 2010;1797:1563–1572. doi: 10.1016/j.bbabio.2010.05.001. [DOI] [PubMed] [Google Scholar]
- 38.Ilagan RP, Tiso M, Konas DW, Hemann C, Durra D, Hille R, Stuehr DJ. Differences in a conformational equilibrium distinguish catalysis by the endothelial and neuronal nitric-oxide synthase flavoproteins. J Biol Chem. 2008;283:19603–19615. doi: 10.1074/jbc.M802914200. [DOI] [PMC free article] [PubMed] [Google Scholar]
- 39.Stuehr DJ, Tejero J, Haque MM. Structural and mechanistic aspects of flavoproteins: electron transfer through the nitric oxide synthase flavoprotein domain. FEBS J. 2009;276:3959–3974. doi: 10.1111/j.1742-4658.2009.07120.x. [DOI] [PMC free article] [PubMed] [Google Scholar]
- 40.Tejero J, Hannibal L, Mustovich A, Stuehr DJ. Surface charges and regulation of FMN to heme electron transfer in nitric-oxide synthase. J Biol Chem. 2010;285:27232–27240. doi: 10.1074/jbc.M110.138842. [DOI] [PMC free article] [PubMed] [Google Scholar]
- 41.Xia C, Misra I, Iyanagi T, Kim JJ. Regulation of interdomain interactions by calmodulin in inducible nitric-oxide synthase. J Biol Chem. 2009;284:30708–30717. doi: 10.1074/jbc.M109.031682. [DOI] [PMC free article] [PubMed] [Google Scholar]
- 42.Kobayashi K, Tagawa S, Daff S, Sagami I, Shimizu T. Rapid calmodulin-dependent interdomain electron transfer in neuronal nitric-oxide synthase measured by pulse radiolysis. J Biol Chem. 2001;276:39864–39871. doi: 10.1074/jbc.M102537200. [DOI] [PubMed] [Google Scholar]
- 43.Gao YT, Smith SM, Weinberg JB, Montgomery HJ, Newman E, Guillemette JG, Ghosh DK, Roman LJ, Martasek P, Salerno JC. Thermodynamics of oxidation-reduction reactions in mammalian nitric-oxide synthase isoforms. J Biol Chem. 2004;279:18759–18766. doi: 10.1074/jbc.M308936200. [DOI] [PubMed] [Google Scholar]
- 44.Noble MA, Munro AW, Rivers SL, Robledo L, Daff SN, Yellowlees LJ, Shimizu T, Sagami I, Guillemette JG, Chapman SK. Potentiometric analysis of the flavin cofactors of neuronal nitric oxide synthase. Biochemistry. 1999;38:16413–16418. doi: 10.1021/bi992150w. [DOI] [PubMed] [Google Scholar]
- 45.Ost TW, Daff S. Thermodynamic and kinetic analysis of the nitrosyl, carbonyl, and dioxy heme complexes of neuronal nitric-oxide synthase. The roles of substrate and tetrahydrobiopterin in oxygen activation. J Biol Chem. 2005;280:965–973. doi: 10.1074/jbc.M411191200. [DOI] [PubMed] [Google Scholar]
- 46.Presta A, Weber-Main AM, Stankovich MT, Stuehr D. Comparative effects of substrates and pterin cofactor on the heme midpoint potential in inducible and neuronal nitric oxide synthases. J Am Chem Soc. 1998;120:9460–9465. [Google Scholar]
- 47.Ilagan RP, Tejero J, Aulak KS, Ray SS, Hemann C, Wang ZQ, Gangoda M, Zweier JL, Stuehr DJ. Regulation of FMN subdomain interactions and function in neuronal nitric oxide synthase. Biochemistry. 2009;48:3864–3876. doi: 10.1021/bi8021087. [DOI] [PMC free article] [PubMed] [Google Scholar]
- 48.Salerno JC, Ray K, Poulos T, Li H, Ghosh DK. Calmodulin activates neuronal nitric oxide synthase by enabling transitions between conformational states. FEBS Lett. 2013;587:44–47. doi: 10.1016/j.febslet.2012.10.039. [DOI] [PubMed] [Google Scholar]
- 49.Harris TK, Davidson VL, Chen L, Mathews FS, Xia ZX. Ionic strength dependence of the reaction between methanol dehydrogenase and cytochrome c-551i: evidence of conformationally coupled electron transfer. Biochemistry. 1994;33:12600–12608. doi: 10.1021/bi00208a010. [DOI] [PubMed] [Google Scholar]
- 50.Wei CC, Wang ZQ, Tejero J, Yang YP, Hemann C, Hille R, Stuehr DJ. Catalytic Reduction of a Tetrahydrobiopterin Radical within Nitric-oxide Synthase. J Biol Chem. 2008;283:11734–11742. doi: 10.1074/jbc.M709250200. [DOI] [PMC free article] [PubMed] [Google Scholar]
- 51.Astashkin AV, Elmore BO, Fan W, Guillemette JG, Feng C. Pulsed EPR determination of the distance between heme iron and FMN centers in a human inducible nitric oxide synthase. J Am Chem Soc. 2010;132:12059–12067. doi: 10.1021/ja104461p. [DOI] [PMC free article] [PubMed] [Google Scholar]
- 52.Sevrioukova IF, Hazzard JT, Tollin G, Poulos TL. The FMN to heme electron transfer in cytochrome P450BM-3. Effect of chemical modification of cysteines engineered at the FMN-heme domain interaction site. J Biol Chem. 1999;274:36097–36106. doi: 10.1074/jbc.274.51.36097. [DOI] [PubMed] [Google Scholar]
- 53.Tejero J, Biswas A, Wang ZQ, Page RC, Haque MM, Hemann C, Zweier JL, Misra S, Stuehr DJ. Stabilization and characterization of a heme-oxy reaction intermediate in inducible nitric-oxide synthase. J Biol Chem. 2008;283:33498–33507. doi: 10.1074/jbc.M806122200. [DOI] [PMC free article] [PubMed] [Google Scholar]
- 54.Tejero J, Biswas A, Haque MM, Wang ZQ, Hemann C, Varnado CL, Novince Z, Hille R, Goodwin DC, Stuehr DJ. Mesohaem substitution reveals how haem electronic properties can influence the kinetic and catalytic parameters of neuronal NO synthase. Biochem J. 2011;433:163–174. doi: 10.1042/BJ20101353. [DOI] [PubMed] [Google Scholar]
- 55.Giroud C, Moreau M, Mattioli TA, Balland V, Boucher JL, Xu-Li Y, Stuehr DJ, Santolini J. Role of arginine guanidinium moiety in nitric-oxide synthase mechanism of oxygen activation. J Biol Chem. 2010;285:7233–7245. doi: 10.1074/jbc.M109.038240. [DOI] [PMC free article] [PubMed] [Google Scholar]
- 56.Boggs S, Huang L, Stuehr DJ. Formation and reactions of the heme-dioxygen intermediate in the first and second steps of nitric oxide synthesis as studied by stopped-flow spectroscopy under single-turnover conditions. Biochemistry. 2000;39:2332–2339. doi: 10.1021/bi9920228. [DOI] [PubMed] [Google Scholar]
- 57.Feng C, Tollin G. Regulation of interdomain electron transfer in the NOS output state for NO production. Dalton Trans. 2009:6692–6700. doi: 10.1039/b902884f. [DOI] [PMC free article] [PubMed] [Google Scholar]
- 58.Iwanaga T, Yamazaki T, Kominami S. Kinetic studies on the successive reaction of neuronal nitric oxide synthase from L-arginine to nitric oxide and L-citrulline. Biochemistry. 1999;38:16629–16635. doi: 10.1021/bi991277i. [DOI] [PubMed] [Google Scholar]
- 59.Laverman LE, Wanat A, Oszajca J, Stochel G, Ford PC, van ER. Mechanistic studies on the reversible binding of nitric oxide to metmyoglobin. J Am Chem Soc. 2001;123:285–293. doi: 10.1021/ja001696z. [DOI] [PubMed] [Google Scholar]
- 60.Franke A, Stochel G, Jung C, van ER. Substrate binding favors enhanced NO binding to P450cam. J Am Chem Soc. 2004;126:4181–4191. doi: 10.1021/ja038774d. [DOI] [PubMed] [Google Scholar]
- 61.Ford PC. Probing fundamental mechanisms of nitric oxide reactions with metal centers. Pure and Applied Chemistry. 2004;76:335–350. [Google Scholar]
- 62.Li D, Stuehr DJ, Yeh SR, Rousseau DL. Heme distortion modulated by ligand-protein interactions in inducible nitric-oxide synthase. J Biol Chem. 2004;279:26489–26499. doi: 10.1074/jbc.M400968200. [DOI] [PubMed] [Google Scholar]
- 63.Walker FA. Nitric oxide interaction with insect nitrophorins and thoughts on the electron configuration of the {FeNO}6 complex. J Inorg Biochem. 2005;99:216–236. doi: 10.1016/j.jinorgbio.2004.10.009. [DOI] [PubMed] [Google Scholar]
- 64.Jain R, Chan MK. Mechanisms of ligand discrimination by heme proteins. J Biol Inorg Chem. 2003;8:1–11. doi: 10.1007/s00775-002-0405-8. [DOI] [PubMed] [Google Scholar]
- 65.Sigfridsson E, Ryde U. Theoretical study of the discrimination between O(2) and CO by myoglobin. J Inorg Biochem. 2002;91:101–115. doi: 10.1016/s0162-0134(02)00426-9. [DOI] [PubMed] [Google Scholar]
- 66.Wang ZQ, Wei CC, Stuehr DJ. How does a valine residue that modulates heme-NO binding kinetics in inducible NO synthase regulate enzyme catalysis? J Inorg Biochem. 2010;104:349–356. doi: 10.1016/j.jinorgbio.2009.11.006. [DOI] [PubMed] [Google Scholar]
- 67.Whited CA, Warren JJ, Lavoie KD, Weinert EE, Agapie T, Winkler JR, Gray HB. Gating NO release from nitric oxide synthase. J Am Chem Soc. 2012;134:27–30. doi: 10.1021/ja2069533. [DOI] [PMC free article] [PubMed] [Google Scholar]
- 68.Adak S, Wang Q, Stuehr DJ. Molecular basis for hyperactivity in tryptophan 409 mutants of neuronal NO synthase. J Biol Chem. 2000;275:17434–17439. doi: 10.1074/jbc.M000846200. [DOI] [PubMed] [Google Scholar]
- 69.Adak S, Stuehr DJ. A proximal tryptophan in NO synthase controls activity by a novel mechanism. J Inorg Biochem. 2001;83:301–308. doi: 10.1016/s0162-0134(00)00176-8. [DOI] [PubMed] [Google Scholar]
- 70.Haque MM, Fadlalla M, Wang ZQ, Ray SS, Panda K, Stuehr DJ. Neutralizing a surface charge on the FMN subdomain increases the activity of neuronal nitric-oxide synthase by enhancing the oxygen reactivity of the enzyme heme-nitric oxide complex. J Biol Chem. 2009;284:19237–19247. doi: 10.1074/jbc.M109.013144. [DOI] [PMC free article] [PubMed] [Google Scholar]
- 71.Moller JKS, Skibsted LH. Mechanism of nitrosylmyoglobin autoxidation: Temperature and oxygen pressure effects on the two consecutive reactions. Chemistry-A European Journal. 2004;10:2291–2300. doi: 10.1002/chem.200305368. [DOI] [PubMed] [Google Scholar]
- 72.Abu-Soud HM, Rousseau DL, Stuehr DJ. Nitric oxide binding to the heme of neuronal nitric-oxide synthase links its activity to changes in oxygen tension. J Biol Chem. 1996;271:32515–32518. doi: 10.1074/jbc.271.51.32515. [DOI] [PubMed] [Google Scholar]
- 73.Adak S, Crooks C, Wang Q, Crane BR, Tainer JA, Getzoff ED, Stuehr DJ. Tryptophan 409 controls the activity of neuronal nitric-oxide synthase by regulating nitric oxide feedback inhibition. J Biol Chem. 1999;274:26907–26911. doi: 10.1074/jbc.274.38.26907. [DOI] [PubMed] [Google Scholar]
- 74.Briese E. Normal body temperature of rats: the setpoint controversy. Neurosci Biobehav Rev. 1998;22:427–436. doi: 10.1016/s0149-7634(97)00051-1. [DOI] [PubMed] [Google Scholar]
- 75.Owens NC, Ootsuka Y, Kanosue K, McAllen RM. Thermoregulatory control of sympathetic fibres supplying the rat’s tail. J Physiol. 2002;543:849–858. doi: 10.1113/jphysiol.2002.023770. [DOI] [PMC free article] [PubMed] [Google Scholar]
- 76.Panda K, Haque MM, Garcin-Hosfield ED, Durra D, Getzoff ED, Stuehr DJ. Surface charge interactions of the FMN module govern catalysis by nitric-oxide synthase. J Biol Chem. 2006;281:36819–36827. doi: 10.1074/jbc.M606129200. [DOI] [PubMed] [Google Scholar]
- 77.Adak S, Santolini J, Tikunova S, Wang Q, Johnson JD, Stuehr DJ. Neuronal nitric-oxide synthase mutant (Ser-1412 --> Asp) demonstrates surprising connections between heme reduction, NO complex formation, and catalysis. J Biol Chem. 2001;276:1244–1252. doi: 10.1074/jbc.M006857200. [DOI] [PubMed] [Google Scholar]
- 78.Mendes P. Biochemistry by numbers: simulation of biochemical pathways with Gepasi 3. Trends Biochem Sci. 1997;22:361–363. doi: 10.1016/s0968-0004(97)01103-1. [DOI] [PubMed] [Google Scholar]
Associated Data
This section collects any data citations, data availability statements, or supplementary materials included in this article.
Supplementary Materials
Supplemental Fig. S1: Global kinetic model for NOS.
Supplemental Fig. S2: Analysis of the temperature dependence data of observed heme reduction rates for nNOS using the modified Marcus equation with distance dependence.