Abstract
Background & objectives:
Several studies have been conducted in India to determine the prevalence of learning disabilities in school children which has been reported to be 3-10 per cent among students population. The present study was conducted to find out prevalence of specific developmental disorder of scholastic skills in students of classes VII to XII and to find out feasibility of screening tool in Chandigarh, India.
Methods:
A cross-sectional study on school students was carried out in two phases. The students were drawn from classes VII to XII from 10 schools of Chandigarh, India. Details of academic performance of all the students was taken, subjectively from class teachers and objectively from the marks obtained in the last academic session. In phase I, 2402 students were assessed. In phase II, 108 students were randomly selected for evaluation for assessing sensitivity and specificity of screening proforma for teachers. A total of 124 students from phase I and all students in phase II were assessed in detail. Tests of intelligence (Malin's Intelligence Scale for Indian Children and Standard Progressive Matrices), and NIMHANS Index for specific learning disability (SLD) battery were administered.
Results:
A total of 38 students were found to be having specific developmental disorder of scholastic skills in phase I, that gave a prevalence of 1.58 per cent. Majority had mixed type of errors on SLD battery. There were more boys diagnosed with specific learning disability. Teacher's screening instrument had high sensitivity (90.385) and specificity (94.68).
Interpretation & conclusions:
The findings of our study conducted in community, showed that specific learning disability was not identified even till later age. The screening instrument thus could be used by teachers to suspect students with specific learning disability.
Keywords: NIMHANS Index, prevalence, screening tool, specific learning disability, students
Specific developmental disorder of scholastic skills (SDDSS), generally referred to as specific learning disability (SLD) is a developmental disorder of children. It affects up to 10 per cent school children according to a study conducted among US children1. In a review of Indian studies on prevalence of learning disability, prevalence of various types of deficits of scholastic skills was reported to be 3-10 per cent among students population2. In this review, studies had screened students for dyscalculia, dyslexia and different type of learning disabilities in the States of Karnataka, Kerala and Tamil Nadu. In another study from rural India, prevalence of specific learning disability was reported to be 13 per cent in primary school children3. In a study from northern region, one per cent of children attending an outpatient clinic of a tertiary hospital were found to be having specific learning disability4.
The issue of identification of specific learning disability cases in Indian context is perhaps more complex as classroom conditions that are far from ideal, socio-economic factors, bilingualism and multilingualism, limited proficiency in medium of instructions may play a significant role in Indian educational system5,6. The class sizes are big, and there is no screening tool available for teachers to identify SLD. The issue of assessment of SLD is further complicated by the fact that various Education Boards (Central and State Boards) have differing level of academic difficulty. The present study was planned to identify extent of specific learning disability cases in students of classes VII to XII in Chandigarh to evaluate predictive value of the screening tool, and to understand characteristic features in school students with specific learning disability.
Material & Methods
This cross-sectional study was carried out during April 2008 - May 2009 on school students of Chandigarh after approval of the research protocol from the ethics committee of the Government Medical College and Hospital, Chandigarh. The sample size was calculated based on reported prevalence of 10 per cent2, 95% confidence interval and relative error of 15 per cent, and it came out to be 1600. Considering a non-response rate of 20 per cent, the final sample size was calculated as 1920.
In Chandigarh there are 37 government and 30 private senior secondary schools. Of these, 10 schools were randomly selected for the study. All these schools were affiliated to Central Board of Secondary Education. In order to have representative sample, five government schools (N= 1301, 54.2%) and five private schools (N= 1101, 45.8%) were included. Approval of District Education Officer was taken, and then school principals were contacted. Written informed consent from parents of students was obtained. Students from classes VII to XII were chosen randomly so as to have approximately 250 students from each school. All schools had co-education except one school. The study was conducted in two phases.
Phase I: Socio-demographic details of selected students were noted. The teachers rated students on screening proforma developed by authors for the purpose of validation in the present study. The marks obtained by students in the previous class were taken from the school records. Inclusion criteria for assessment of dyslexia were (i) two affirmative responses on screening proforma given by teachers; (ii) IQ>80; (iii) students enrolled in school for at least six months; and (iv) students who were cooperative and whose parents consented for participation in study. Of the 2402 students, 159 students scored 2 or more on teacher screening proforma and were given tests for intelligence; 148 students had IQ above 80. Of these, 24 (16.2%) could not be tested as they had left the school, and addresses of 12 students were not traceable. The remaining 12 students were not cooperative for testing, of them four were pursuing education in a different school, three had failed in class VIII and left school, and five had left the school and were employed. Thus, 124 students were administered NIMHANS Index for specific learning disability7 in phase I.
NIMHANS Index for specific learning disability was administered by qualified psychologist. Students were assessed in the school setting itself; it took about 2-3 h to complete testing of one student. NIMHANS Index for specific learning disability is in English, which becomes unsuitable for students of those government schools where Hindi is the primary medium of instructions. For these children, Hindi text books, which were 1 and 2 grades below, were used to give tests for writing, spelling and sentence formation. Of the 2402 students in phase I, 574 were studying in Hindi medium schools.
Phase II: The second phase of study was carried out to determine the specificity and sensitivity of screening proforma used by the teachers to screen academic difficulties in students. In the second phase of study, 108 students were randomly selected from matched school and class. The inclusion of number of students from a particular class was dependent on the number of SLD positive students from that class and school. The class teachers were asked to screen them according to screening proforma used in phase I. Of the 108 matched samples, 28 students (25.9%) were found to be positive on teacher's screen. However, none had IQ less than 80 on tests of intelligence by using Malin's Intelligence Scale for Indian Children (MISIC)8, and Standard Progressive Matrices9. All the students were administered NIMHANS Index for specific learning disabilities7.
Students who could not be tested (N=24) in Phase I were found to be statistically comparable to those administered NIMHANS Index for SLD in Phase I (N=124) on socio-demographic variables and marks of English, Hindi, Mathematics and Science. However, the students who could not be administered NIMHANS Index for SLD performed poorly in social study (P<0.05).
Tools used: The following tools were used in the study:
(i) Socio-demographic proforma - Socio-demographic sheet to obtain information regarding age, gender, etc. was prepared.
(ii) Screening proforma - Six items were prepared for the class teacher. Since the class teacher spends considerable time with students, his/her perception about student's performance could be taken as the first index to screen the students in the school. Hence teachers’ perception was taken on unexplainable absence from school, below average academic performance, poor writing ability, problem in reading ability, poor mathematical competence, and problem in recall. The questions required a forced choice response and if the teacher identified problems on at least 2 questions, that particular case was taken up for further assessment. Students’ performance in the last class on the basis of marks obtained was also noted.
(iii) Malin's Intelligence Scale for Indian Children (MISIC)8 - An Indian version of Wechsler Intelligence Scale for Children (WISC) designed for children 5 to 15 yr, comprises verbal and performance tests. For the study, four verbal sub-tests viz. general information, comprehension, arithmetic, and digit span were used.
(iv) Standard Progressive Matrices (SPM)9 - It is widely used standardized test of intelligence with well established reliability and validity.
(v) NIMHANS Index for specific learning disabilities7 - The standardized battery with established norms was used. It consisted of attention test (number cancellation), language test (reading, writing, spelling and comprehension), arithmetic (addition, subtraction, multiplication, division and fractions), visuomotor skill (Bender Gestalt test) and auditory memory test. This battery has face and content validity. If the child's performance was 2 classes below what was expected for him/her, the diagnosis of specific developmental disorder of scholastic skills was made as per ICD-1010.
Statistical analysis was done using SPSS version 13 (SPSS Inc., USA). Descriptive and inferential statistics were applied. Comparisons were made using one way ANOVA and t-test. When quantitative data did not satisfy the parametric criteria, Kruskal Wallis and Mann Whitney- U test were applied.
Results
A total of 2402 students were taken from 10 schools in phase I. Students belonging to class VII were 393 (16.4%), class VIII were 467 (19.4%), class IX were 429 (17.9%), class X were 446 (18.6%), class XI were 352 (14%), and class XII were 315 (13.1%). Their age range was 12 to 19 yr, with their mean age being 15.44 ± 1.82 yr. There were 1371 (57.1%) male students, 59.8 per cent (n=1436) belonged to nuclear family and 632 (67.9%) were Hindu.
(i) Identification of SLD cases among school students: A total of 124 students were administered NIMHANS Index for SLD as per the predetermined criteria. Among them, 38 students (10 were from Hindi medium) were found to have SLD as the performance was found to be 2 grades below. Hence, the prevalence of SLD in the given sample was 1.58 per cent. Analysis of errors in SLD students showed that half had errors in more than one area of scholastic skills (50%), spelling errors were seen in 12 (31.6%) students, writing errors were seen in seven (18.4%) students. No cases of reading and arithmetic errors were seen.
(ii) Predictive value of screening tool: Sensitivity and specificity of the screening proforma were examined in phase II. Of the 108 students who were administered NIMHANS Index for SLD, 14 were positive. The positive predictive value was 26.70 and negative predictive value was 99.78. Diagnostic accuracy was 93 per cent. Sensitivity was found to be 90.38 and specificity 94.68.
(iii) Comparison between cases who were SLD positive, SLD negative but screen positive and controls.
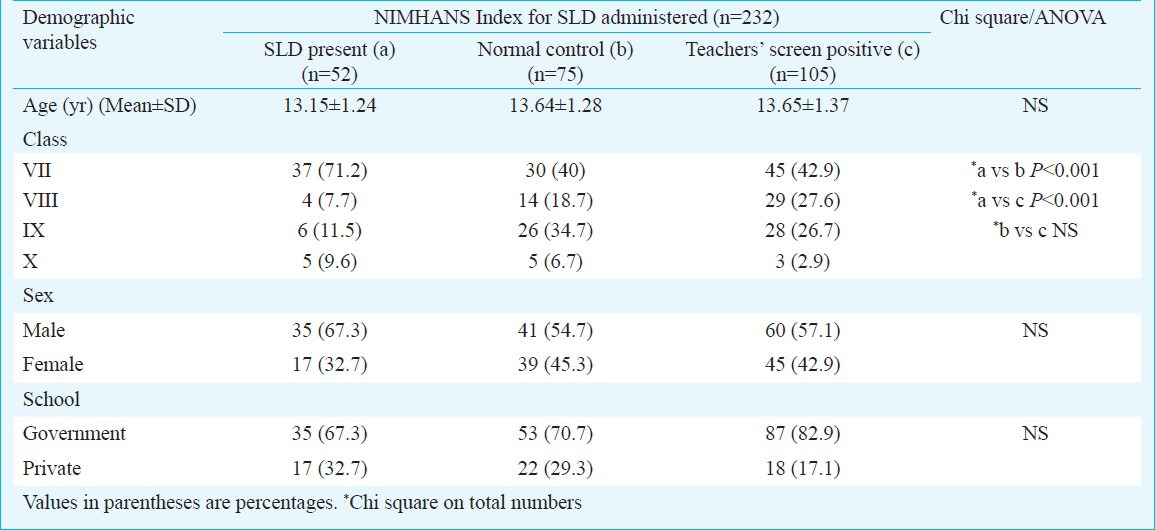
Demographic - The profile of students with SLD was examined in contrast to those who were identified by the teachers as having some problem (screen positive) but SLD was ruled out and also who were rated as having no problem (screen negative) by the teachers and were SLD negative (normal control). Thus, all the cases in whom NIMHANS Index for SLD was administered were divided in three groups and various features were compared. Table I showed that no differences emerged on age, gender and school. However, there were significantly (P<0.01, P<0.001) more cases in class VII in SLD group compared to screen positive group and controls.
Table I.
Comparison on demographic variables of students
Academic performance - Performance in the previous academic year in all the groups (Table II) was compared. Students who had SLD and who were screen positive scored significantly less than the normal controls.
Table II.
Comparison on academic performance of students

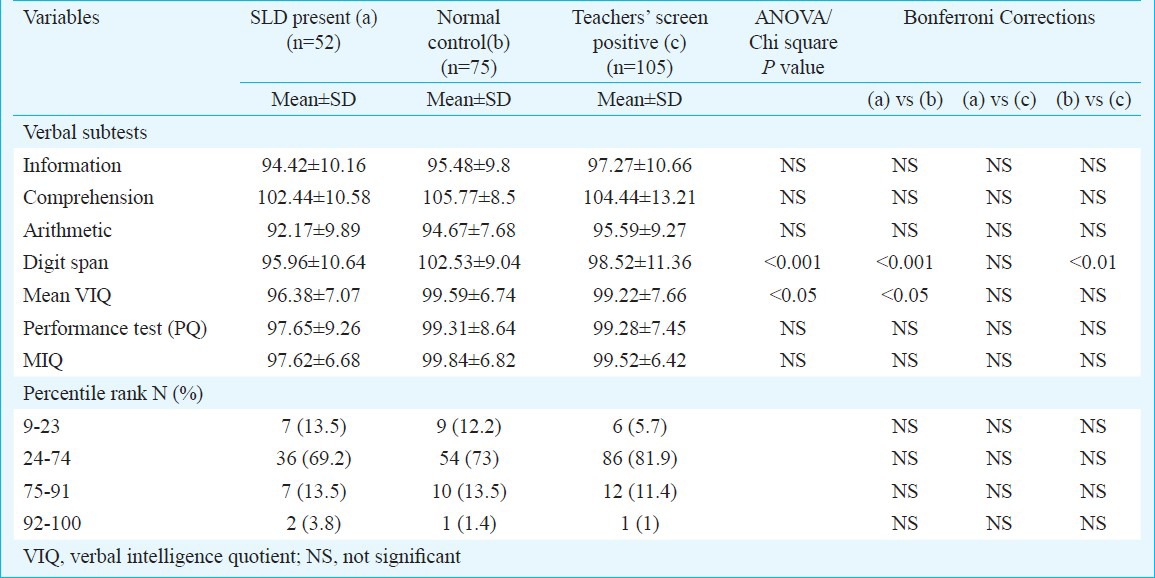
Intellectual functioning - On intellectual functioning (Table III), all students had average intelligence. The students with SLD showed significantly low scores on verbal intellectual functioning as compared to controls though no difference was observed in the three groups on performance test of intelligence. The scores on digit span were significantly (P<0.001) low in SLD group and screen positive group in comparison to controls. However, no significant differences were observed between verbal and performance scores on tests of intelligence within SLD group. An analysis of scatter profile in SLD group showed that 94.23 per cent of the students had scatter of more than 10 points across sub-tests of intelligence with scores on Arithmetic being lowest in 34.6 per cent of the cases and comprehension scores being maximum in 51.9 per cent of the cases (data not shown).
Table III.
Comparison on intellectual functioning of students
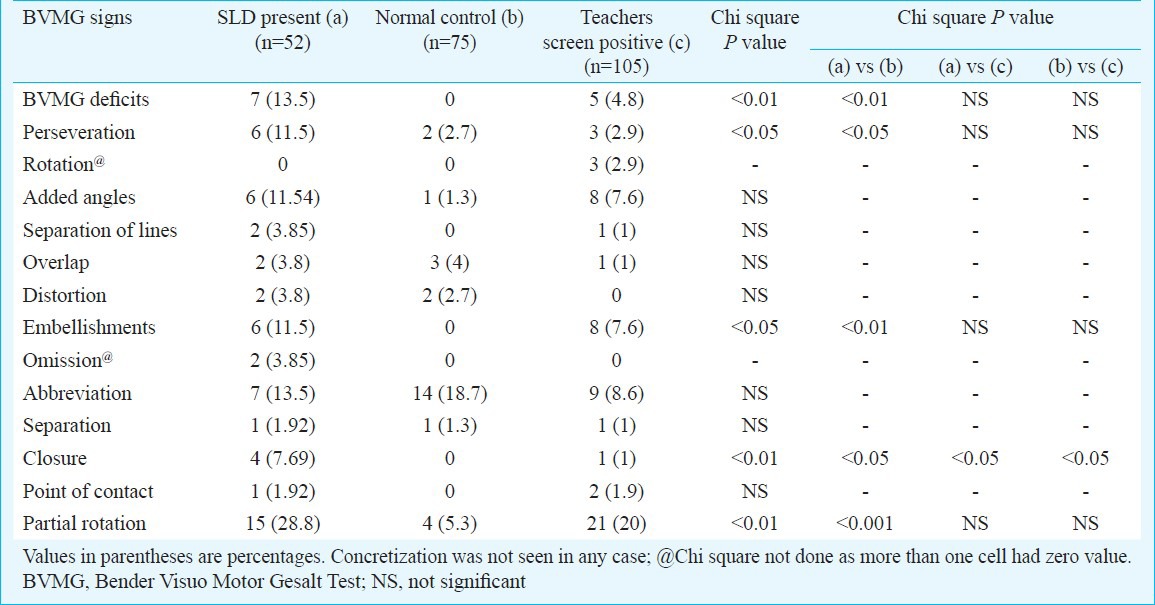
Perceptuo-motor deficits- Significant differences emerged on perceptuo-motor test between SLD group and control group (Table IV) on perseveration, embellishment, omission, partial rotation and closure. Closure was observed in teachers screen positive group also.
Table IV.
Comparison of performance on perceptuo-motor function
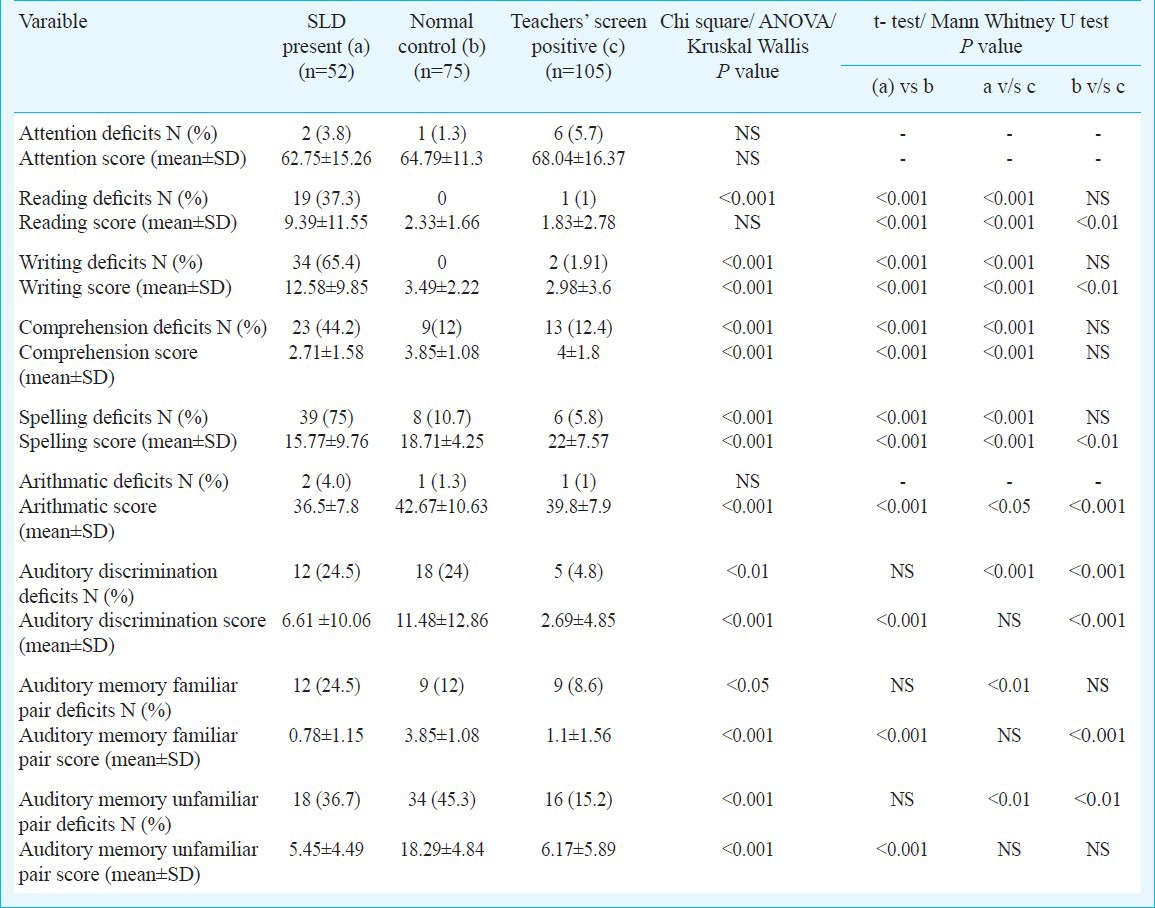
Errors seen on subtests of SLD Index- Reading deficits were significantly more (P<0.001) in students having SLD. Significant differences were due to punctuation, phonetic errors, spells words, and guessing words. Even the screen positive group had significantly (P<0.01) more errors due to punctuation, added words and omitted words (Table V). Writing deficits were significantly more in the SLD group. Type of writing errors that differentiated the SLD group from controls were lack of spacing and wrong capitals. Screen positive cases differed significantly (P<0.001) from normal on added letters and wrong capitals (Table VI). Students having SLD had significantly (P<0.001) more deficits on comprehension, spellings, arithmetic and memory for familiar as well as unfamiliar pairs and auditory discrimination (Table VII). Screen positive group also differed significantly (P<0.01) from SLD in these areas except on auditory discrimination.
Table V.
Comparison on reading errors (NIMHANS Index for SLD) in students
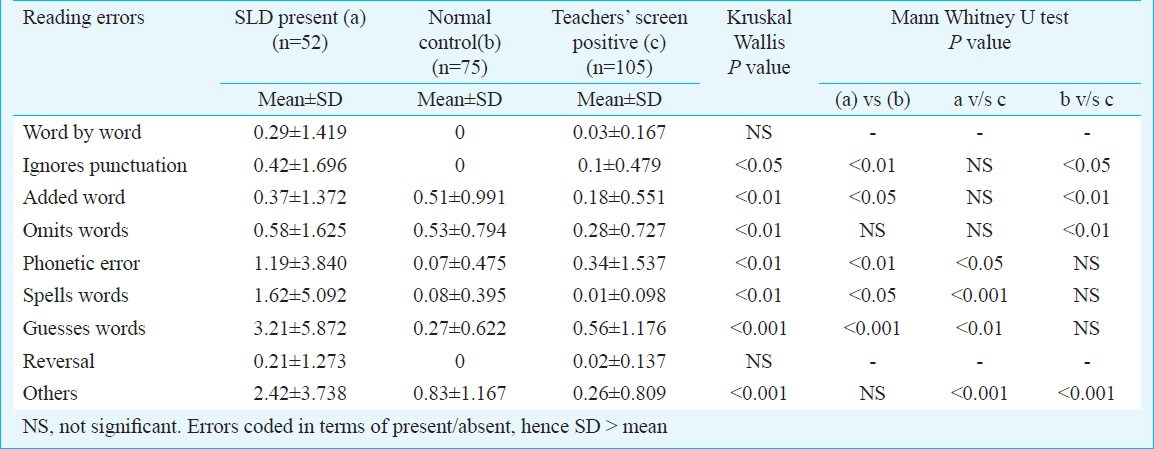
Table VI.
Comparison on writing errors (NIMHANS Index for SLD) of students
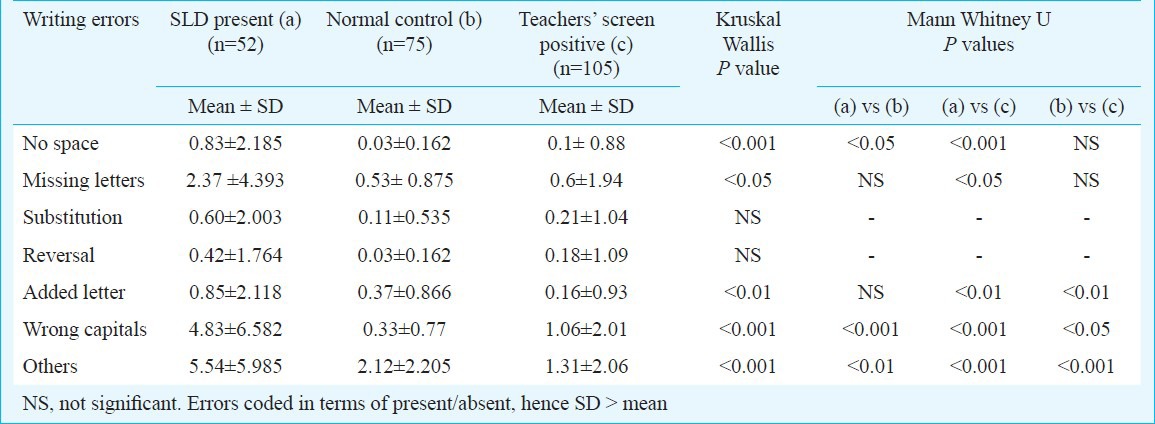
Table VII.
Comparison of performance on NIMHANS Index for specific learning disability (SLD)
Discussion
There is limited information on child mental health needs in our country. Community surveys are only a few and marked by methodological lacunae including small sample, unspecified clinical criteria for case ascertainment, etc11. Epidemiological studies are necessary to plan for optimum resource deployment and policy making. Limited attention has been given to assess the occurrence of specific learning disorder in India. There has been an increase in awareness among masses about learning disorder especially after release of a movie on this subject and has been much debated upon by professionals12 as well as by general public.
Estimates of the prevalence of learning disorders range from 2 to 10 per cent depending on the nature of ascertainment and the definitions applied13. In an earlier school-based epidemiological study from Chandigarh, SLD was assessed as part of evaluation of all psychiatric morbidity and no case was identified14. In the present school-based study, the point prevalence was found to be 1.58 per cent. In hospital based data only 1 per cent was found to be having SLD4. The reasons for variations in the rate may be due to difference in selection of tools, sample selection, and study setting. In the present sample, SLD was not identified in students of classes XI and XII.
Cases of SLD were identified significantly more in the younger children as evident in the analysis of class-wise distribution. This finding is understandable as coping with the complex concepts become significantly difficult with each passing year in the middle classes and is easily identified by parents leading them to seek professional guidance themselves. In families belonging to low and lower-middle class, children tend to drop out from school which is perceived as poor motivation to study by the parents rather than in terms of developmental disorder. This is reflective in our analysis of those cases that could not be tested. This suggests the possibility of higher prevalence than the current reported rate. However, this does not indicate poor reliability of the study as the non response rate was only 9.37 per cent. Further, boys were more as compared to girls (2:1) in SLD group as reported in the earlier studies15,16,17.
No case had only dyscalculia or only reading disorder. Most of them had more than one type of problems. As a result, SLD cases showed significantly poor academic performance in all the subjects (previous year marks) as compared to normal control group. Earlier studies have reported high correlation of writing skills with reading ability18. Many children with SLD find it difficult to identify and manipulate speech sounds, even when the task does not involve any written language19. It has been shown that deficits in phonological processing are the proximal cause of reading difficulties20.
Though the earlier study4 carried out in the same city has reported higher rates in reading, spelling and writing difficulties as compared to our study, but these differences could perhaps be due to differences in setting of the study and absence of control group. The earlier study4 was carried out in a clinic setting, where children having significantly severe academic difficulty would be reporting for evaluation, while the present study was carried out in community and the cases who were evaluated were also checked for prior treatment seeking behaviour. Analysis of the type of reading and writing error was done to examine if one could identify any specific errors in this group. The SLD group showed significantly more number of reading and writing errors. Significant reading errors included phonetic error, spellings, guessing, punctuation and added words. In fact, phonetic errors, guessing words and spelling words were significantly more than the screen positive group whereas punctuation, added words and omitting words were seen by teachers as academic problems though they were not common in children with SLD. In writing, the significant errors included omission of space, wrong capitals and added letters and these errors were significantly more in SLD group than in the screen positive group. Earlier literature has also reported similar errors besides reporting other errors like omission, mispronunciation, addition, phonetic overgeneralization21. Though a detailed developmental analysis of errors would give a genuine insight, yet it is possible that some of the errors are common to younger age group.
Comparison between the three groups on intellectual functioning profile showed that students with SLD had significantly lower scores on verbal tests of intelligence which was largely due to significantly low scores on digit span subtest. A majority of students with SLD had good logical reasoning and comprehensive ability with much of the problem lying with arithmetic skills and general information. Overall, this group had average range of intelligence. The current educational system at the middle level of schooling, as usually has been observed requires above average intellectual ability in order to be able to perform at a competitive level. Hence the teachers also had perceived problems in academics among these children. Though ADHD (attention-deficit/hyperactivity disorder) was not one of the exclusion criteria, the three groups including SLD group did not differ significantly on letter cancellation test used for attention problems in NIMHANS Index for SLD. The finding was surprising as ADHD as co-morbid disorder in SLD has been consistently reported worldwide with higher figures appearing in clinically referred samples22,23,24.
Previous studies show that subgroups of children with SLD may have difficulties with speed of processing information, short-term/working memory, and auditory processing than other children of the same age25. In the present study also, the students with SDDSS had significant poor auditory memory and auditory discrimination. On perceptuo-motor test, students with SLD showed mild deficits.
The teacher screening instrument had high sensitivity and specificity. Although the teachers could not predict SLD, yet the number of cases ruled out for SLD had high accuracy. This finding has important pragmatic implication in terms of teachers’ training. The screening tool used in this study included objective items that did not require oral examination or one-to-one interaction. At the same time, the items of the instrument though showed high reliability yet a more comprehensive screening instrument is required for diagnostic accuracy. Additionally, this screening tool was meant only to pick students with academic difficulty.
Fig.
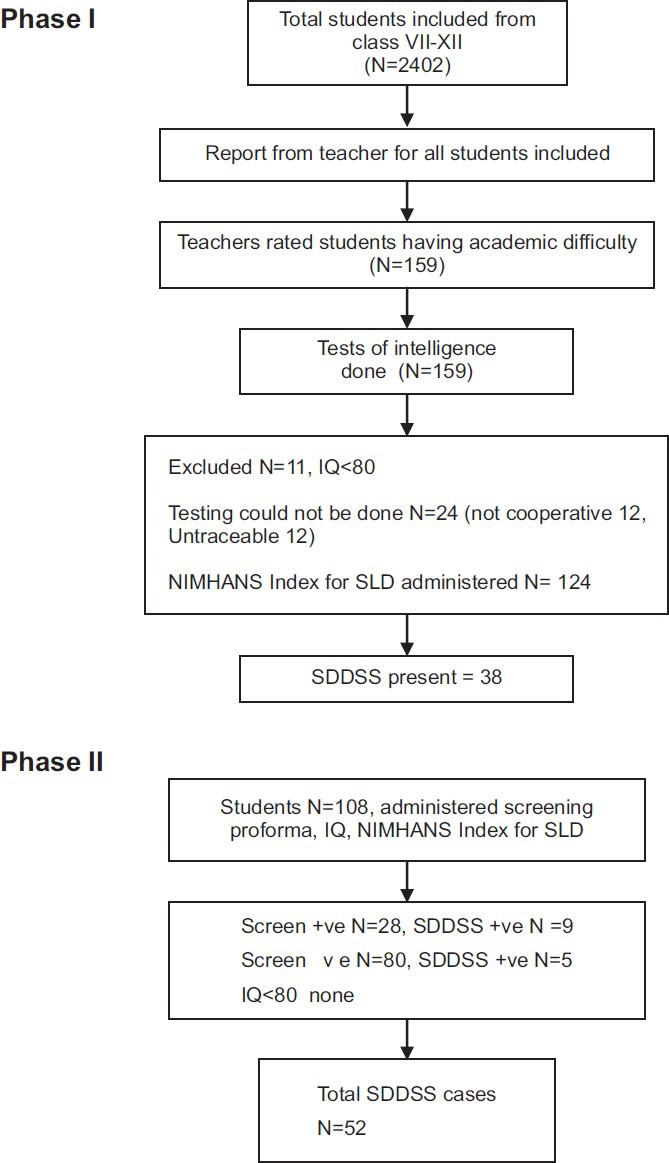
Flow diagram of the study design.
The diagnosis of SDDSS cannot be done by another way than clinical symptoms26. Hence, the importance of assessment technique cannot be negated. The importance of sharpening teachers’ observation skills, which would facilitate early and accurate identification of children's problems has been highlighted27. Studies elsewhere have also shown that it is possible for teachers to identify problems and that early identification is important28,29,30. In the present study, the teachers though perceived that these children had some problems, none of the children had been diagnosed as having SDDSS. Though this proforma cannot be used for diagnosing SDDSS, it could be an important tool for teachers to identify students having difficulty in academics. Since academic problems could be due to several reasons like low intellectual functioning, emotional problems, attention deficit, etc., further evaluation of various causes would be required. Majority of the Indian schools have 30-50 or even more children in one class section and it is difficult for the teachers to have close one-to-one interaction with students.
To summarize, a prevalence of 1.58 per cent of SDDSS in the age range of 12 to 18 yr old school students was found in the present study. Non-availability of standardized psychological tests in vernacular language perhaps limited the prevalence rate. Further studies with specific tests in Hindi and on younger children are required. NIMHANS SLD Index has been standardized on children studying in schools following State syllabus. Prevalence rate found in the present study was lower than expected; hence future epidemiological studies should include a larger sample size. Important lacuna of not interviewing parents needs to be acknowledged. Information from parents is crucial in studies pertaining to academic problems in view of the fact that many causes of scholastic backwardness require complete work up including social, emotional and physical factors.
References
- 1.Altarac M, Saroha E. Lifetime prevalence of learning disability among US children. Pediatrics. 2007;119(Suppl 1):S77–S83. doi: 10.1542/peds.2006-2089L. [DOI] [PubMed] [Google Scholar]
- 2.Ramaa S. Two decades of research on learning disabilities in India. Dyslexia. 2000;6:268–83. doi: 10.1002/1099-0909(200010/12)6:4<268::AID-DYS177>3.0.CO;2-A. [DOI] [PubMed] [Google Scholar]
- 3.Agarwal KN, Agarwal DK, Upadhyay SK, Singh M. Learning disability in rural primary school children. Indian J Med Res. 1991;94:89–95. [PubMed] [Google Scholar]
- 4.Kohli A, Malhotra S, Mohanty M, Khehra N, Kaur M. Specific learning disabilities in children: deficits and neuropsychological profile. Int J Rehabil Res. 2005;28:165–9. doi: 10.1097/00004356-200506000-00011. [DOI] [PubMed] [Google Scholar]
- 5.Karanth P. Introduction. In: Karanth P, Rozario J, editors. Learning disabilities in India: Willing the mind to learn. New Delhi: Sage Publications; 2003. pp. 17–29. [Google Scholar]
- 6.Snow CE, Burns MS, Griffin P. Washington, DC: US National Research Council Report; 2000. Preventing reading difficulties in young children. [Google Scholar]
- 7.Kapur M, John A, Rozario J, Oommen A. NIMHANS Index of specific learning disabilities 1991. In: Hirisave U, Oommen A, Kapur M, editors. Psychological assessment of children in the clinical setting. Bangalore: National Institute of Mental Health and Neuro Sciences; 2006. pp. 72–121. [Google Scholar]
- 8.Malin AJ. Lucknow: Indian Psychological Corporation; 1969. Manual for Malin's Intelligence Scale for Indian Children (MISIC) [Google Scholar]
- 9.Raven JC. London: HK Lewis; 1960. Guide to the standard progressive matrices. [Google Scholar]
- 10.World Health Organization (WHO) Geneva: WHO; 1992. The ICD-10 classification of mental and behavioural disorders: clinical descriptions and diagnostic guidelines. [Google Scholar]
- 11.Srinath S, Girimaji SC, Gururaj G, Seshadri S, Subbakrishna DK, Bhola P, et al. Epidemiological study of child & adolescent psychiatric disorders in urban & rural areas of Bangalore, India. Indian J Med Res. 2005;122:67–79. [PubMed] [Google Scholar]
- 12.Chakravarty A. Taare Zameen Par and dyslexic savants. Ann Indian Acad Neurol. 2009;12:99–103. doi: 10.4103/0972-2327.53077. [DOI] [PMC free article] [PubMed] [Google Scholar]
- 13.American Psychiatric Association (APA) 4th ed. Washington, DC: APA; 1994. Diagnostic and statistical manual of mental disorders. [Google Scholar]
- 14.Malhotra S, Kohli A, Arun P. Prevalence of psychiatric disorders in school children in Chandigarh, India. Indian J Med Res. 2002;116:21–8. [PubMed] [Google Scholar]
- 15.Rozario J. Ph.D dissertation. Bangalore: National Institute of Mental Health & Neuro Sciences; 1991. Impact intervention strategies for scholastic backwardness. [Google Scholar]
- 16.John A. Ph.D dissertation. Bangalore: National Institute of Mental Health & Neuro Sciences; 1989. A study of scholastic backwardness in a child guidance clinic. [Google Scholar]
- 17.Kohli A, Malhotra S, Khehra N, Mohanty M. Deficits and clinical profile of the children with specific learning disability. Indian J Clin Psychol. 2007;34:173–81. [Google Scholar]
- 18.Hammill DD, McNutt G. Austin, Texas: Pro-Ed; 1981. The correlates of reading: the consensus of thirty years of correlational research. [Google Scholar]
- 19.Snowling MJ. 2nd ed. Oxford, UK: Blackwell; 2000. Dyslexia. [Google Scholar]
- 20.Wagner RK, Torgesen JK. The nature of phonological processing and its causal role in the acquisition of reading skills. Psychol Bull. 1987;101:192–212. [Google Scholar]
- 21.Wallace G, Kauffman JM. Columbus, OH: Merill; 1986. Teaching students with learning and behavior problems. [Google Scholar]
- 22.Karande S, Satam N, Kulkarni M, Sholapurwala R, Chitre A, Shah N. Clinical and psychoeducational profile of children with specific learning disability and co-occurring attention-deficit hyperactivity disorder. Indian J Med Sci. 2007;61:639–47. [PubMed] [Google Scholar]
- 23.Shapiro BK, Gallico RP. Learning disabilities. Pediatr Clin North Am. 1993;40:491–505. doi: 10.1016/s0031-3955(16)38546-7. [DOI] [PubMed] [Google Scholar]
- 24.Shaywitz BA, Fletcher JM, Shaywitz SE. Defining and classifying learning disabilities and attention-deficit/hyperactivity disorder. J Child Neurol. 1995;10(Suppl 1):S50–7. doi: 10.1177/08830738950100S111. [DOI] [PubMed] [Google Scholar]
- 25.MacIntyre C, Deponio P. London: Routledge Falmer; 2003. Identifying and supporting children with specific learning difficulties: Looking beyond the label to assess the whole world. [Google Scholar]
- 26.Gabrieli JD. Dyslexia: a new synergy between education and cognitive neuroscience. Science. 2009;325:280–3. doi: 10.1126/science.1171999. [DOI] [PubMed] [Google Scholar]
- 27.Konantambigi RM, Shetty M. Teacher identification of learning problems comparisons with other measures. In: Thapa K, van der Aalsvroot GM, Pandey J, editors. Perspectives on learning disabilities in India: current practices and prospects. New Delhi: Sage Publications; 2008. pp. 181–99. [Google Scholar]
- 28.Hecht SA, Greenfield DB. Comparing the predictive validity of first grade teacher ratings and reading-related tests on third grade levels of reading skills in young children exposed to poverty. School Psych Rev. 2001;30:50–69. [Google Scholar]
- 29.Nitasha S, Sangwan S. Extent of learning disabilities and risk factors. Disabil Impair. 1999;13:105–10. [Google Scholar]
- 30.Al-Otaiba S. Children who do not respond to early literacy instruction: a longitudinal study across kindergarten and first grade. Read Res Q. 2001;36:344–9. [Google Scholar]


