

Abstract
Amino acid residues in the transmembrane domains of the CB1 receptor are important for ligand recognition and signal transduction. We used site-directed mutagenesis to identify the role of two novel and adjacent residues in the transmembrane helix II domain, Ile2.62 and Asp2.63. We investigated the role of the conserved, negatively charged aspartate at position 2.63 in cannabinoid receptor (CB1) function by substituting it with asparagine (D2.63N) and glutamate (D2.63E). In addition, the effect of the mutant I2.62T alone and in combination with D2.63N (double mutant) on the affinity and potency of structurally diverse ligands was investigated. Recombinant human CB1 receptors, stably expressed in human embryonic kidney 293 cells, were assayed for ligand affinity and agonist-stimulated guanosine 5′-3-O-(thio)triphosphate (GTPγS) binding. The charge-conserved mutant D2.63E behaved similar to wild type. The charge-neutralization mutation D2.63N attenuated the potency of (−)-3-[2-hydroxyl-4-(1,1-dimethylheptyl) phenyl]-4-[3-hydroxylpropyl] cyclohexan-1-ol (CP,55940), (R)-(−)-[2,3-dihydro-5-methyl-3-[(4-morpholinyl)methyl]pyrrolo[1,2,3-de]-1,4-benzoxazin-6-yl](1-naphthalenyl)methanone (WIN55212-2), (−)-11β-hydroxy-3-(1′,1′-dimethylheptyl) hexahydrocannabinol (AM4056), and (−)-11-hydroxyldimethylheptyl-Δ8-tetrahydrocannabinol (HU210) for the stimulation of GTPγS binding, without affecting their binding affinities. Likewise, the I2.62T mutant selectively altered agonist potency without altering agonist affinity. It was surprising to note that the double mutant (I2.62T-D2.63N) displayed a drastic and synergistic increase (by ~50-fold) in the EC50 for agonist-mediated activation. The profound loss of function in the I2.62T-D2.63N double mutant suggests that, although these residues are not obligatory for agonist recognition, they play a synergistic and crucial role in modulating signal transduction.
Cannabinoids act on cannabinoid receptors to elicit their central nervous system effects and peripheral effects. The cannabinoid receptors belong to the class A rhodopsin-like superfamily of G protein-coupled receptors (GPCRs) (Howlett et al., 2002). So far, two cannabinoid receptors, CB1 and CB2, have been isolated by molecular cloning (Matsuda et al., 1990; Munro et al., 1993). In a recent study, there has been some evidence that GPR55 may be a cannabinoid receptor, and that other additional non-CB1/CB2 receptors may exist (Johns et al., 2007; Ryberg et al., 2007). Mutational and computational studies indicate the existence of multiple ligand recognition sites at the CB1 receptor for structurally diverse cannabinoid ligands (Song and Bonner, 1996; McAllister et al., 2003; Fay et al., 2005; D’Antona et al., 2006b). These binding sites are predominantly contributed by distinct noncontiguous regions of the hydrophobic transmembrane helixes (TMHs).
Binding of an agonist to the plasma membrane-bound receptor triggers its association with G proteins, and, as a result, a cascade of intracellular signaling events is initiated. Despite our accumulating knowledge of the cannabinoid receptor, the protein structures that serve as a link between association of a ligand and G-protein interaction remain poorly understood. Previous studies with GPCRs have identified a highly conserved, negatively charged aspartate at position 2.50 (from TMH 2) to be crucial for ligand binding and/or receptor function (Tao and Abood, 1998; Xu et al., 1999; Wilson and Limbird, 2000). D2.50 (D163 in CB1 and D80 in CB2) was demonstrated to be important for G-protein coupling and signal transduction but not ligand binding (Tao and Abood, 1998; Roche et al., 1999; Nie and Lewis, 2001). In the μ-opioid receptor, D2.50 is also crucial for ligand binding and G-protein coupling (Xu et al., 1999). In addition, D2.50 (in TMH 2) was shown to interact with N7.39 (in TMH 7) to modulate receptor function possibly through an ionic interaction (Xu et al., 1999). Likewise, in the α2A-adrenergic receptor, D2.50 (D79) together with N422 have been shown to be crucial for maintaining the structural integrity of the receptor (Wilson and Limbird, 2000). Similar charged interactions between residues in the gonadotropin-releasing hormone receptor and 5HT2A receptor suggest that TMH 2 and TMH 7 are proximal to each other, and residues within these domains are important for receptor activation (Zhou et al., 1994; Sealfon et al., 1995).
I2.62 [in human CB1 (hCB1)] is present at a homologous position in the melanocortin-4 receptor (MC4R), a GPCR. The MC4R plays a role in modulating energy homeostasis and regulating appetite (Fan et al., 2005; Adan et al., 2006). Mutations or disruption in the signaling of the human MC4R has resulted in hyperphagia and severe childhood obesity (Farooqi et al., 2003; Adan et al., 2006). Mutants of the residue I2.62 in the MC4R can lead to intracellular retention and loss of function of the receptor (Lubrano-Berthelier et al., 2003; Tao and Segaloff, 2005). In particular, the mutated MC4R residue I102T (I2.62T) caused reduced ligand binding and signaling (Tao and Segaloff, 2005).
In the present study, we investigated the role of the negatively charged residue D2.63 (D176) in CB1 receptor function by replacing it with glutamate (D2.63E) or asparagine (D2.63N). D2.63 is unique; although it is highly conserved in all species of the CB1 receptor, an asparagine residue is present at an equivalent position in the CB2 receptor (Fig. 1A). The residues investigated in this study, I2.62 and D2.63, are located closer to the top of TMH 2 (located upstream to D2.50) toward the extracellular region, making them accessible to ligands (Fig. 1B). Our results suggest that although isoleucine and aspartate residues are not obligatory for ligand recognition in the CB1 receptor, these residues individually and synergistically play a major role in directly or allosterically modulating agonist-stimulated receptor activation. Furthermore, the presence of a negatively charged residue at position 2.63, rather than the residue aspartate per se, is important for modulating the signal transduction process.
Fig. 1.
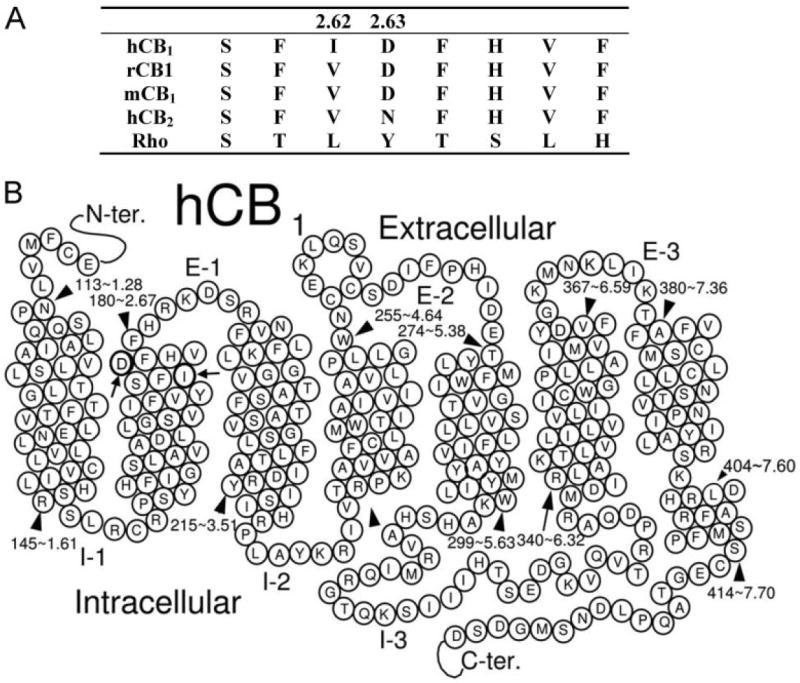
A, amino acid sequence alignment of residues from hCB1, rat CB1 (rCB1), mouse CB1 (mCB1), hCB2 receptor, and rhodopsin (Rho). The numbering shows the hCB1 receptor based on the scheme suggested by Ballesteros and Weinstein (1995). B, schematic representation of the hCB1 receptor structure and its seven transmembrane signaling regions. The residues D2.63 and I2.62 lie closer to the top of the TMH 2.
Materials and Methods
Materials
[3H]CP,55940 (160–180 Ci/mmol) and [35S]GTPγS (1250 Ci/mmol) were purchased from PerkinElmer (Boston, MA). WIN55212-2, CP,55940, and SR141716A were obtained from Tocris Cookson, Inc. (Ellisville, MO). HU210 was a generous gift from Dr. Raphael Mechoulam (Hebrew University, Jerusalem, Israel). AM4056 and AM281 were synthesized by the Makriyannis laboratory. Pfu Turbo DNA polymerase for mutagenesis experiments was obtained from Stratagene (La Jolla, CA). AquaSil siliconizing fluid was purchased from Pierce Chemical (Rockford, IL). Anti-cannabinoid receptor 1 rat polyclonal antibody raised toward the N-terminal of CB1 receptor was purchased from Sigma-Aldrich (St. Louis, MO). All other reagents were obtained from Sigma-Aldrich or other standard sources.
Amino Acid Numbering
The numbering scheme suggested by Ballesteros and Weinstein (1995) was used in this study. In this system, the most highly conserved residue in each TMH is assigned a locant of 0.50. This number is preceded by the TMH number and followed in parentheses by the sequence number. All other residues in a TMH are numbered relative to this residue.
Mutagenesis and Cell Culture
The D2.63N, D2.63E, I2.62T, and I2.62T-D2.63N mutants of the hCB1 in the pcDNA3 vector were constructed using the QuikChange site-directed mutagenesis kit (Stratagene). The mutagenic oligonucleotides used were 27 to 33- base pairs long. Restriction endonuclease digestion and DNA sequencing subsequently confirmed the presence of the mutation. Stably transfected human embryonic kidney (HEK) 293 cell lines were created by transfection with wild-type (WT) or mutant CB1-pcDNA3 cDNA by the Lipofectamine reagent (Invitrogen, Carlsbad, CA) and selected in growth medium containing G-418 (Geneticin; 1 mg/ml) as described previously (McAllister et al., 2003).
Immunocytochemistry
HEK 293 cells expressing WT and mutant hCB1 were plated onto coverslips that were pretreated with poly-d-lysine (0.02 mg/ml; Sigma-Aldrich) for 1 h. Cells were maintained at 37°C in a 5% CO2 atmosphere until they were ready for labeling. Cells were washed once with Hanks’ balanced salt solution (HBSS) (Cellgro; Mediatech, Inc., Manassas, VA) composed of the following: 0.14 g/l CaCl2, 0.4 g/l KCl, 0.06 g/l KH2PO4, 0.097 g/l MgSO4, 8 g/l NaCl, 0.047 g/l Na2HPO4, 0.35 g/l NaHCO3, and 1.0 g/l d-glucose. Next, cells were fixed with 4% paraformaldehyde for 20 min at room temperature. Subsequently, cells were washed two times with HBSS. Cells were then incubated for 30 min with blocking buffer [3% bovine serum albumin (BSA) solution] to reduce background staining and then incubated overnight at 4°C with a polyclonal rat anti-CB1 receptor antibody (Sigma-Aldrich) according to the manufacturer’s specifications. The treated cells were washed three times with HBSS and labeled for 1 h with Alexa Fluor 488 secondary antibody (Invitrogen, Carlsbad, CA), followed by three additional washes with HBSS. Coverslips were mounted onto slides in Fluoromount-G solution (Electron Microscopy Sciences, Hatfield, PA), and cell surface labeling was visualized with a fluorescence microscope (Nikon, Melville, NY) at 60× magnification.
Radioligand Binding and GTPγS Binding Assay
Protein membrane preparations harvested from transfected HEK 293 cells were prepared and assayed as described previously (Kapur et al., 2007). In brief, binding assays (saturation and competition binding assays) were initiated by the addition of 50 μg of membrane protein to siliconized glass tubes (to reduce nonspecific binding) containing [3H]CP,55940 and an appropriate volume of binding buffer A (50 mM Tris base, 1 mM EDTA, 3 mM MgCl2, and 5 mg/ml BSA, pH 7.4) to bring the final volume to 500 μl. Nonspecific binding was determined in the presence of excess (1 μM), unlabeled CP,55940. Reactants were allowed to reach equilibrium (~1 h). Subsequently, free and bound radioligands were separated by vacuum filtration through Whatman GF-C filters (Whatman Inc., Florham Park, NJ), and the radioactivity retained on the filters was quantified by a liquid scintillation counter (Beckman LS6500; Beckman Coulter, Fullerton, CA).
The radioactive counts (disintegration per minute) observed for specific binding were normalized as percentage-specific binding. For displacement assays, specific binding (in the presence of increasing concentration of the displacing ligand) was normalized to the percentage-specific binding observed in absence of the displacing ligand to generate a competition binding curve. The counting efficiency of the Beckman LS6500 liquid scintillation counter (Beckman Coulter) calibrated using [3H] and [35S] standards was 51 and 49%, respectively.
The Kd and Bmax values were determined by analyzing the saturation binding data by nonlinear regression and fitting to a one-site binding model using GraphPad Prism 4.0 software (GraphPad Software, Inc., San Diego, CA). The displacement log IC50 values were determined by nonlinear regression, and data were fitted to one-site competition and then converted to Ki values using the Cheng and Prusoff (1973) method and analyzed with the use of GraphPad Prism (GraphPad Software, Inc.).
The GTPγS assay was initiated by the addition of 20 μg of membrane protein into silanized glass tubes containing 0.1 nM [35S]GTPγS and 10 μM GDP in GTPγS binding buffer (50 mM Tris HCl, 100 mM NaCl, 3 mM MgCl2, 0.2 mM EGTA, and 0.1% BSA, pH 7.4). Nonspecific binding was assessed in the presence of 20 μM unlabeled GTPγS. Free and bound radioligands were separated, and bound radioactivity was quantified as described above. The specific basal counts (in the absence of an agonist) estimated were an indication of the constitutive activity of the receptor. The specific [35S]GTPγS binding generated in response to agonist treatment was normalized as a percentage of stimulation (over basal activity). Nonlinear regression of log concentration values versus a percentage of effect, fitted to the sigmoidal dose response, was used to obtain estimates of agonist concentrations that elicit the EC50 and Emax.
Statistical Analyses
Data are reported as the mean value of the replicates along with their 95% confidence limits. The Ki and log EC50 values in the mutant and wild-type CB1 receptors were compared using the two-tailed Student’s t test to determine the level of significance. P values of <0.05 were considered statistically significant.
Results
Radioligand Binding Assay
The binding of [3H]-CP,55940 to WT and mutant hCB1 receptors stably expressed in HEK 293 cells was measured to generate an estimate of the Kd and Bmax values. Similar cell surface receptor expression of WT or mutant cell lines was verified by immunofluorescence staining with a rat polyclonal anti-CB1 antibody (Fig. 2).
Fig. 2.
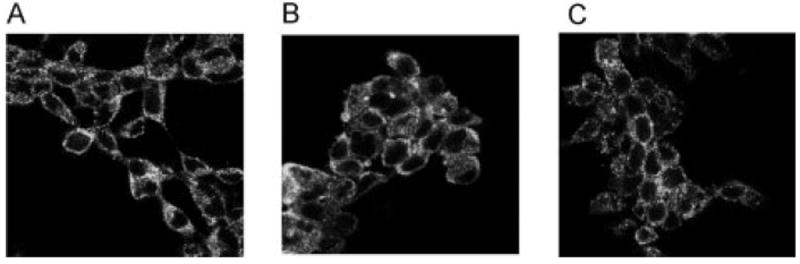
Immunofluorescence staining of fixed HEK 293 cells stably expressing WT (A), D2.63N (B), and I2.62T-D2.63N (C) hCB1 receptors. No specific immunostaining was observed in untransfected HEK 293 cells labeled with anti-CB1 antibody. Magnification, 60×.
Saturation binding analysis for [3H]CP,55940 at the D2.63N mutant receptor displayed a Kd of 3.2 nM that was comparable to the WT hCB1 receptor (Kd, 2 nM) (Table 1). In contrast, the D2.63N Bmax value of 1.8 pmol/mg was significantly higher than the WT hCB1 Bmax (1 pmol/mg). The Kd value of [3H]CP,55940 on the D2.63E mutant (3.8 nM) was not significantly different from that of the WT receptor. The Bmax for the D2.63E mutant (0.53 pmol/mg) was slightly reduced (<2-fold), but it was not significantly different from the WT hCB1. The Kd and Bmax values of I2.62T (0.8 nM, 1.2 pmol/mg) and double mutant I2.62T-D2.63N (3.2 nM, 1 pmol/mg) were also not significantly different from WT hCB1.
TABLE 1.
Radioligand binding properties of wild-type and mutant cell lines
The Kd and Bmax values were determined from saturation binding experiments using [3H]CP,55940 on HEK 293 cell membrane preparations stably transfected with the wild-type or mutant hCB1 receptor. Data represent the mean and corresponding 95% confidence limits of at least three independent experiments performed in triplicate. No significant difference was observed between the wild-type and mutant binding properties as determined by a two-tailed Student’s t test, with the exception that the Bmax value of the D2.63N mutant was significantly higher than the WT hCB1.
| Cell Line | Kd | Bmax |
|---|---|---|
|
| ||
| nM | pmol/mg | |
| WT | 2.0 (0.7–3.2) | 1.03 (0.8–1.3) |
| D2.63N | 3.2 (2.0–4.5) | 1.8 (1.5–2.2)* |
| D2.63E | 3.8 (1–10) | 0.53 (0.2–0.9) |
| I2.62T | 0.8 (0.6–1.0) | 1.22 (1.1–1.3) |
| I2.62T -D2.63N | 3.2 (0.9–5.6) | 1.0 (0.6–1.4) |
P < 0.05.
Agonist Displacement Assay
The binding affinities (Ki) of structurally diverse cannabinoid ligands (Fig. 3) for WT, D2.63N, I2.62T, and double mutant I2.62T-D2.63N hCB1 were examined in competition binding assays. The ability of WIN55212-2 (an aminoalkylindole agonist), CP,55940 (a nonclassic agonist), and AM4056 and HU210 (classic cannabinoid agonists) to displace the reporter ligand [3H]CP,55940 bound to the hCB1 receptor was used to calculate the Ki value as described under Materials and Methods. Table 2 summarizes the displacement of [3H]CP,55940 by cannabinoid ligands from WT and mutant receptors. WIN55212-2, CP,55940, HU210, and AM4056 displayed Ki values of 16, 1.4, 0.4, and 0.2 nM, respectively, on the WT receptor. These inhibitory constant values were comparable (<2-fold) to and not statistically different from the D2.63N, I2.62T, and I2.62T-D2.63N mutant hCB1. Displacement assays were not performed with the D2.63E mutant because it behaved similar to WT hCB1 in saturation binding assays (see above) and GTPγS functional assays (see below).
Fig. 3.
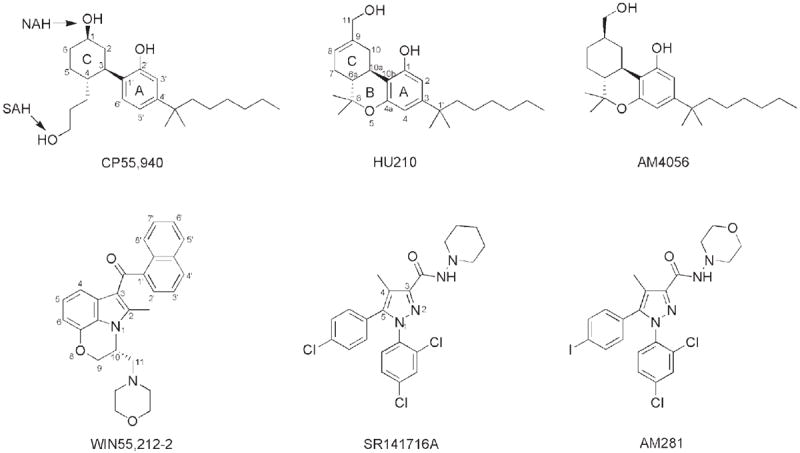
Compounds evaluated in this study.
TABLE 2.
The effects of amino acid mutations of recombinant hCB1 receptors on the displacement of [3H]CP,55940 by cannabinoid receptor ligands
Data represent the mean and corresponding 95% confidence limits of at least three independent experiments performed in triplicate. The Ki value of the inverse agonist SR141716A on the mutant receptors was significantly different from wild-type CB1 receptors using a two-tailed Student’s t test. No significant difference was found in the agonist Ki values. Displacement assays with the D2.63E mutant were not performed.
| [3H]CP,55940 | WIN55212-2 | CP,55940 | HU210 | AM4056 | SR141716A |
|---|---|---|---|---|---|
| WT | 15.9 (9–28) | 1.4 (0.8–2.4) | 0.41 (0.2–0.7) | 0.21 (0.07–0.6) | 3.3 (2.1–5.3) |
| D2.63N | 7.2 (3.3–16) | 2.0 (0.9–4.3) | 0.25 (0.1–0.5) | 0.22 (0.1–0.5) | 17.6* (8–38) |
| I2.62T | 10.8 (2.2–52) | 1.0 (0.5–2) | 0.40 (0.15–1.0) | 0.20 (0.09–0.5) | 8.8* (5.0–15) |
| I2.62T-D2.63N | 12.8 (5.0–32) | 2.1 (0.2–29) | 0.79 (0.37–1.7) | 0.16 (0.03–8) | 22.7* (10–50) |
P < 0.05.
We also tested HU-308, a selective CB2 agonist, on the I2.62T-D2.63N hCB1 and WT hCB2 receptor (data not shown). HU-308 displayed a Ki of 6.5 nM in WT hCB2 cells, whereas no detectable binding was observed in the mutant.
Antagonist Displacement Assay
Next, we investigated the binding affinities (Ki) of the biarylpyrazole inverse agonist/antagonist SR141716A and AM281 (a structural analog of SR141716A) to displace the reporter ligand [3H]CP,55940 bound to the hCB1 receptor. In contrast to the unaltered agonist affinity reported above, the affinity of SR141716A and AM281 was reduced on the mutant receptors. The Ki value of SR141716A was significantly increased from ~3 nM on WT receptor to ~18, 9, and 23 nM on the D2.63N, I2.62T, and I2.62T-D2.63N mutant hCB1, respectively (Table 2; Fig. 4A). Likewise, the Ki value of the inverse agonist AM281 was also altered from 21 nM on WT hCB1 to 78, 21, and 292 nM on the D2.63N, I2.62T, and I2.62T-D2.63N mutant hCB1, respectively (Fig. 4B).
Fig. 4.
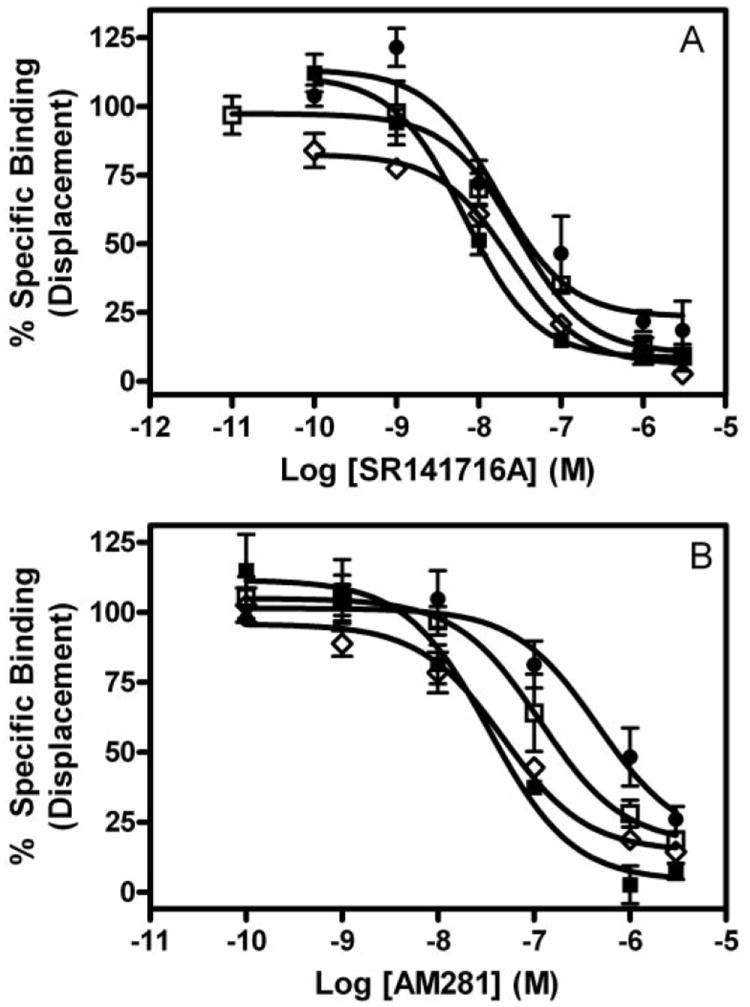
Competitive displacement of [3H]CP,55940. The inverse agonists SR141716A (A) and AM281 (B) were used for displacing bound [3H]CP,55940 in membranes prepared from HEK 293 cells stably transfected with wild-type (■), D2.63N (□), I2.62T (◇), or I2.62T-D2.63N (●) hCB1 receptors. Each data point represents the mean ± S.E.M. of at least three independent experiments performed in triplicate.
Agonist-Stimulated GTPγS Binding
The ability of structurally diverse agonists to induce stimulation of binding of [35S]GTPγS was used to measure activation of WT and mutant hCB1 receptors (Fig. 5). The WT hCB1 receptor generated EC50 values for WIN55212-2-, CP,55940-, AM4056-, and HU210-induced receptor activation of 5.5, 1.2, 0.027, and 0.07 nM, respectively (Table 3; Fig. 5). The charge-conserved substitution of D2.63 with glutamate (D2.63E) did not significantly affect the potency of the agonist being investigated. However, a reduction in the agonist-induced Emax was observed at this mutant compared to the WT receptor (data not shown). The lower Emax value observed for the D2.63E mutant can be attributed to reduced levels of receptor expression (Table 1).
Fig. 5.
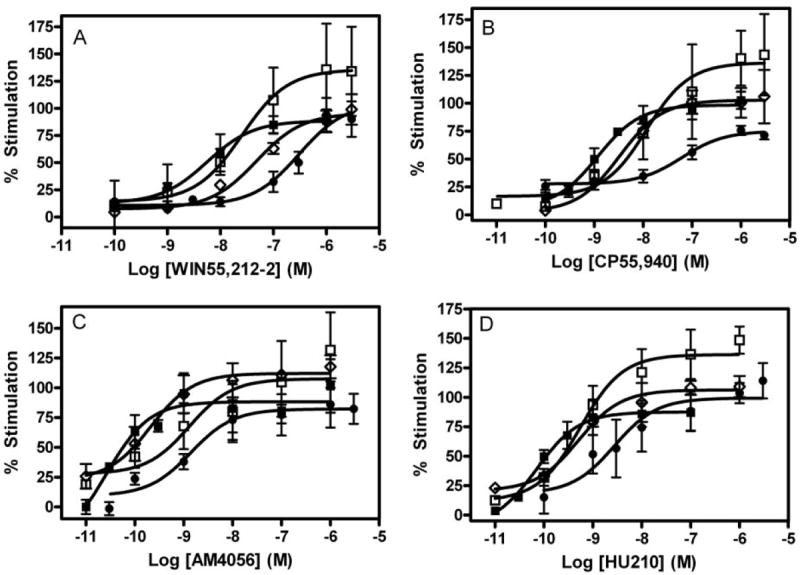
Activation of wild-type and mutant receptors. WIN55212-2 (A), CP,55940 (B), AM4056 (C), and HU210 (D). Concentration-effect curves obtained from [35S]GTPγS binding in HEK membrane preparations expressing wild-type (■), D2.63N (□), I2.62T (◇), or I2.62T-D2.63N (●) hCB1 receptors. Each data point represents the mean ± S.E.M. of at least three independent experiments performed in triplicate.
TABLE 3.
Concentration-effect data for agonist stimulation of [35S]GTPγS binding of wild-type and mutant receptors stably expressed in HEK 293 cells
Data represent the mean of at least three independent experiments performed in triplicate. EC50 values were determined from concentration-effect curves using GraphPad Prism software (GraphPad Software, Inc.). The values in parentheses are the 95% CIs. Statistical analysis was performed by comparing the log EC50 of the mutant receptor to the wild-type CB1 receptors using a two-tailed Student’s t test to determine the level of significance.
| Agonist | Cell Line | EC50 (CI) | Mutant/WT EC50 |
|---|---|---|---|
| WIN55212-2 | WT | 5.5 nM (1–30) | 1 |
| D2.63E | 18.1 nM (4.1–80) | 3.3 | |
| D2.63N | 37.2 nM (4–350) | 7 | |
| I2.62T | 48.1 nM (19–119) | 9 | |
| I2.62T-D2.63N | 308.5 nM (104–910)* | 56 | |
| CP,55940 | WT | 1.18 nM (0.6–2.5) | 1 |
| D2.63E | 1.5 nM (0.3–7) | 1.3 | |
| D2.63N | 15.3 nM (2–120)* | 13 | |
| I2.62T | 3.3 nM (1.2–9) | 2.8 | |
| I2.62T-D2.63N | 64.5 nM (20.4–204)* | 55 | |
| AM4056 | WT | 26.8 pM (4–170) | 1 |
| D2.63E | 24.2 pM (3.4–171) | 0.9 | |
| D2.63N | 1.2 nM (0.1–16)* | 44 | |
| I2.62T | 211 pM (46–970) | 8 | |
| I2.62T-D2.63N | 1.7 nM (0.3–10)* | 63 | |
| HU210 | WT | 70.2 pM (22.4–220) | 1 |
| D2.63E | 184 pM (36–925) | 2.6 | |
| D2.63N | 822 pM (160–2000)* | 12 | |
| I2.62T | 510 pM (190–1300) | 7.3 | |
| I2.62T-D2.63N | 2.8 nM (0.4–17)* | 40 |
P < 0.05.
In contrast, the charge-neutralization mutation D2.63N resulted in an increase of the EC50 value for WIN55212-2, CP,55940, AM4056, and HU210 to ~37 (7-fold), 15 (13-fold), 1.2 (44-fold), and 0.8 nM (12-fold), respectively, representing a drastic reduction in agonist sensitivity (Table 3; Fig. 5). Thus, whereas binding affinities were not altered, reductions in agonist potency were significant. Likewise, at the I2.62T mutant, the potency of WIN55212-2-, CP,55940-, AM4056-, and HU210-induced receptor activation were reduced to 48 (9-fold), 3.3 (3-fold), 0.2 (8-fold), and 0.5 nM (7-fold), respectively.
The double-mutant I2.62T-D2.63N resulted in a profound increase of the EC50 value for WIN55212-2-, CP,55940-, AM4056-, and HU210-induced receptor activation to ~309 (56-fold), 65 (55-fold), 1.7 (63-fold), and 2.8 nM (40-fold), respectively. This dramatic rightward shift in agonist potencies on the double mutant represented an apparent synergistic effect of the I2.62 and D2.63N residues in modulating the receptor signal transduction mechanism.
The intrinsic basal (constitutive) value (disintegrations per minute) observed in the WT hCB1 was 1024 (909–1138), and it was comparable to and not statistically different from the basal counts of 1044 (788–1300), 862 (626–1098), and 1380 (1056–1700) estimated for D2.63N, I2.62T, and I2.62TD2.63N mutant hCB1, respectively (Fig. 6), suggesting that the mutations had not altered the resting to active state equilibrium of the receptor. In addition, the EC50 value for the inverse agonist SR141716A in the double mutant I2.62TD2.63N of 3.2 nM was comparable to the WT hCB1 (4.2 nM). The efficacy of SR141716A for maximal inhibition of the basal activity was comparable in the WT and I2.62T-D2.63N mutant hCB1 receptor. The inverse agonism of SR141716A on GTPγS binding at the single mutants I2.62T and D2.63N was not tested.
Fig. 6.
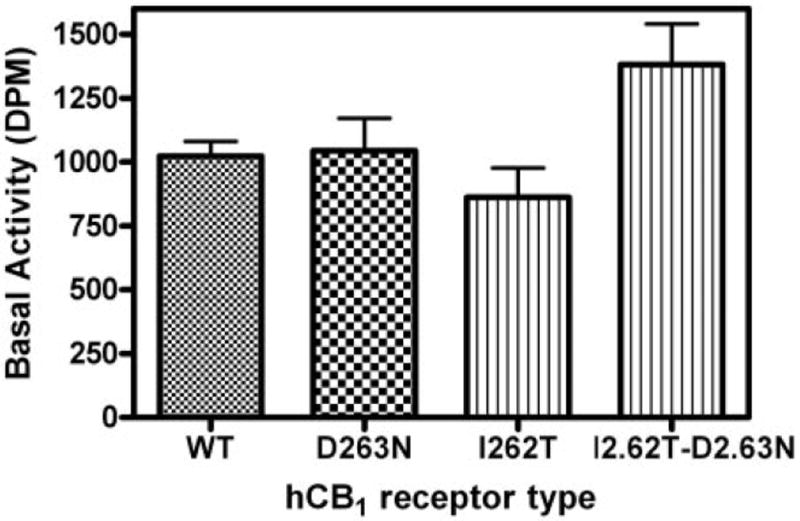
Basal activity of wild-type and mutant hCB1 receptors. The specific basal activity estimated as disintegrations per minute (DPM) in the absence of agonist obtained from [35S]GTPγS binding in HEK 293 membrane preparations expressing wild-type, D2.63N, I2.62T, or I2.62T-D2.63N hCB1 receptors. Each data point represents the mean ± S.E.M. of at least 10 independent experiments performed in triplicate. No significant difference was found in the basal values of the WT and mutant receptor, as determined by one-way analysis of variance followed by Dunnett’s multiple comparison test.
Discussion
Although neither CB1 nor CB2 proteins has been crystallized, much of the structural information on these proteins has been gained from biochemical, mutational, and modeling studies. Despite our accumulating knowledge of receptor structure, the chain of events triggered by binding of ligands to the CB1 receptor remain poorly characterized. In the present study, we demonstrate that two previously uncharacterized residues, isoleucine and aspartate, at positions 2.62 and 2.63, respectively, in the second transmembrane domain of the CB1 receptor are crucial for signal transduction, but they do not participate in high-affinity agonist binding.
Although residues from the TMH 2 of the CB1 and CB2 receptor are predominantly conserved, the aspartate residue at position 2.63 in the CB1 receptor has an asparagine at the equivalent position in the CB2 receptor. The lack of effect of the CB2 receptor-selective agonist HU-308 in the mutant hCB1 receptors suggests that this divergent residue is not responsible for the differential interaction of ligands in CB1 and CB2 receptors.
The present study demonstrates that mutation of I2.62 and D2.63 does not cause any major global alteration in structure and/or assembly of the receptor because no detrimental effect on high-affinity CB1 agonist binding and receptor expression was observed. One notable exception was a modest reduction (<2-fold) in receptor expression (Bmax) on the D2.63E mutant. However, the overlapping confidence intervals (CI) of the WT and D2.63E Bmax values suggest that the difference is not significant. In contrast, the fact that the D2.63N mutant had a significantly higher receptor expression than the WT might explain the higher Emax observed with this mutant in the GTPγS functional assay. The higher Emax value observed on the D2.63N mutant might also be a consequence of relatively greater agonist-mediated GDP displacement from the heterotrimeric G protein (Breivogel et al., 1998).
The charge-neutralization mutation D2.63N conferred a drastic reduction in the agonist-stimulated GTPγS binding for a series of structurally diverse agonists. Although the EC50 value of WIN55212-2 for the D2.63N mutant was not significantly different from the WT hCB1 receptor, it nevertheless represented a modest 7-fold reduction in agonist potency. In contrast, CP,55940, HU210, and AM4056 displayed a rightward shift in their concentration-response curves on D2.63N, representing a significant increase in their EC50 values (13-, 12-, and 44-fold, respectively). At the I2.62T mutant receptor, a trend toward reduction in agonist potency was observed.
The most significant finding of the study was the dramatic and significant increase in the EC50 values for all of the agonist-induced receptor activation (40–60-fold) resulting from the double-mutation I2.62T-D2.63N. Furthermore, this reduction in agonist potency on the double mutant was greater than the additive effect of each of the single mutants (I2.62T and D2.63N), suggesting a synergetic action of these two residues in the activation mechanism of the receptor. The present results point to the role of I2.62 and D2.63 in the transduction mechanism of the receptor rather than a direct ligand binding site. This is a deviation from the widely accepted paradigm that ligand association with the receptor and receptor activation are intrinsically coupled processes. It is no surprise that the conservative substitution D2.63E had no significant effect on the concentration dependence of agonist-induced receptor activation. These results suggest that the presence of a negatively charged residue at this position is crucial for the signal transduction/G protein-coupling mechanism. It is possible that I2.62 and D2.63 allosterically alter the conformational changes that are associated with receptor activation (Price et al., 2005).
Another interesting observation in this study was the alteration in binding affinity (Ki value) of the inverse agonists SR141716A and AM281 on the mutant receptor, with the double-mutant I2.62T-D2.63N displaying the greatest increase in Ki value. These results, taken together with the unaltered high-affinity agonist binding, and no observable difference in the constitutive activity of the mutants are less easily explained. Inverse agonists are shown to have a higher affinity for the resting state of the receptor, and mutations that alter the equilibrium between the restingactive state of the receptor consequently affect the basal activity and affinity of the inverse agonist (McAllister et al., 2004; D’Antona et al., 2006a). However, mutations in the α1B-adrenergic receptor that result in a constitutively active receptor did not necessarily show a significant attenuation in the affinity of antagonist/inverse agonist (Kjelsberg et al., 1992). Studies unequivocally demonstrating that inverse agonists have a lower affinity for the active state of the GPCR are lacking (Wade et al., 2001). The simplest prediction in our study is that other key features (e.g., structural movement associated with the conformational change of receptors and/or G-protein coupling) are altered to produce receptor activation. As discussed under Results, we suggest that the mutation of these residues has not altered the basal constitutive activity of the receptor, but it has a modest effect on the binding of inverse agonist. In addition, the unaltered potency and efficacy of SR141716A on the double mutant I2.62TD2.63N compared to the WT hCB1 suggest that the mutations did not change the constitutive activity and/or resting-active equilibrium of the mutant receptors. However, GTPγS binding data with SR141716A must be interpreted with a caveat because the observed effects are smaller (than an agonist). This may preclude reliable correlation among different mutants especially when the basal activities are comparable.
Naturally occurring variants of I102 in the MC4R (homologous to I2.62 in hCB1) result in loss of function of the receptor (Tao and Segaloff, 2005). Furthermore, the MC4R has been shown to modulate energy metabolism and appetite regulation (Farooqi et al., 2003; Fan et al., 2005; Tao, 2005; Adan et al., 2006). Stimulation of MC4R activates the adenylyl cyclase pathway, and the interference of its signaling pathway has been associated with hyperphagia, hyperglycemia, and obesity (Huszar et al., 1997). Because the endocannabinoid system is being exploited for its ability to control appetite (Després, 2007), extrapolating findings from the MC4R to the CB1 receptor can provide valuable insight into the role of domain(s) in the CB1 protein that modulate similar effects. Although our results do not indicate a direct role of the I2.62 residue in modulating CB1 receptor function, I2.62 in combination with D2.63N produced a synergistic effect on activity.
Mutation of D2.63 in the CXCR4 chemokine receptor (D97A) resulted in disruption of its chemokine and human immunodeficiency virus coreceptor activities (Chabot et al., 1999; Brelot et al., 2000). The authors postulated that an electrostatic interaction might be interrupted in the D2.63A mutation. It is intriguing that a D2.63(97)N somatic mutation of CXCR4 was found to be associated with medulloblastomas (Schüller et al., 2005), further supporting a role for this residue in signal transduction. Our present findings with the D2.63N mutant are consistent with previous reports that showed that mutations of a conserved aspartate residue from TMH 2 (D2.50) resulted in reduction in signal transduction without disruption of ligand binding (Tao and Abood, 1998; Roche et al., 1999). Modeling studies in GPCRs suggest the interaction of specific residues located in spatially different domains of the protein via hydrogen bonding to modulate receptor activation (Sealfon et al., 1995). Likewise, in the inactive state of CB1 proteins, a salt bridge interaction between R3.50 and D6.30 helps to maintain the spatial proximity of the TMH 3 and TMH 6 intracellular regions (McAllister et al., 2004). Furthermore, receptor activation disrupts this ionic interaction, resulting in these residues moving apart and permitting interaction of the inside face of TMH 6 with the G protein. An analogous mechanism might modulate the interaction of I2.62/D2.63 studied here, affecting the TMH 6 conformation associated with the activation of the receptor. However, this remains speculative, and additional computational modeling/mutagenesis studies are warranted to ascertain this theory.
Our data clearly suggest that certain residues in nonbinding domains of the CB1 protein have the ability to modulate receptor function. In conclusion, we have identified I2.62 and D2.63 as residues that delineate agonist binding from signal transduction and provided additional valuable mechanistic insight in the functioning of CB1 receptor.
Acknowledgments
We thank Daniel Fleischer for expert technical assistance and Dr. Patricia Reggio for critical reading of the manuscript.
This work was supported by National Institutes of Health Grants DA09978, DA05274, and DA09518.
ABBREVIATIONS
- GPCR
G protein-coupled receptor
- TMH
transmembrane helix
- hCB1
human CB1
- MC4R
melanocortin-4 receptor
- CP
55940, (−)-3-[2-hydroxyl-4-(1,1-dimethylheptyl)phenyl]-4-[3-hydroxylpropyl] cyclohexan-1-ol
- GTPγS
guanosine 5′-3-O-(thio)triphosphate
- WIN55212-2
(R)-(−)-[2,3-dihydro-5-methyl-3-[(4-morpholinyl)methyl]pyrrolo[1,2,3-de]-1,4-benzoxazin-6-yl](1-naphthalenyl)methanone
- SR141716A
N-(piperidin-1-yl)-5-(4-chlorophenyl)-1-(2,4-dichlorophenyl)-4-methyl-1H-pyrazole-3-carboxamide
- HU210
(−)-11-hydroxyldimethylheptyl-Δ8-tetrahydrocannabinol
- AM4056
(−)-11β-hydroxy-3-(1′,1′-dimethylheptyl) hexahydrocannabinol
- AM281
1-(2,4-dichlorophenyl)-5-(4-iodophenyl)-4-methyl-N-4-morpholinyl-1H-pyrazole-3-carboxamide
- HEK
human embryonic kidney
- WT
wild type
- HBSS
Hanks’ balanced salt solution
- BSA
bovine serum albumin
- HU-308
4-[4-(1,1-dimethylheptyl)-2,6-dimethoxyphenyl]-6,6-dimethyl-bicyclo[3.1.1]hept-2-ene-2-methanol
- CXCR4
chemokine receptor for stromal cell-derived factor 1
- CI
confidence interval
References
- Adan RA, Tiesjema B, Hillebrand JJ, la Fleur SE, Kas MJ, de Krom M. The MC4 receptor and control of appetite. Br J Pharmacol. 2006;149:815–827. doi: 10.1038/sj.bjp.0706929. [DOI] [PMC free article] [PubMed] [Google Scholar]
- Ballesteros JA, Weinstein H. Integrated methods for the construction of three dimensional models and computational probing of structure function relations in G protein-coupled receptors. In: Conn PM, Sealfon SM, editors. Methods in Neuroscience. Academic Press; San Diego: 1995. pp. 366–428. [Google Scholar]
- Breivogel C, Selley D, Childers S. Cannabinoid receptor agonist efficacy for stimulating [35S]GTPγS binding to rat cerebellar membranes correlates with agonist-induced decreases in GDP affinity. J Biol Chem. 1998;273:16865–16873. doi: 10.1074/jbc.273.27.16865. [DOI] [PubMed] [Google Scholar]
- Brelot A, Heveker N, Montes M, Alizon M. Identification of residues of CXCR4 critical for human immunodeficiency virus coreceptor and chemokine receptor activities. J Biol Chem. 2000;275:23736–23744. doi: 10.1074/jbc.M000776200. [DOI] [PubMed] [Google Scholar]
- Chabot DJ, Zhang PF, Quinnan GV, Broder CC. Mutagenesis of CXCR4 identifies important domains for human immunodeficiency virus type 1 X4 isolate envelope-mediated membrane fusion and virus entry and reveals cryptic coreceptor activity for R5 isolates. J Virol. 1999;73:6598–6609. doi: 10.1128/jvi.73.8.6598-6609.1999. [DOI] [PMC free article] [PubMed] [Google Scholar]
- Cheng YC, Prusoff WH. Relationship between the inhibition constant (Ki) and the concentration of inhibitor which causes 50 percent inhibition (IC50) on an enzymatic reaction. Biochem Pharmacol. 1973;22:3099–3108. doi: 10.1016/0006-2952(73)90196-2. [DOI] [PubMed] [Google Scholar]
- D’Antona AM, Ahn KH, Kendall DA. Mutations of CB1 T210 produce active and inactive receptor forms: correlations with ligand affinity, receptor stability, and cellular localization. Biochemistry. 2006a;45:5606–5617. doi: 10.1021/bi060067k. [DOI] [PMC free article] [PubMed] [Google Scholar]
- D’Antona AM, Ahn KH, Wang L, Mierke DF, Lucas-Lenard J, Kendall DA. A cannabinoid receptor 1 mutation proximal to the DRY motif results in constitutive activity and reveals intramolecular interactions involved in receptor activation. Brain Res. 2006b;1108:1–11. doi: 10.1016/j.brainres.2006.05.042. [DOI] [PMC free article] [PubMed] [Google Scholar]
- Després JP. The endocannabinoid system: a new target for the regulation of energy balance and metabolism. Crit Pathw Cardiol. 2007;6:46–50. doi: 10.1097/HPC.0b013e318057d4b4. [DOI] [PubMed] [Google Scholar]
- Fan W, Voss-Andreae A, Cao WH, Morrison SF. Regulation of thermogenesis by the central melanocortin system. Peptides. 2005;26:1800–1813. doi: 10.1016/j.peptides.2004.11.033. [DOI] [PubMed] [Google Scholar]
- Farooqi IS, Keogh JM, Yeo GS, Lank EJ, Cheetham T, O’Rahilly S. Clinical spectrum of obesity and mutations in the melanocortin 4 receptor gene. N Engl J Med. 2003;348:1085–1095. doi: 10.1056/NEJMoa022050. [DOI] [PubMed] [Google Scholar]
- Fay JF, Dunham TD, Farrens DL. Cysteine residues in the human cannabinoid receptor: only C257 and C264 are required for a functional receptor, and steric bulk at C386 impairs antagonist SR141716A binding. Biochemistry. 2005;44:8757–8769. doi: 10.1021/bi0472651. [DOI] [PubMed] [Google Scholar]
- Howlett AC, Barth F, Bonner TI, Cabral G, Casellas P, Devane WA, Felder CC, Herkenham M, Mackie K, Martin BR, et al. International Union of Pharmacology. XXVII. Classification of cannabinoid receptors. Pharmacol Rev. 2002;54:161–202. doi: 10.1124/pr.54.2.161. [DOI] [PubMed] [Google Scholar]
- Huszar D, Lynch CA, Fairchild-Huntress V, Dunmore JH, Fang Q, Berkemeier LR, Gu W, Kesterson RA, Boston BA, Cone RD, et al. Targeted disruption of the melanocortin-4 receptor results in obesity in mice. Cell. 1997;88:131–141. doi: 10.1016/s0092-8674(00)81865-6. [DOI] [PubMed] [Google Scholar]
- Johns DG, Behm DJ, Walker DJ, Ao Z, Shapland EM, Daniels DA, Riddick M, Dowell S, Staton PC, Green P, et al. The novel endocannabinoid receptor GPR55 is activated by atypical cannabinoids but does not mediate their vasodilator effects. Br J Pharmacol. 2007;152:825–831. doi: 10.1038/sj.bjp.0707419. [DOI] [PMC free article] [PubMed] [Google Scholar]
- Kapur A, Hurst DP, Fleischer D, Whitnell R, Thakur GA, Makriyannis A, Reggio PH, Abood ME. Mutation studies of Ser7.39 and Ser2.60 in the human CB1 cannabinoid receptor: evidence for a serine-induced bend in CB1 transmembrane helix 7. Mol Pharmacol. 2007;71:1512–1524. doi: 10.1124/mol.107.034645. [DOI] [PubMed] [Google Scholar]
- Kjelsberg MA, Cotecchia S, Ostrowski J, Caron MG, Lefkowitz RJ. Constitutive activation of the alpha 1B-adrenergic receptor by all amino acid substitutions at a single site. Evidence for a region which constrains receptor activation. J Biol Chem. 1992;267:1430–1433. [PubMed] [Google Scholar]
- Lubrano-Berthelier C, Durand E, Dubern B, Shapiro A, Dazin P, Weill J, Ferron C, Froguel P, Vaisse C. Intracellular retention is a common characteristic of childhood obesity-associated MC4R mutations. Hum Mol Genet. 2003;12:145–153. doi: 10.1093/hmg/ddg016. [DOI] [PubMed] [Google Scholar]
- Matsuda LA, Lolait SJ, Brownstein MJ, Young AC, Bonner TI. Structure of a cannabinoid receptor and functional expression of the cloned cDNA. Nature. 1990;346:561–564. doi: 10.1038/346561a0. [DOI] [PubMed] [Google Scholar]
- McAllister SD, Hurst DP, Barnett-Norris J, Lynch D, Reggio PH, Abood ME. Structural mimicry in class A G protein-coupled receptor rotamer toggle switches: the importance of the F3.36(201)/W6.48(357) interaction in cannabinoid CB1 receptor activation. J Biol Chem. 2004;279:48024–48037. doi: 10.1074/jbc.M406648200. [DOI] [PubMed] [Google Scholar]
- McAllister SD, Rizvi G, Anavi-Goffer S, Hurst DP, Barnett-Norris J, Lynch DL, Reggio PH, Abood ME. An aromatic microdomain at the cannabinoid CB1 receptor constitutes an agonist/inverse agonist binding region. J Med Chem. 2003;46:5139–5152. doi: 10.1021/jm0302647. [DOI] [PubMed] [Google Scholar]
- Munro S, Thomas KL, Abu-Shaar M. Molecular characterization of a peripheral receptor for cannabinoids. Nature. 1993;365:61–65. doi: 10.1038/365061a0. [DOI] [PubMed] [Google Scholar]
- Nie J, Lewis DL. The proximal and distal C-terminal tail domains of the CB1 cannabinoid receptor mediate G protein coupling. Neuroscience. 2001;107:161–167. doi: 10.1016/s0306-4522(01)00335-9. [DOI] [PubMed] [Google Scholar]
- Price MR, Baillie GL, Thomas A, Stevenson LA, Easson M, Goodwin R, McLean A, McIntosh L, Goodwin G, Walker G, et al. Allosteric modulation of the cannabinoid CB1 receptor. Mol Pharmacol. 2005;68:1484–1495. doi: 10.1124/mol.105.016162. [DOI] [PubMed] [Google Scholar]
- Roche J, Bounds S, Brown S, Mackie K. A mutation in the second transmembrane region of the CB1 receptor selectively disrupts G protein signaling and prevents receptor internalization. Mol Pharmacol. 1999;56:611–618. doi: 10.1124/mol.56.3.611. [DOI] [PubMed] [Google Scholar]
- Ryberg E, Larsson N, Sjogren S, Hjorth S, Hermansson NO, Leonova J, Elebring T, Nilsson K, Drmota T, Greasley PJ. The orphan receptor GPR55 is a novel cannabinoid receptor. Br J Pharmacol. 2007;152:1092–1101. doi: 10.1038/sj.bjp.0707460. [DOI] [PMC free article] [PubMed] [Google Scholar]
- Schüller U, Koch A, Hartmann W, Garre ML, Goodyer CG, Cama A, Sorensen N, Wiestler OD, Pietsch T. Subtype-specific expression and genetic alterations of the chemokinereceptor gene CXCR4 in medulloblastomas. Int J Cancer. 2005;117:82–89. doi: 10.1002/ijc.21116. [DOI] [PubMed] [Google Scholar]
- Sealfon SC, Chi L, Ebersole BJ, Rodic V, Zhang D, Ballesteros JA, Weinstein H. Related contribution of specific helix 2 and 7 residues to conformation activation of the serotonin 5-HT2A receptor. J Biol Chem. 1995;270:16683–16688. doi: 10.1074/jbc.270.28.16683. [DOI] [PubMed] [Google Scholar]
- Song Z-H, Bonner TI. A lysine residue of the cannabinoid receptor is critical for receptor recognition by several agonists but not WIN55212-2. Mol Pharmacol. 1996;49:891–896. [PubMed] [Google Scholar]
- Tao Q, Abood ME. Mutation of a highly conserved aspartate residue in the second transmembrane domain of the cannabinoid receptors, CB1 and CB2, disrupts G-protein coupling. J Pharmacol Exp Ther. 1998;285:651–658. [PubMed] [Google Scholar]
- Tao YX. Molecular mechanisms of the neural melanocortin receptor dysfunction in severe early onset obesity. Mol Cell Endocrinol. 2005;239:1–14. doi: 10.1016/j.mce.2005.04.012. [DOI] [PubMed] [Google Scholar]
- Tao YX, Segaloff DL. Functional analyses of melanocortin-4 receptor mutations identified from patients with binge eating disorder and nonobese or obese subjects. J Clin Endocrinol Metab. 2005;90:5632–5638. doi: 10.1210/jc.2005-0519. [DOI] [PubMed] [Google Scholar]
- Wade SM, Lan K, Moore DJ, Neubig RR. Inverse agonist activity at the α2A-adrenergic receptor. Mol Pharmacol. 2001;59:532–542. doi: 10.1124/mol.59.3.532. [DOI] [PubMed] [Google Scholar]
- Wilson MH, Limbird LE. Mechanisms regulating the cell surface residence time of the alpha 2A-adrenergic receptor. Biochemistry. 2000;39:693–700. doi: 10.1021/bi9920275. [DOI] [PubMed] [Google Scholar]
- Xu W, Ozdener F, Li JG, Chen C, de Riel JK, Weinstein H, Liu-Chen LY. Functional role of the spatial proximity of Asp114(2.50) in TMH 2 and Asn332(7.49) in TMH 7 of the mu opioid receptor. FEBS Lett. 1999;447:318–324. doi: 10.1016/s0014-5793(99)00316-6. [DOI] [PubMed] [Google Scholar]
- Zhou W, Flanagan C, Ballasteros JA, Konvica K, Davidson JS, Weinstein H, Millar RP, Sealfon SC. A reciprocal mutation supports helix 2 and helix 7 proximity in the gonadotropin-releasing hormone receptor. Mol Pharmacol. 1994;45:165–170. [PubMed] [Google Scholar]