Figure 1.
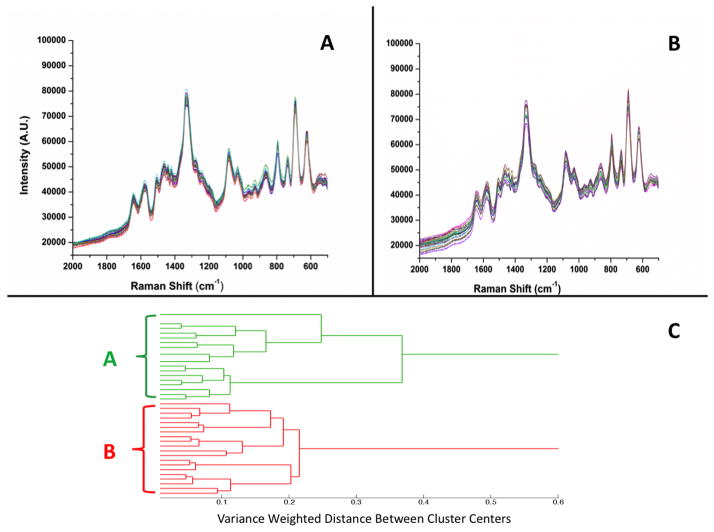
SERS spectra of: (A) high virulence DNA probe (1000 nM) with 6-mercapto-1-hexanol spacer (100 nM) on a Ag nanorod substrate, and (B) low virulence DNA probe-spacer complex. (C) Dendrogram produced by hierarchical cluster analysis (HCA) of the SERS spectra shown in panels A and B and label-coded as follows: (A) high virulence DNA probe calculated from spectra in panel A, and (B) low virulence DNA probe calculated from spectra in panel B. Panels A and B show 20 individual SERS spectra collected using multiple wells and multiple substrates; spectra are presented without any processing.

