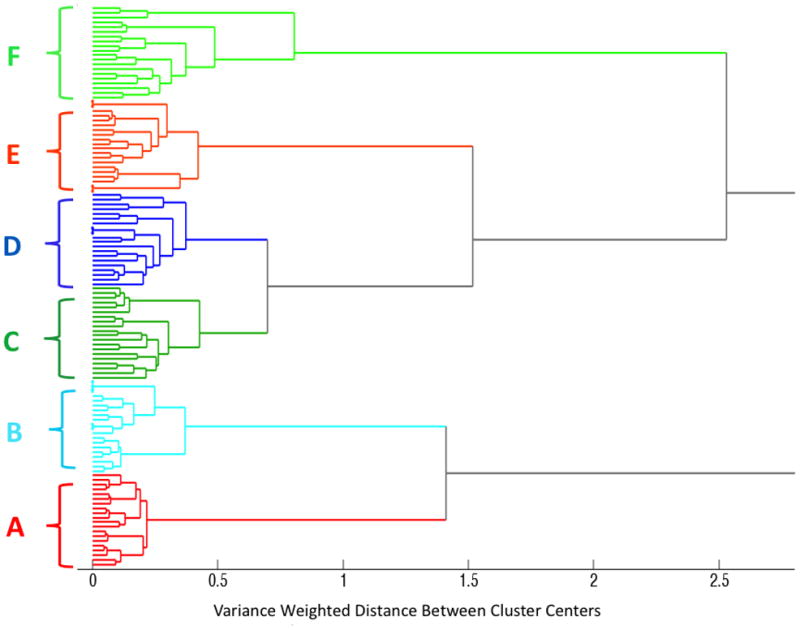
Figure 3.

Dendrogram produced by hierarchical cluster analysis (HCA) of the SERS spectra shown in Figure 2, and label-coded as follows: (A) high virulence DNA probe, (B) low virulence DNA probe, (C) high virulence DNA probe with its complementary high virulence RNA target, (D) low virulence DNA probe with its complementary low virulence RNA target, (E) high virulence DNA probe with a non-complementary low virulence RNA target, and (F) low virulence DNA probe with a non-complementary high virulence RNA target. A total of 120 spectra were used to generate this dendrogram, corresponding to 20 spectra in each of the 6 DNA probe-RNA sample categories.
