

Abstract
Oncogenic signaling pathways are tightly regulated by negative feedback circuits and relief of these circuits represents a common mechanism of tumor drug resistance. Although the significance of these feedback pathways for signal transduction is evident, their relevance for cellular differentiation and morphogenesis in a genetically-defined context is unclear. In this study, we used isogenic benign mammary organotypic cultures to interrogate the role of mTOR-mediated negative feedback in the specific setting of PTEN inactivation. We found that mTOR signaling promoted basal-like differentiation and repressed nuclear hormone receptor expression after short-term PTEN loss in murine cell cultures analyzed ex vivo. Unexpectedly, we found that PTEN inactivation inhibited growth factor-induced epithelial invasion, and that downstream mTOR-mediated signaling feedback was both necessary and sufficient for this effect. Mechanistically, using isogenic MCF10A cells with and without somaticPTEN deletion, we showed that mTOR inhibition promoted EGF-mediated epithelial invasion by de-repressing upstream EGFR, SRC and PI3K signaling. In addition to offering new signal transduction insights, these results bring to light a number of important and potentially clinically relevant cellular consequences of mTOR inhibition in the specific context of PTEN loss, including modulation of hormone and growth factor responsiveness and promotion of epithelial invasion. Our findings prompt future investigations of the possibility that mTOR inhibitor therapy may not only be ineffective but even deleterious in tumors with PTEN loss.
Keywords: PTEN, mTORC1, feedback, invasion, breast
Introduction
PTEN (phosphatase and tensin homologue) is a tumor suppressor and lipid phosphatase that antagonizes oncogenic PI3K (phosphoinositide-3-kinase) activity. Increased net PI3K activity is a key event in breast tumorigenesis, occurring via activating PIK3CA mutations or with loss of PTEN in as many as 75% of patients (1). The critical role of PTEN loss in promoting breast tumorigenesis is illustrated by Cowden’s syndrome, where germline PTEN inactivation is associated with an 85% lifetime incidence of breast carcinoma (2). One important result of PTEN loss is activation of AKT which leads to phosphorylation and inactivation of the TSC1/2 tumor suppressor complex, and increased downstream mTORC1/2 (mammalian Target of Rapamycin) signaling. The cellular effects of PTEN loss have been well-studied in 2D monolayer culture systems and include increased proliferation and invasion and reduced apoptosis and cell-cell adhesion (3).
Importantly, the relevance of PTEN loss for epithelial differentiation and sensitivity to targeted therapeutics has only recently been elucidated. The association between PTEN loss and basal-like differentiation was initially reported for mammary carcinomas developing in PTEN+/- mice, which commonly express myoepithelial-type cytokeratins and are negative for estrogen receptor (ER) (4). These murine tumors recapitulate human PTEN-null breast carcinomas, which cluster in the basal-like category by expression profiling and are commonly hormone receptor negative (4) and tamoxifen-resistant (5). In addition to hormone-independence, loss of PTEN is also associated with independence from HER signaling, both in vitro and in vivo. PTEN-null MCF10A cells are EGF-independent (6) and PTEN loss is a common genomic change underlying trastuzumab resistance (7, 8). However, the molecular mechanisms underlying these characteristic features of PTEN deletion remain unclear.
Recently, a number of studies have highlighted the importance of potent negative feedback loops from PI3K/AKT/mTOR signaling to upstream receptor tyrosine kinase (RTK) and hormone receptor signaling (9–16). Since activated PI3K/AKT/mTOR signaling is a hallmark of PTEN loss, it is possible that this feedback may underlie resistance of PTEN-null tumors to hormonal and HER-targeted therapies. Experiments in genetically heterogeneous systems have demonstrated that treatment with rapamycin (a potent inhibitor of mTORC1 signaling) or mTOR kinase inhibitors (which inhibit mTORC1 and mTORC2) releases negative feedback to upstream HER, IGF/IR and PDGFR signaling, resulting in potent downstream activation of PI3K and MAPK (11, 12, 17, 18). Further, work on prostate cancer has demonstrated that reciprocal negative feedback between PI3K/mTOR and androgen receptor signaling mediates hormonal resistance, although it remains unclear whether a similar mechanism regulates estrogen signaling in breast tissue (19, 20).
As targeted cancer therapeutics become the norm, defining the relevance of these negative feedback circuits in the context of specific genetic aberrations is increasingly important. Does PTEN loss, which promotes unfettered PI3K/AKT signaling, mitigate the effects of mTOR-mediated feedback on upstream RTK activity? A systematic comparison of the significance of this feedback pathway in isogenic PTEN-expressing and PTEN-null systems has not been performed. A second important question is whether these potent signaling feedback pathways have relevance for cell behavior. To date, most work has elucidated the significance of this feedback at the signaling level. Although single agent rapalog therapies are generally not effective and xenograft studies support the improved efficacy of combined RTK and mTOR inhibitor therapies (18, 21, 22), it remains unclear whether mTOR-mediated signaling feedback may be actually deleterious, modulating critical cell behaviors such as invasion or motility. In large part, this may be because nearly all previous studies have focused on effects in 2D monolayer cell cultures. Accordingly, a recent study illustrates how the cellular consequences of up-regulated RTK signaling following PI3K/mTOR suppression are best modeled using systems that recapitulate in vivo tissue architecture (23).
Here, we interrogate the role of PTEN and downstream PI3K/mTOR signaling in the regulation of mammary epithelial differentiation and cell behavior using 3D organotypic cultures. Though the cells used in these studies are derived from benign tissues, an important advantage of the systems used herein is that they are fully isogenic, allowing us to specifically isolate the role of PTEN in signaling feedback, independent of genetic background effects. We report that feedback from mTOR signaling downstream of PTEN loss modulates tissue differentiation and hormone receptor expression. Further, in the context of PTEN loss, mTOR activation plays an unanticipated role in restraining epithelial cell invasion by inhibiting upstream tyrosine kinase signaling. Taken together, this work provides insight into the physiological relevance of mTOR-mediated feedback in the specific setting of PTEN-null mammary tissue.
Materials and Methods
Mouse lines
Animal protocols were approved by the JHU Animal Care and Use Committee. Mice with inducible PTEN loss-of-function (R26CreER;PTENloxp/loxp) and the mT/mG reporter (R26CreER;mT/mG) were generated as described (24–27). R26CreER and TSC1loxp/loxp mice (28), (Jackson Laboratory) were crossed to obtain R26CreER;TSC1loxp/loxp mice (referred to as TSC1−/− following 4-hydroxytamoxifen [4-OHT] treatment) and TSC1loxp/loxp (TSC1+/+ following 4-OHT) or R26CreER;TSC1WT/loxp (TSC1+/- following 4-OHT) littermate controls.
Mammary organoid culture
The procedure of mammary organoid isolation has been described elsewhere (29). Following isolation, organoids were plated in a disk of growth factor-reduced Matrigel (BD Bioscience). Defined culture media included DMEM (Invitrogen), ITS (Sigma), penicillin/streptomycin (Invitrogen) and 2.5 nM FGF2, TGFα or EGF (Peprotech) as well as 20 nM 4-OHT (Sigma) for the first 18 hours. After 18 hours of culture, media containing 4-OHT was removed, organoids were gently washed, and media lacking 4-OHT was replaced for the duration of culture. Organoids were imaged by stereomicroscopic (Carl Zeiss) and differential interference contrast (DIC) imaging (Zeiss AxioObserver).
Time-lapse DIC imaging
Live cell imaging was performed as described (27). DIC images were collected every 20 minutes for up to 100 hours.
Quantification of organoid morphogenesis
Organoid size was quantified at day 7 of culture by measuring longest axis (Zeiss AxioVision) in 3 independent experiments (14–33 organoids/condition). Plasma membranes were delineated on histologic sections using E-Cadherin immunofluorescence and cell area measured for 10 representative organoids/condition in ImageJ (8–26 cells/organoid). Organoid budding was quantified in 5 independent experiments as the proportion of organoids with >2 buds (100–300 organoids/condition). Mean proportions were normalized to wild-type for each replicate, since the percentage of branched wild-type organoids varied (33–88%) across experiments. The number of buds/organoid was visually counted for 30–300 organoids in one representative experiment. Luminal filling was defined as >50% cellular filling of internal luminal space on histologic sectioning and was assessed 3 independent experiments (24–51 organoids/condition).
Cell culture
Isogenic MCF10A parental cells and two independent clones with homozygous targeted recombination at the PTEN locus (PTEN−/− #1, PTEN−/− #2) were a gift of K Bachman (University of Maryland) (30). Conditions for 2D monolayer culture (30), 3D acinar culture in Matrigel (31), and 3D acinar culture in collagen-Matrigel mixtures (32) have been described. MCF10A-ER-SRC cells (33) were a gift of K Struhl (Harvard) and were maintained as described.
Quantification of morphogenesis in MCF10A acini
Acinar size was quantified at day 18 of culture in Matrigel by measuring diameter (Zeiss AxioVision). Invasive protrusions were quantified at day 3 of culture in collagen-Matrigel as the proportion of acini containing at least one invasive cytoplasmic protrusion under phase contrast imaging in 3 independent experiments (100–300 acini/condition).
Proliferation and apoptosis assays
Organoids were pulsed with 10 μM BrdU (BD Bioscience) at day 4 or 7 of culture followed by fixation, processing, histologic sectioning and immunohistochemistry to detect BrdU. BrdU immunohistochemistry was scored manually by counting the proportion of positively stained nuclei for at least 10 organoids/condition in 3 independent experiments were analyzed. Cleaved caspase 3 (CC3) immunohistochemistry was quantified at day 4 or 7 of culture as the proportion of positively stained cells for 3 independent experiments (10 organoids/condition). For MCF10A acini, immunofluorescence for CC3 was performed at day 18 of culture and imaged by confocal microscopy as described below. The percent CC3-positive cells was assessed for 7–8 acini/genotype (50–500/cells each).
Inhibitors
Pharmacologic inhibitors were dissolved in DMSO and added to culture media at day 0 upon plating at concentrations spanning the IC50 values: rapamycin (200 nM; LC Laboratories); AZD0855 (500 nM; LC Laboratories); torin1 ((34); 500nM; a gift of DM Sabatini, Harvard); GDC0491 (1uM; LC Laboratories); BEZ235 (1μM, LC Laboratories); lapatinib (5 uM; LC Laboratories); erlotinib (250 nM; LC Laboratories); dasatinib (100 nM; LC Laboratories); LY294002 (25 μM; Sigma); marimastat (5 μM; Sigma); TAPI-1 (10 μM; Millipore).
Immunoblotting
Organoids, acini and cell monolayers were immunoblotted by SDS-PAGE as described (27) using primary antibodies from Cell Signaling Technologies: p-EGFR (Y1068), p-AKT(T308), p-AKT(S473), p-p70S6K, pSRC (Y416), pS6, S6, non p-SRC, EGFR, pan-AKT, p70S6K, β-actin, PTEN, TSC1.
Immunohistochemistry/immunofluorescence
Organoids were fixed in 10% neutral buffered formalin (Fisher), embedded in 1% agarose, processed, paraffin-embedded and sectioned by standard histologic methods. Immunohistochemistry was performed as described (27) using antibodies to PTEN and p-AKT(S473) (Cell Signaling), BrdU (Fitzgerald Industries), cleaved caspase 3 (Cell Signaling), and estrogen receptor (Leica Biosystems). For immunofluorescence of histologic organoid sections, slides were processed as described for immunohistochemistry, incubated with antibodies to K14 (Millipore), K8 (TROMA-I, Developmental Studies Hybridoma Bank), and/or smooth muscle actin (Sigma) or E-Cadherin (Cell Signaling). Directly conjugated phalloidin (Invitrogen) was used to detect F-actin. mT/mG immunofluorescence was directly detected in cryosections. Immunofluorescence of MCF10A acinar cultures for laminin (Millipore) and GM130 (BD Biosciences), was performed as described (31) and confocally imaged in serial 5 μm Z-sections (Zeiss LSM 510).
Immunohistochemistry/Immunofluorescence quantification
CK14 expression was quantified as proportion of CK14-expressing luminal cells/organoid on histologic sections in 3 independent experiments (6–14 organoids/condition). Mean proportions were normalized to wild-type since the average percent CK14 positive luminal cells in the wild-type organoids varied between replicates (3.8 to 15.8%). Estrogen receptor (ER) expression was quantified using H-score. The H-score is calculated as 1*(percentage 1+ intensity cells) + 2*(percentage 2+ cells) + 3* (percentage 3+ cells). 7–15 organoids were assessed/condition/experiment (30–200 cells/organoid). mT/mG immunofluorescence was quantified as the percentage of EGFP-expressing cells/organoid on cryosections assessing 20 organoids/timepoint from one representative experiment.
RTK array
Phospho-RTK signaling arrays (Cell Signaling Technologies) were performed according to the manufacturer’s instructions using cell lysates from 2D monolayers exposed to specified drug for 18 hours. Arrays were immediately captured via digital chemiluminescent imaging (Alpha Innotech).
Statistics
Statistical analysis was performed throughout using Student’s unpaired t-test.
Results
Murine mammary organoids undergo invasive budding in response to FGF or HER ligands
In the murine mammary ex vivo culture system, ductal fragments are isolated and embedded in laminin-rich extracellular matrix (ECM) where they recapitulate normal bilayered ductal organization. Although the organoids are initially cystic, 4 days following the addition of exogenous growth factor, the luminal cells proliferate to fill the interior space. By day 7, the luminal cells have invaded beyond the surrounding myoepithelial cell layer into the ECM, recapitulating pubertal ductal morphogenesis and the early stages of invasive breast cancer (29) (Supplementary Figure S1, Supplementary Movie 1, top panels of Figure 2D). Although both FGF and HER ligands can independently induce invasive budding in this system (29), we found that FGF2 is more effective than TGFα or EGF and a small but consistent synergistic response was seen with both ligands together (Supplementary Figure S1).
Figure 2. Short-term PTEN loss in primary mammary organoid culture promotes cell and tissue growth but inhibits growth factor-induced epithelial cell invasion.
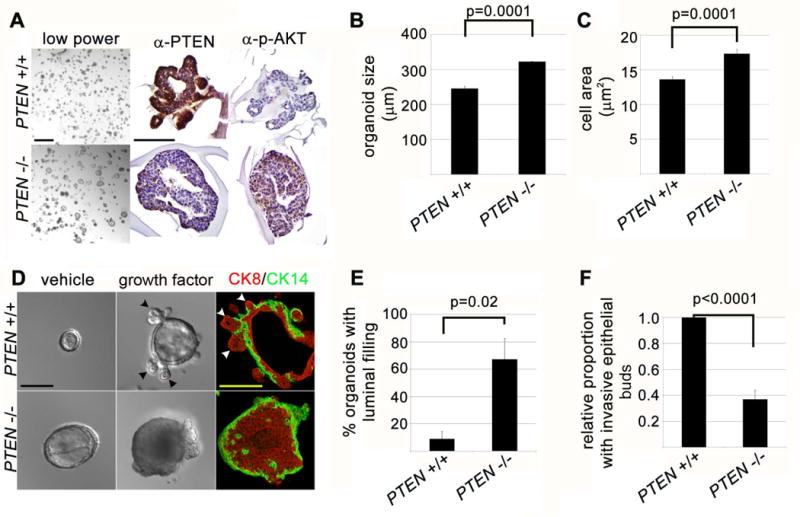
(A) PTEN loss promotes mammary organoid growth. Left panels: organoids imaged by stereomicroscopic imaging at day 7 of culture in FGF2-containing media (6 days after 24 hour 4-OHT exposure). Scale bar = 1 mm. Middle and right panels: immunohistochemistry for PTEN and p-AKT protein. Scale bar = 200 μm. (B) PTEN loss promotes mammary tissue and cell growth. Quantification of organoid size at day 7 (represents mean and SEM of 3 independent experiments). (C) Quantification of average cell area based on E-Cadherin staining at day 7 (represents mean and SEM of cell area in tissue section). (D) PTEN loss promotes growth-factor independent organoid growth and growth-factor dependent luminal filling, but inhibits growth-factor dependent epithelial invasion. Left panels: DIC imaging of day 7 organoid cultures in absence of growth factor. Scale bar = 200 μm. Middle panels: DIC imaging of day 7 organoid cultures in presence of FGF2. Left panels: immunofluorescence for CK14 (green) and CK8 (red) at day 7 of culture in presence of FGF2. (E) Quantification of luminal filling (defined as > 50% filling of central lumen by viable cells on histologic sectioning) at day 7 of culture (represents mean and SEM of 3 independent experiments). (F) Quantification of relative invasive epithelial branching (represents mean and SEM of 5 independent experiments).
Since ADAM17 (a metalloproteinase that cleaves and activates membranous HER ligands) is required for ductal invasion during puberty (34), we tested whether autocrine and/or paracrine HER signaling may regulate full response to FGF ligands in vitro, as documented in other epithelial systems (35). We found that treatment of organoids with marimastat or TAPI-1 (metalloproteinase inhibitors) markedly inhibited budding in response to FGF2 alone in a manner that could be rescued with exogenous TGFα (Supplementary Figure S1, data not shown), suggesting that autocrine/paracrine HER signaling is required downstream of FGF2 addition for in vitro epithelial invasion in this system.
Short-term PTEN loss is efficiently induced in primary mammary organoid culture
In order to query the short-term effects of PTEN loss-of-function on cellular differentiation and morphogenesis in this system, we isolated mammary organoids from R26CreER;PTENloxp/loxp mice. Using the mTmG reporter, we found that an 18-hour incubation with 4-hydroxytamoxifen (4-OHT) at day 0 of culture (followed by washout) was sufficient to induce Cre activity in 60% of cells by day 3 of culture with minimal effects on morphogenesis (Supplementary Figure S1). Accordingly, by day 4 of culture, we observed efficient PTEN protein loss in R26CreER; PTENloxp/loxp organoids (referred to as PTEN−/− after 4-OHT) compared to littermate PTENloxp/loxp controls (referred to as PTEN+/+ after 4-OHT), with concomitant increases in downstream activated AKT (Figure 1A).
Figure 1. mTORC1 signaling promotes basal-like differentiation and is necessary and sufficient to inhibit nuclear estrogen receptor expression downstream of short-termPTENloss.
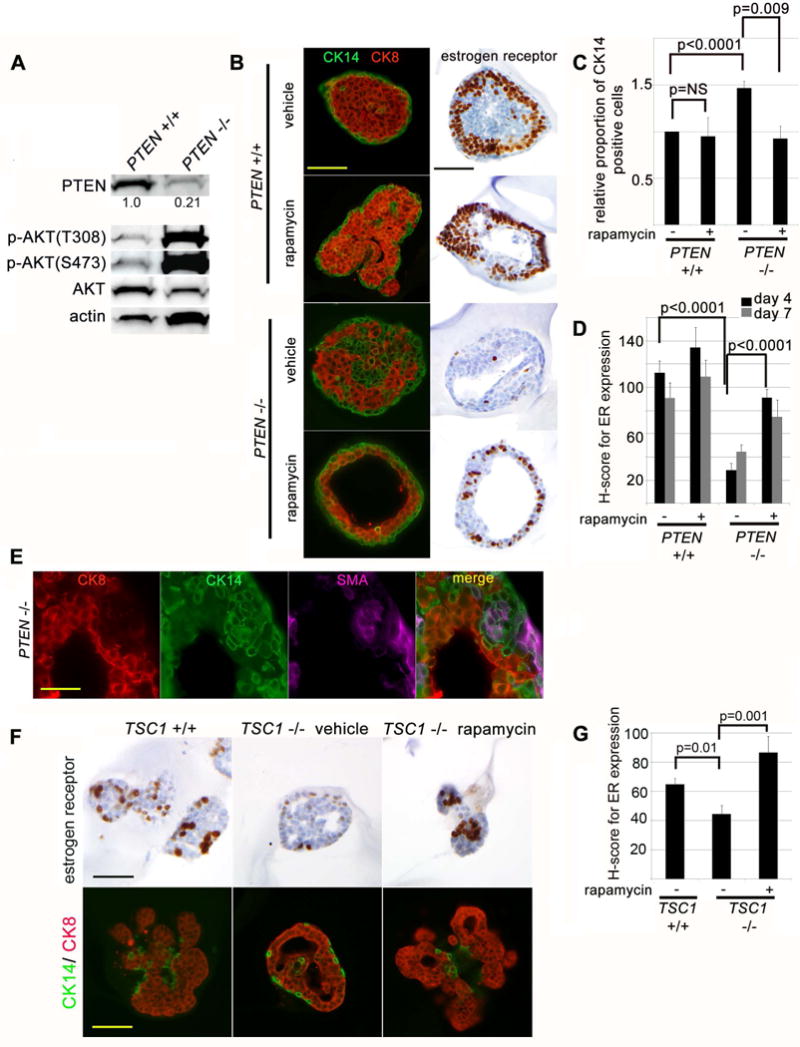
(A) In vitro system for inducible PTEN loss-of-function is efficient in mammary organoid cultures. Immunoblot of PTEN+/+ (PTENloxp/loxp) and PTEN−/− (R26ERCre;PTENloxp/loxp) mammary organoid lysates 3 days after 24 hour exposure to 4-OHT to induce Cre activity. (B) PTEN−/− organoids express basal-type cytokeratins and show decreased nuclear estrogen receptor (ER) expression in luminal cells and these findings are reversed by inhibition of mTORC1 signaling. Immunofluorescence for CK14 (green) and CK8 (red) at day 4 of culture in presence of growth factor (prior to branching morphogenesis). Nuclear ER is detected by immunohistochemistry at the same time point. Scale bar = 100 μm (C) Quantification of CK14 expression in luminal cells at day 4 and 7 of culture (represents mean and SEM for 3 independent experiments). (D) Quantification of nuclear ER expression in by H-score (mean and SEM from one representative experiment of two). (E) Myoepithelial differentiation in luminal epithelial cells of PTEN−/− organoids is incomplete. Immunofluorescence for smooth muscle actin (SMA, purple), CK14 (green) and CK8 (red) in day 4 organoid cultures. Scale bar = 50 μm. (F) mTORC1 activation is necessary and sufficient to decrease nuclear ER expression in mammary epithelial cells. Immunohistochemistry for nuclear ER, CK14 (green) and CK8 (red) expression at day 7 of culture. Scale bar = 200 μm. (G) Quantification of nuclear ER expression by H-score (mean and standard error from one representative experiment of two).
mTORC1 signaling promotes basal-like differentiation and is necessary and sufficient to inhibit estrogen receptor expression downstream of short term PTEN loss
It remains unclear whether PTEN loss is directly responsible for basal-like differentiation in human PTEN-null tumors (4), and if so, which downstream signal transduction pathways are required. To address this question, we assessed keratin and estrogen receptor (ER) expression in our benign isogenic system with short-term PTEN loss. At day 4 of culture, PTEN+/+ organoids were solid bilayered structures, with a single layer of CK14-myoepithelial cells surrounding CK8-positive luminal epithelial cells (29) (Figure 1B, 1C). In contrast, PTEN−/− organoids contained a mixture of CK8- and CK14-expressing cells in their lumens, with nearly a 50% increase in luminal CK14-positive cells. The increase in luminal CK14-positive cells could be due to increased proliferation or aberrant differentiation. Unlike CK14-positive myoepithelial cells in wild-type organoids, these CK14-positive cells in PTEN−/− organoids did not uniformly co-express smooth muscle actin (SMA), suggesting that they have undergone partial but incomplete myoepithelial differentiation (Figure 1E). Additionally, the location of these cells within the luminal compartment (as opposed to the periphery) suggested that they arose from aberrant differentiation of luminally-located cells, rather than due to increased relative proliferation of the CK14-positive myoepithelial compartment in the PTEN−/− organoids. Finally, quantification of proliferation as measured by BrdU incorporation revealed no significant difference between the ratio of percent proliferating CK14-positive cells to percent proliferating non-CK14-positive cells in the PTEN+/+ and PTEN−/− organoids (1.46±0.50 vs. 1.20 ±0.30, p=NS), despite accumulation of CK14-positive cells specifically in the PTEN−/− organoids.
In order to discern which signaling pathways activated downstream of PTEN loss might mediate this basal-like differentiation, we treated PTEN−/− organoids with mTOR inhibitors. We found that rapamycin (a potent mTORC1 inhibitor which suppresses p-p70S6K and p-S6 levels, Figure 3B) substantially decreased the number of luminal CK14-positive cells in PTEN-null organoids, with negligible effect on the number of CK14-positive cells in wildtype organoids (Figure 1B, 1C).
Figure 3. mTORC1 signaling downstream of PTEN loss inhibits mammary epithelial cell invasion in 3D organoid cultures.
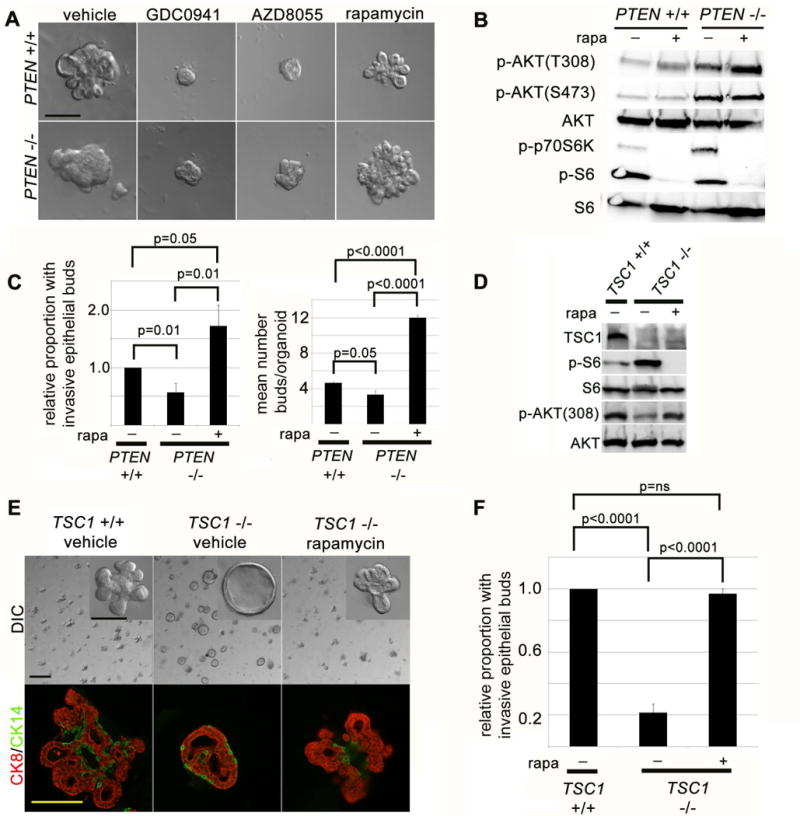
(A) PI3K and mTOR kinase, but not mTORC1 function, are required for growth factor stimulated mammary epithelial invasion. DIC imaging of mammary organoid cultures at day 7 with PI3K inhibitor (GDC0941, 1 μM), mTOR kinase inhibitor (AZD8055, 500 nM) abrogates mammary epithelial budding, or mTORC1 inhibitor (rapamycin, 200 nM). Scale bar = 200 μm. (B) mTORC1 activity restrains full PI3K activation in PTEN−/− organoids. Immunoblot of organoid lysates at day 4 after treatment with rapamycin (200 nM). (C) mTORC1 activity inhibits growth factor induced mammary epithelial branching in PTEN−/− organoids. Left: Quantification of epithelial invasion (represents mean and SEM of 5 independent experiments). Right: Quantification of mean number of invasive buds/organoid (represents mean and SEM for one representative experiment). (D) mTORC1 activation and PI3K inhibition occur in TSC1−/− organoids. Immunoblot of TSC1−/− (ROSA[ER]-cre TSC1loxp/loxp) and TSC1+/+ (TSC1loxp/loxp) organoid lysates at 4 days after 24 hour exposure to 4-OHT to induce Cre activity. (E) mTORC1 activation is sufficient to inhibit growth factor stimulated mammary epithelial invasion in organoid cultures. Top panels: DIC imaging of day 7 organoid cultures in presence of FGF2. Scale bar = 1 mm and 200 μm in inset. Bottom panels: immunofluorescence for CK14 (green) and CK8 (red) at day 7 of culture in presence of FGF2. (F) Quantification of epithelial invasion (represents mean and SEM of 3 independent experiments).
Murine and human tumors with PTEN loss are also commonly hormone receptor negative, however the signaling pathways regulating this effect are unclear (4). We found that even short-term PTEN loss was sufficient to markedly decrease nuclear estrogen receptor (ER) expression in the luminal cells of murine organoids at day 4 and day 7 of culture (Figure 1B, 1D). Importantly, mTORC1 activity was necessary for this effect, as treatment of PTEN−/− organoids with rapamycin restored nuclear ER levels, without any significant effect on nuclear ER levels in PTEN +/+ cells (Figure 1B, 1D). Interestingly, treatment of PTEN−/− organoids with GDC0941, which in contrast to rapamycin inhibits PI3K and mTORC2 activity in addition to mTORC1 (see Figure 7), resulted only in a very modest and statistically insignificant rescue of nuclear ER levels (26% increase in average H-score, p=0.14, data not shown). Thus, in the context of constitutively suppressed PI3K/mTORC2 activity, mTORC1 inhibition is insufficient to rescue ER expression in PTEN−/− cells.
Figure 7. Concurrent inhibition of PI3K, EGFR/HER2 or SRC suppresses invasive behavior of mTORC1-inhibitedPTEN−/−mammary epithelial cells.
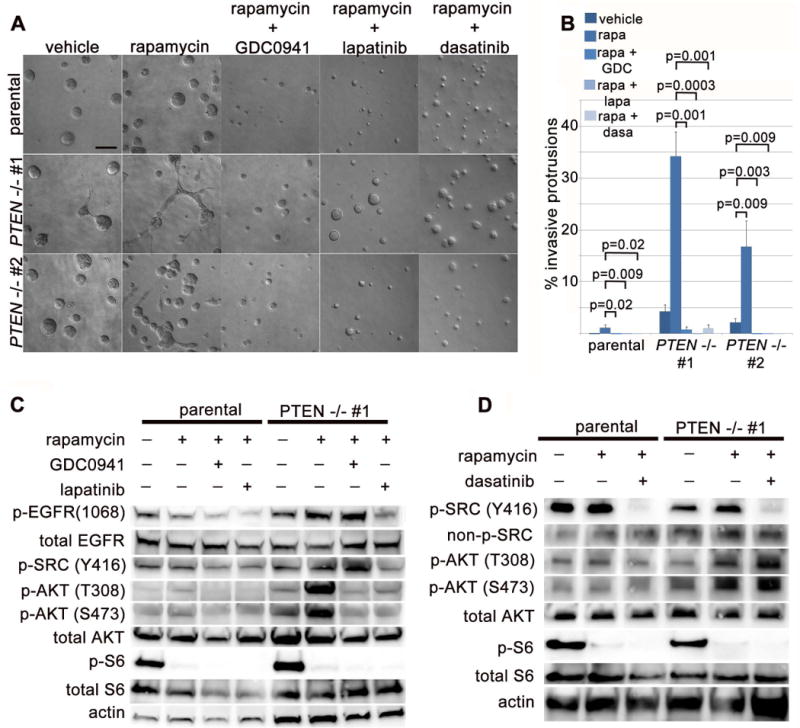
(A) Epithelial invasion in rapamycin-treated PTEN−/− cells requires PI3K, EGFR/HER2 and SRC signaling. DIC imaging of day 3 cultures treated simultaneously with rapamycin (200 nM) and GDC0941 (1 μM, PI3K inhibitor), lapatinib (5 μM, EGFR/HER2 inhibitor) or dasatinib (100 nM, SRC inhibitor). Scale bar = 100 μm. (B) Quantification of invasive protrusion formation with inhibitor treatment (represents mean and SEM for 3 independent replicates). (C) Immunoblot of 3D acinar lysates treated for 18 hours with rapamycin in addition to GDC0941, or lapatinib. (D) Immunoblot of 3D acinar lysates treated for 18 hours with rapamycin in addition to dasatinib.
To query whether mTORC1 activation independent of PTEN loss is sufficient to suppress nuclear ER expression, we generated R26ERCre TSC1loxp/loxp organoids (hereafter referred to as TSC1−/−). TSC1−/− organoids have markedly increased mTORC1 activity as evidenced by increased p-S6, and this can be suppressed with rapamycin treatment (Figure 3D). By day 7 of culture after growth factor addition, TSC1−/− organoids demonstrated reduced nuclear ER expression compared to their wild-type counterparts, an effect reversible by rapamycin (Figure 1F, 1G). In contrast to PTEN−/− organoids, the number of luminal CK14-positive cells was not significantly increased in TSC1−/− organoids, suggesting that the changes in CK14 and ER expression are independent and that mTORC1 activity is not sufficient to increase basal-like keratin expression in this system (Figure 1F). Thus, downstream of short-term PTEN loss, mTORC1 activity is necessary to promote basal-like differentiation and suppress ER expression in mammary organoid cultures. Further, mTORC1 activation independent of PTEN loss is sufficient to inhibit nuclear ER expression, but not to promote basal-like differentiation.
Because PTEN loss promotes independence from HER signaling in human tumors and cell lines (6–8), we also examined whether mammary organoids with short-term PTEN loss could survive in the absence of EGFR/HER2 signaling. Consistent with our finding that autocrine/paracrine HER signaling occurs in the organoid system in the presence of FGF2, we found that treatment with lapatinib (a combined EGFR/HER2 inhibitor) decreased viability of wild-type mammary organoids cultured in FGF2 (Supplementary Figure S2). These data suggest that in addition to modulating epithelial invasion in this system, at least minimal autocrine/paracrine EGFR/HER2 signaling is required for cell survival in wild-type organoids. Although marimastat blocks autocrine release of HER ligands, it did not result in decreased organoid viability (Supplementary Figure S1B), likely because it results in a less complete block of this autocrine signaling compared to lapatinib. In contrast to wild-type organoids, PTEN−/− organoids showed no decrement in viability in the presence of lapatinib. This suggests that cell survival is no longer dependent on HER signaling in the context of PTEN loss, likely due to constitutive activation of downstream intracellular survival signaling pathways. Importantly, rapamycin treatment did not restore sensitivity to lapatinib (data not shown), suggesting that constitutive mTORC1 activation is not critical for cell survival in PTEN−/− organoids.
Short term PTEN loss promotes cell and tissue growth and inhibits epithelial cell invasion of extracellular matrix (ECM)
By day 7 of culture with growth factor, PTEN−/− mammary organoids lacked PTEN protein expression and showed increased AKT phosphorylation (Figure 2A). As expected, they were also larger than their wild-type counterparts (Figure 2A, 2B), due in part to the increased size of individual luminal epithelial cells (Figure 2C), an effect reversible with rapamycin (data not shown) and independent of growth factor (Figure 2D). In contrast to wild-type organoids which were predominantly cystic at this timepoint, the majority of PTEN−/− organoids showed persistent filling of the luminal space by CK8- and CK14-expressing cells (Figure 2D, 2E). Most striking, fewer than half as many PTEN−/− organoids responded to growth factor by developing invasive CK8-positive epithelial buds extending into the surrounding ECM (Figure 2D, 2F). Taken together, PTEN loss drives increased tissue size and luminal filling within days in mammary organoids. Surprisingly, however, PTEN loss restrains growth factor-induced epithelial budding in the context of the organoid system.
mTORC1 signaling downstream of PTEN loss is necessary to inhibit mammary epithelial cell invasion in organoid cultures
Next, we examined which signal transduction pathways downstream of PTEN loss might suppress growth factor-induced mammary epithelial cell invasion. Both PI3K-mTORC1/2 inhibitors (GDC0941, Figure 3A, LY294003, data not shown) and specific mTOR kinase inhibitors that block mTORC1/2 signaling (AZD8055 or torin1; Figure 3A and data not shown) all potently inhibited epithelial budding in both genotypes. Thus PI3K activation and mTOR kinase function are required for budding in this system. Surprisingly, we observed that rapamycin did not suppress epithelial invasion in wild-type mammary organoids, indicating that while mTORC1 function is not required, PI3K- and mTORC2- dependent invasion occurs in this system. In fact, rapamycin treatment rescued epithelial budding in PTEN−/− mammary organoids, increasing the percentage of branched organoids and the number of buds/ organoid even beyond wild-type controls (Figure 3A, 3C). In contrast, there were no consistent effects of rapamycin on budding in PTEN+/+ organoids. mTORC1 inhibition was associated with an increase in PI3K activity (as measured by p-AKT[T308]), even in PTEN−/− organoids (Figure 3B). Thus, these data indicate that in PTEN-null mammary organoids, mTORC1 activity simultaneously restrains full PI3K activation and suppresses epithelial invasion.
Because luminal cell proliferation is required for epithelial invasion in the organoid system (29), we next asked whether the increased budding in rapamycin-treated PTEN−/− organoids (and decreased budding in GDC0941- and AZD8055-treated organoids) could be due to changes net proliferation. Notably, both GDC0941 and AZD8055 dramatically decreased proliferation as measured by BrdU incorporation on day 4 (Supplementary Figure S3), making it difficult to discern whether decreased cellular proliferation or impaired epithelial migration/invasion underlie the effects of these inhibitors on budding. Despite the fact that it increased epithelial branching in PTEN−/− organoids, we found that rapamycin actually suppressed proliferation as measured by BrdU incorporation on day 4 and increased apoptosis as measured by cleaved caspase 3 (CC3) expression on day 7 (Supplementary Figure S3). Thus, rapamycin likely increases budding by modulating epithelial migration and invasion.
mTORC1 activation is sufficient to restrain growth factor-induced mammary epithelial invasion
In order to query whether mTORC1 activation was sufficient to inhibit epithelial invasion, we studied TSC1−/− organoids. Compared to their wild-type counterparts, TSC1−/− organoids showed a depressed level of PI3K activation measured by p-AKT (T308) (Figure 3D). This correlated with a dramatic decrease in invasive buds in response to growth factor (Figure 3E, 3F). In contrast, rapamycin-treated TSC1−/− organoids demonstrated full rescue of epithelial invasion, with numerous CK8-positive buds beyond the myoepithelial cell layer (Figure 3E, 3F), while rapamycin-treated wild-type organoids showed no significant effects (data not shown). Thus, mTORC1 activation is both sufficient to inhibit growth factor-induced epithelial invasion in the absence of PTEN loss and necessary to restrain invasion in the context of PTEN loss.
PTEN loss in MCF10A cells promotes luminal filling in 3D culture but does not disrupt apical-basal polarity specification of matrix-attached cells
In order to confirm our findings in a human system with long-term PTEN loss, we took advantage of established isogenic MCF10A cell lines with and without PTEN deletion (6). The wild-type parental cells formed well-developed acinar structures lined by a single layer of epithelial cells when cultured in laminin-rich ECM (Matrigel) for 18 days (31) (Figure 4A, 4C). In contrast, two independent PTEN−/− clones (PTEN−/− #1 and PTEN−/− #2) formed predominately solid structures that were nearly twice as large as the parental acini (Figure 4). Despite reports of a requirement for PTEN in apicobasal polarity specification (36), matrix-attached cells from PTEN−/− clones were appropriately polarized similar to the parental clones (Figure 4C). In contrast, internal, non-matrix-attached cells were randomly polarized in both parental and PTEN−/− clones. As PI3K activity has recently been shown to prevent apoptosis of internal, non-matrix-attached cells (23), we immunostained for cleaved caspase 3 (CC3) and noted a decrease in apoptosis in these cells in PTEN−/− clones, although this did not reach statistical significance (Figure 4E, 4F).
Figure 4. PTEN loss in MCF10A cells promotes tissue growth and luminal filling in 3D culture but does not disrupt apical-basal polarity specification of matrix-attached cells.
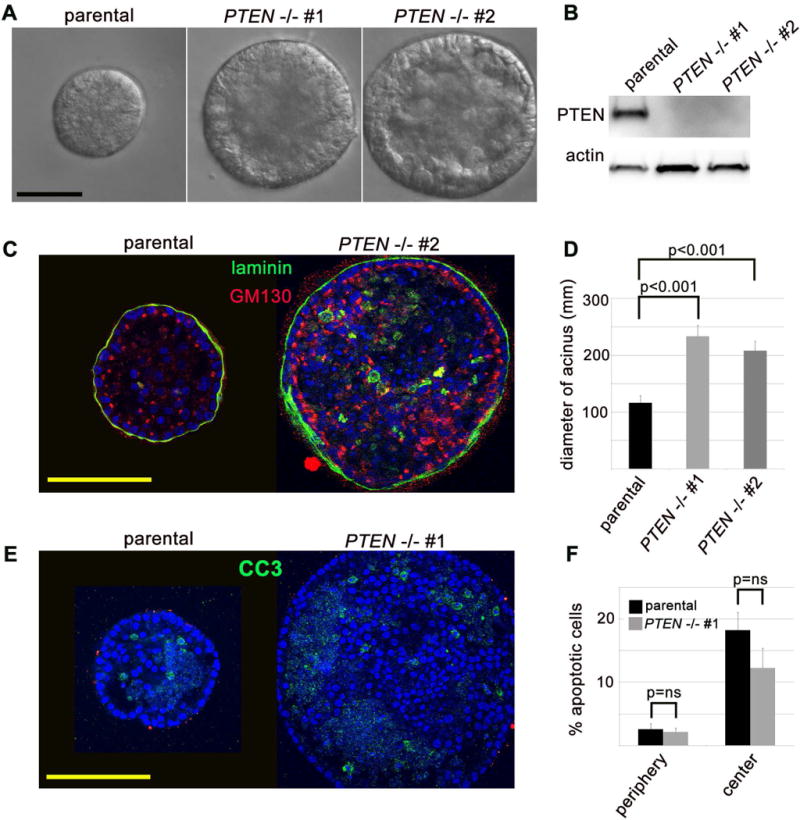
(A) PTEN−/− MCF10A cells form well-formed acinar structures in lamin-rich extracellular matrix (Matrigel), and are substantially larger than their wild-type counterparts. DIC imaging of day 18 acinar cultures. Scale bar = 100 μm. (B) Confirmation that MCF10A cells with PTEN deletion via somatic homologous recombination lack PTEN protein. Immunoblot from lysates of 2D monolayer cultures of each respective clone. (C) Matrix-attached MCF10A cells with PTEN deletion show appropriate apical-basal polarity specification in Matrigel cultures. Confocal imaging of immunofluorescent labeling for human-specific laminin (green) and golgi marker GM130 (red). Scale bar = 100 μm. (D) Quantification of average acinar diameter (mean and SEM for acinar diameter from one representative experiment). (E) Non-matrix attached luminal cells undergo apoptosis in parental and PTEN−/− MCF10A acini. Confocal imaging of immunofluorescent labeling for cleaved caspase 3 (CC3, green). Scale bar = 100 μm. (F) Quantification of peripheral (matrix-attached) and central (non-matrix attached) CC3-positive apoptotic cells (mean and SEM from one representative experiment).
mTORC1 signaling restrains epithelial cell invasion and inhibits full PI3K activation in PTEN-null MCF10A acini
We observed that the PTEN-null cells developed transient cytoplasmic protrusions into the Matrigel extracellular matrix (ECM) at a rate far higher than that seen in the wild-type parental clone (Supplementary Figure S4). In collagen-Matrigel mixtures, similar protrusions were formed specifically by the PTEN−/− acini at day 3 of culture. These protrusions were F-actin-rich and invaded into the surrounding ECM, beyond the basally deposited laminin layer (Figure 5A, 5B). Additionally, smaller actin-rich projections were evident around the periphery of the forming PTEN−/− acini, and these were not apparent in the parental clone (Figure 5A). However, even in collagen-Matrigel mixtures, invasive cytoplasmic protrusions were relatively rare (occurring in less than 10% of PTEN−/− acini, Figure 5C) and frequently unstable, regressing and reforming rapidly when viewed by time-lapse DIC imaging (Figure 5D, Supplementary Movie 2B).
Figure 5. mTORC1 signaling restrains epithelial cell invasion and inhibits full PI3K activation inPTEN-null MCF10A acini.
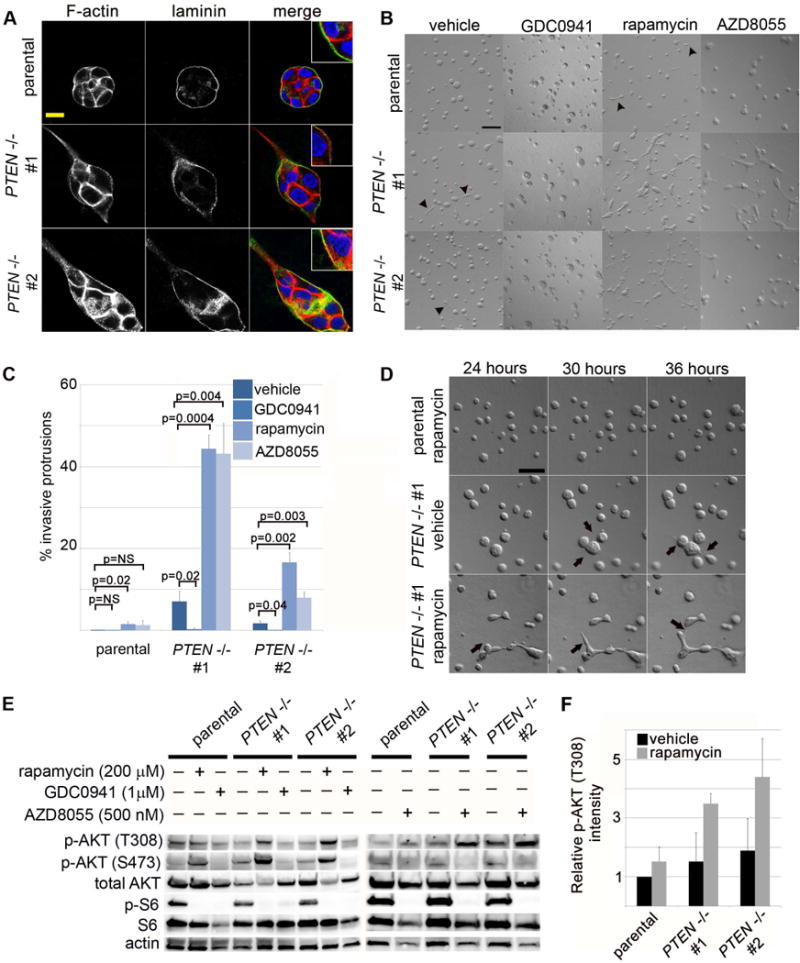
(A) PTEN−/− cells produce transient cytoplasmic protrusions into collagen/Matrigel extracellular matrix (ECM) mixtures. Confocal imaging of immunofluorescent labeling for F-actin (phalloidin, red) and human specific laminin (green) in day 2 cultures. Inset shows high magnification view. Scale bar = 10 μm. (B) Inhibition of PI3K reduces invasive protrusions in PTEN−/− clones, while inhibition of mTORC1 or mTORC1/2 dramatically increases and stabilizes epithelial invasive structures specifically in PTEN−/− cells. Differential interference contrast (DIC) imaging of day 3 cultures treated with vehicle, GDC0941 (PI3K inhibitor, 1 μM), rapamycin (mTORC1 inhibitor, 200 nM) or AZD8055 (mTORC1/C2 inhibitor, 500 nM) highlights epithelial invasive protrusions (arrowheads). Scale bar = 100 μm. (C) Quantification of invasive protrusions at day 3 of culture with PI3K or mTOR inhibitors (represents mean and standard error for 3 independent experiments/condition). (D) Invasive protrusions are stabilized by mTORC1 inhibition in PTEN−/− MCF10 acini. Timelapse DIC imaging of parental or PTEN−/− acini beginning at 24 hours after plating highlights dynamic formation of invasive cytoplasmic protrusions (arrows). Scale bar = 100 μm. (E) mTORC1 inhibition elevates PI3K activity in PTEN−/− clones. Immunoblotting of 3D acinar lysates after 18 hours of drug treatment. (F) Quantification of p-AKT (T308) levels from immunoblotting experiments (represents mean and SEM of 3 independent experiments).
Because PI3K inhibitors suppressed epithelial invasion in murine organotypic cultures, we next asked whether PI3K activity was necessary for invasive protrusion in PTEN−/− MCF10A acini. Treatment of cells with GDC0941 (PI3K inhibitor), markedly reduced protrusions in PTEN−/− acini, suggesting that PI3K activity is also required to induce invasion in this system (Figure 5B, 5C). Remarkably, treatment with either rapamycin (mTORC1 inhibitor), AZD8055 or Torin1 (mTORC1/ mTORC2 inhibitor) dramatically increased acinar invasion specifically in the PTEN−/− clones, with only a minimal effect on the parental wild-type cells (Figure 5B, 5C, data not shown). Time-lapse DIC imaging revealed that rapamycin stabilized the otherwise transient invasive cytoplasmic protrusions and promoted their growth into cords and branches of cells, ramifying into an interconnected ductal network that was never seen in parental wild-type cells treated with the same drug (Figure 5D, Supplementary Movies 2A, 2C).
At the signal transduction level, rapamycin or AZD8055 treatment markedly increased upstream PI3K signaling (as indicated by p-AKT[T308] levels), more dramatically in the PTEN−/− clones than in the wild-type cells (Figure 5E, 5F). Interestingly, basal p-AKT (T308) levels appeared constitutively suppressed in the vehicle-treated PTEN−/− clones, such that differences in p-AKT (T308) were not readily apparent between the PTEN−/− and wild-type clones until rapamycin or AZD8055 was added. This contrasted with p-AKT (S473) (a marker of mTORC2 activity) which was more consistently elevated in vehicle-treated PTEN−/− clones, and which was increased even further by treatment with rapamycin, but suppressed as expected by AZD8055 (Figure 5E). In order to examine the effects of a combined PI3K/mTOR inhibitor, we also tested BEZ235 in the MCF10A system. Interestingly, we found BEZ235 to be indistinguishable from pure mTOR kinase inhibitors, since it suppressed p-AKT (S473) levels but increased p-AKT (T308) levels and induced epithelial invasion, particularly in PTEN−/− clones (Supplementary Figure S5). Thus, as in murine organotypic cultures, PI3K activity is required for epithelial invasion, while mTORC1 activity is dispensable. In both systems, mTORC1 inhibition relieves constitutive suppression of PI3K activity in PTEN−/− cells, and the resultant increase in PI3K activity correlates with a striking increase in epithelial invasion in this setting.
mTORC1 signaling downstream of PTEN loss feeds back to inhibit upstream c-SRC and EGFR kinase activation
To test whether HER signaling might be required for rapamycin-induced mammary epithelial invasion in the setting of PTEN loss, we omitted EGF from the basal MCF10A cell culture media and examined the effects on PTEN−/− clones which are EGF-independent (6) (Figure 6A). Strikingly, epithelial invasion in rapamycin-treated PTEN−/− cells was entirely dependent on EGF stimulation. This suggested the possibility that mTORC1 inhibition in PTEN−/− cells may boost PI3K activity via relief of negative feedback to upstream HER kinase activity. Accordingly, we took advantage of receptor tyrosine kinase (RTK) signaling arrays to screen for changes in tyrosine phosphorylation after treatment with mTOR inhibitors (Figure 6B). Treatment with either rapamycin or AZD8055 resulted in increased tyrosine phosphorylation of c-SRC in PTEN−/− cells, with smaller increases in wild-type parental clones. Treatment with AZD8055 also led to markedly increased phosphorylation of STAT3 in PTEN−/− clones, consistent with reports that c-SRC potently activates STAT3 signaling (37). Additionally, increased phosphorylation of EGFR and IGF-IR was present, though subtle, in PTEN−/− cells treated with rapamycin or AZD8055 when visualized on the RTK arrays.
Figure 6. mTORC1 signaling downstream ofPTENloss feeds back to inhibit upstream c-SRC and EGFR activity.
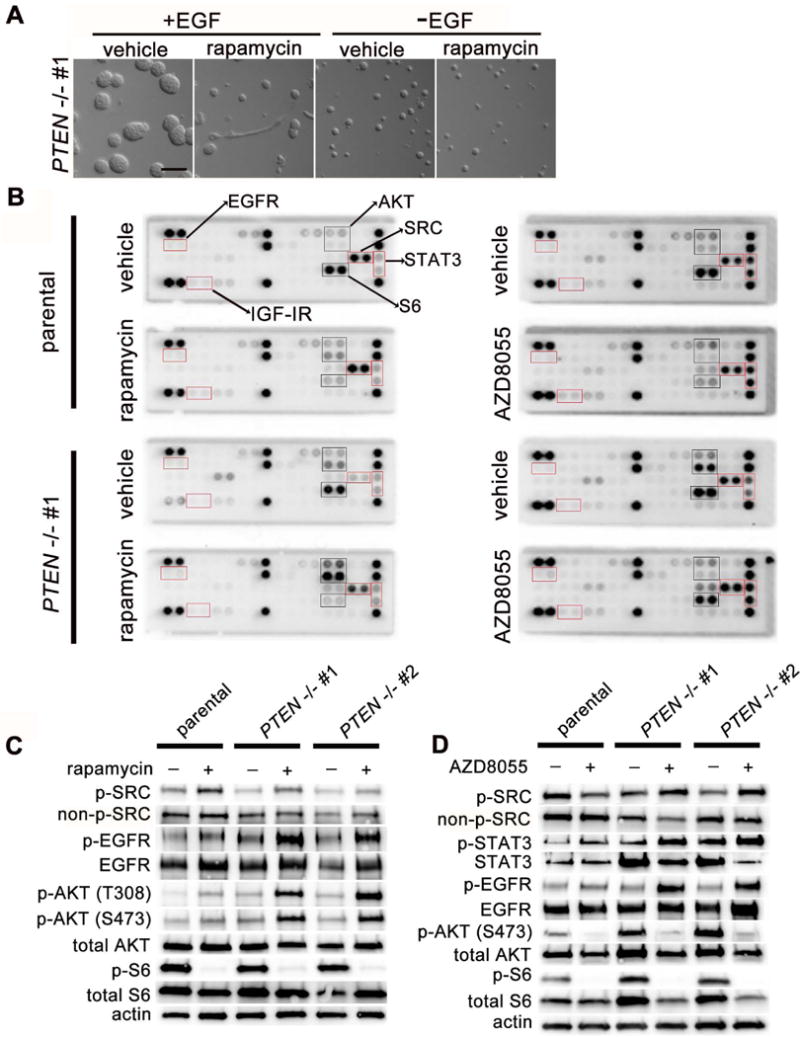
(A) Invasive MCF10A protrusions are EGF-dependent. DIC imaging of PTEN−/− clone #1 at day 3 of culture in the presence usual cell culture media (+EGF) or cell culture media without EGF (-EGF), with and without rapamycin (200 nM) treatment to induce invasive protrusions. Scale bar = 100 μm. (B) mTORC1 inhibitors increase p-SRC and p-EGFR levels, most consistently in PTEN-null clones. Receptor tyrosine kinase (RTK) signaling arrays for rapamycin- (200 nM) and AZD8055- (500 nM) treated MCF10A 2D monolayer lysates after culture with specified drug for 18 hours. (C) Confirmatory immunoblotting of cell lysates from 2D monolayer cultures after rapamycin and (D) AZD8055 treatment. Representative immunoblots are shown from 3–5 independent experiments for each drug.
To confirm these findings, we performed immunoblotting of PTEN+/+ and PTEN−/− MCF10A lysates treated with either rapamycin or AZD8055. Basal p-SRC levels were consistently mildly suppressed in PTEN−/− cells compared to parental wild-type cells, (Figure 6C, 6D) and treatment with either mTOR inhibitor markedly upregulated SRC Y416 phosphorylation consistently in the context of PTEN loss (Figure 6C, 6D). Additionally, treatment with either inhibitor increased EGFR autophosphorylation. Total levels of EGFR were inconsistently increased following rapamycin treatment as well. Again, this activation was more prominent in PTEN−/− cells, although in contrast to SRC, basal EGFR activation was not appreciably decreased with PTEN loss. No consistent changes were seen in phospho- or total HER2 or HER3 levels in response to mTOR inhibitor treatment (data not shown). Taken together, these data indicate that mTOR inhibition in PTEN−/− cells activates upstream c-SRC and EGFR signaling and is associated with increased PI3K activity and acinar invasion.
Simultaneous inhibition of PI3K, SRC or EGFR/HER2 signaling is sufficient to repress epithelial invasion in rapamycin-treated PTEN-null acini
We next asked whether feedback activation of EGFR, PI3K and SRC following mTORC1 inhibition was required for invasive cell behavior. Simultaneous treatment with GDC0941 (a PI3K inhibitor) and rapamycin eliminated PI3K activation and acinar invasion in PTEN−/− cells (Figure 7) confirming the requirement for PI3K signaling. Similarly, treatment with lapatinib (a dual EGFR/HER2 inhibitor) (Figure 7A, 7B) or erlotinib (an EGFR inhibitor, data not shown) resulted in a marked reduction in epithelial invasion in rapamycin-treated PTEN−/− clones. Lapatinib markedly reduced p-EGFR levels and p-SRC levels, in addition to eliminating the increase in p-AKT seen with rapamycin treatment alone (Figure 7C), suggesting that the SRC activation in rapamycin-treated PTEN−/− cells occurs downstream of HER signaling. Finally, concurrent treatment with dasatinib (a SRC family kinase inhibitor) also suppressed epithelial invasion in rapamycin-treated PTEN−/− acini (Figure 7A, 7B). In contrast to lapatinib, dasatinib did not abrogate the rapamycin-induced increase in PI3K activity as reflected by p-AKT (T308) (Figure 7D). Interestingly, we found that constitutive SRC activation in wild-type MCF10A cells was sufficient to induce both PI3K activation and epithelial invasion (Supplementary Figure S6). Taken together, these data suggest mTORC1 inhibition releases negative feedback to EGFR signaling, triggering a marked increase in downstream PI3K and SRC activity in PTEN−/− cells, both of which are required to induce mammary epithelial invasion.
Discussion
Receptor tyrosine kinase (RTK) signaling pathways are subject to tight feedback regulation
With the advent of potent and specific mTOR inhibitors, there has been an increasing interest in the role of mTORC1 signaling in the down-regulation of upstream PI3K activation and its relevance for tumor drug resistance (15). Solid tumors have been largely resistant to rapalog monotherapy, and many show increased PI3K and MAPK activity following mTORC1 inhibition (12, 38). Early studies conducted predominantly in MEFs pinpointed S6K activity downstream of mTORC1 activation as responsible for this negative feedback via destabilization of IRS docking proteins and inhibition of insulin receptor/insulin growth factor receptor (IR/IGFR) signaling (9, 10). In addition to this early work in mesenchymal cells, recent work in epithelial cancer cell lines has also highlighted an important role for mTORC1-mediated inhibition of HER signaling. Studies of combined PI3K/mTOR inhibitors (BEZ235), PI3K inhibitors (XL147), AKT inhibitors (AKTi) and mTOR kinase inhibitors (AZD8055) in epithelial cancer cell lines have all demonstrated resistance that coincides with increased PI3K and MAPK activity and a corresponding increase in HER levels and activity, although the mechanisms involved have not been entirely worked out (18, 21–23, 39).
A common theme emerging from these data is that signaling feedback allows cells to maintain a remarkably highly regulated signaling network, even in the presence of apparently dysregulating mutations
(16). Accordingly, targeted therapeutics aimed at suppressing a specific oncogenic signaling event may have the paradoxical effect of unmasking upstream RTK activity. For example, oncogenic RAS desensitizes upstream HER signaling and relief of this negative feedback via depletion of oncogenic RAS has the paradoxical effect of hyperactivating EGFR and wild-type RAS (40). Similarly, BRAF(V600E) activating mutations suppress EGFR signaling (41, 42) and tumor types that respond to this signaling (colon cancers) are resistant to a BRAF-mutant-specific inhibitor in contrast to melanomas which express less EGFR (43). Thus understanding the role of signaling feedback in a specific genetic and cellular context is critical to the success of targeted therapeutics.
Our study is the first to demonstrate that the effects of mTOR-mediated feedback may be specifically modulated by PTEN status in the mammary epithelium
In fact, because PTEN loss results in net increased basal PI3K activity, the assumption has been that this genetic alteration may obviate any effects of signaling feedback (44). Here, quite to the contrary, we have shown here that mTORC1 activity plays a critical role in suppressing maximal PI3K signaling specifically in the setting of PTEN loss. Indeed, in PTEN-null MCF10A cells, p-AKT (T308) levels were not markedly elevated compared to wild-type cells until rapamycin was added, in large part because mTORC1 inhibition more dramatically increased p-AKT (T308) in the PTEN−/− cells (Figure 5F). These data suggest that even in the context of long term PTEN loss, mammary cells engage mTORC1-dependent homeostatic mechanisms to partially normalize PI3K activity.
One such potential mechanism is mTORC1-mediated feedback regulation of upstream RTK activity. In this model, mTORC1 inhibition boosts upstream RTK signaling, leading to increased PI3K recruitment, but in the wild-type setting, downstream PIP3 levels and AKT activation are largely held in check by intact PTEN activity. In PTEN−/− cells treated with mTORC1 inhibitors, the combination of elevated RTK activity and PTEN loss leads to unfettered PI3K activity, culminating in marked downstream AKT activation. Accordingly, in the MCF10A system, treatment of PTEN−/− cells with rapamycin or an mTOR kinase inhibitor resulted in marked SRC and EGFR phosphorylation, and correlated tightly with increased downstream effector activity, including p-AKT and p-STAT3. Further, pharmacologic blockade of EGFR/HER2 signaling restrained this rapamycin-induced EGFR/SRC/p-AKT activity.
However, in the context of PTEN loss, as in prior studies of HER2-expressing cancer cells, the precise molecular mechanism by which mTORC1 inhibition augments upstream EGFR signaling remains to be discovered
AKT inhibition has been reported to increase basal HER levels in cancer cells (via increased FOXO transcription) (21–23). However, FOXO-mediated transcription is likely decreased after mTORC1 inhibitor treatment due to signaling feedback which boosts AKT activity. Though we did observe a small (but not entirely consistent) increase in total EGFR in MCF10A cells following rapamycin treatment (Figure 6), the increase in p-EGFR was much more robust. Additionally, HER2 and HER3 total levels and phosphorylation were not affected by rapamycin treatment in the MCF10A system (Figure 6, data not shown). We are the first to report an increase in SRC activity with mTORC1 inhibitor treatment and intriguingly SRC phosphorylates and transactivates EGFR (45), raising the question of whether SRC activation may itself provide a potential mechanism for increased EGFR phosphorylation in the setting of mTORC1 inhibition. Indeed, at least one prior study has demonstrated that rapamycin treatment increases SRC phosphorylation and results in EGFR transactivation in the absence of growth factor (46). However, it appears that SRC is activated downstream of EGFR in the MCF10A system, as treatment with HER inhibitor lapatinib was sufficient to completely abolish SRC and PI3K activation in rapamycin-treated PTEN−/− cells. Similarly, although SRC is sufficient to activate PI3K signaling (as observed with inducible v-SRC expression, Supplementary Figure S6), SRC inhibition with dasatinib did not abolish feedback activation of EGFR or PI3K (Figure 7D, data not shown). Thus, in our model, mTORC1 inhibition releases negative feedback to upstream EGFR phosphorylation, resulting independently in increased downstream SRC activation and PI3K activation.
Perhaps the most novel finding in the current study is that mTORC1-mediated signaling feedback modulates cell behaviors, specifically in the context of PTEN loss
Until now, studies of negative feedback regulation of oncogenic signaling pathways have focused on the implications for signal transduction and proliferation in 2D cell line monolayers or xenografts (18, 21, 22). Here, in two independent 3D culture systems, we found that mTORC1 feedback is critical for restraining growth-factor induced mammary epithelial cell invasion in the setting of PTEN loss. It is important to note that the two benign model systems we used herein are quite divergent in terms of species derivation, differentiation and mode of cellular invasion employed. It does appear that the murine organoid system requires autocine/paracrine HER signaling for invasive budding downstream of FGF2 stimulation, providing an intriguing link between the HER-mediated suppression of invasion seen in the MCF10A system and the FGF2-dependent organoid system. However, the many distinctions between the two systems do likely underlie some of the important differences we observed; for example, PTEN loss by itself in the organoid system suppresses invasion, while a modest increase in invasive potential is seen in the MCF10A system. Despite these limitations, the similar effect of mTORC1-mediated feedback on PTEN−/− cell invasion in each is compelling: In the bilayered murine organotypic culture system, mTORC1 signaling was both necessary and sufficient to suppress non-protrusive, collective luminal epithelial invasion in response to FGF2. Similarly, in the MCF10A system with PTEN loss, mTORC1 inhibition potently induced protrusive, single cell epithelial invasion into the surrounding extracellular matrix in response to EGF stimulation. Ultimately, the similar findings in each system are suggestive of the potentially highly conserved role of mTORC1-mediated signaling feedback in modulating cell behavior.
Just as mTORC1-mediated feedback to upstream HER signaling regulates epithelial invasion in mammary epithelial cells, we found that mTORC1 also interfaces with hormone receptor signaling pathways
Somewhat surprisingly, we found that even short-term PTEN loss was sufficient to dramatically decrease nuclear ER levels and increase basal-type keratin expression in murine organotypic cultures, potentially inter-related differentiation events dependent on mTORC1 activation. Additionally, we found that in the absence of PTEN loss, mTORC1 signaling up-regulation via TSC1 loss was necessary and sufficient to repress nuclear ER levels. These findings are reminiscent of recent reports that PI3K/mTOR signaling can repress androgen receptor (AR) levels and signaling in PTEN-null murine and human prostate tissues (19, 20). Given our findings in the MCF10A system, it is of particular interest that PI3K/mTOR may mediate this feedback to AR in the prostate via downregulation of HER kinase signaling (19).
Ultimately, additional studies of the role of mTORC1 suppression in modulating hormone and growth factor receptor responsiveness in the specific setting of PTEN-null human tumors will be necessary to substantiate our findings
Although rapalogs have long been known to be ineffective as monotherapies in most settings, mTOR kinase inhibitors were originally proposed as potentially effective alternatives since simultaneous suppression of mTORC2 partially inactivates AKT, thus mitigating the effects of relief of PI3K signaling feedback (15). Here, we have shown that rapamycin and mTOR kinase inhibitors both relieve feedback to upstream tyrosine kinase activity resulting in downstream AKT activation, specifically in the setting of PTEN loss. These signaling effects are consistent with a recent cancer cell line study (18) and combined with our finding that this signaling correlates with increased epithelial invasion, suggest the novel possibility that mTOR kinase monotherapies may not only be ineffective, but potentially even detrimental in tumors with aberrantly activated PI3K signaling. Clearly, additional studies to directly address this hypothesis in malignant systems with PTEN loss are necessary and may further elucidate the importance of this critical signaling feedback pathway.
Supplementary Material
Acknowledgments
The authors wish to thank Andrew Ewald for advice and helpful discussions regarding the murine organoid system.
Financial Support: Funding for this research was provided in part by the Safeway Breast Cancer Research Fund at Johns Hopkins (TLL) and an HHMI Early Career Physician Scientist Award (TLL). Additionally, this research utilized core resources provided by an NCI CCSG grant (P30 CA006973).
Footnotes
Conflicts of Interest: None.
References
- 1.Wickenden JA, Watson CJ. Key signalling nodes in mammary gland development and cancer. signalling downstream of PI3 kinase in mammary epithelium: A play in 3 akts Breast. Cancer Res. 2010;12(2):202. doi: 10.1186/bcr2558. [DOI] [PMC free article] [PubMed] [Google Scholar]
- 2.Tan MH, Mester JL, Ngeow J, Rybicki LA, Orloff MS, Eng C. Lifetime cancer risks in individuals with germline PTEN mutations. Clin Cancer Res. 2012;18(2):400–7. doi: 10.1158/1078-0432.CCR-11-2283. [DOI] [PMC free article] [PubMed] [Google Scholar]
- 3.Yamada KM, Araki M. Tumor suppressor PTEN: Modulator of cell signaling, growth, migration and apoptosis. J Cell Sci. 2001;114(Pt 13):2375–82. doi: 10.1242/jcs.114.13.2375. [DOI] [PubMed] [Google Scholar]
- 4.Saal LH, Gruvberger-Saal SK, Persson C, et al. Recurrent gross mutations of the PTEN tumor suppressor gene in breast cancers with deficient DSB repair. Nat Genet. 2008;40(1):102–7. doi: 10.1038/ng.2007.39. [DOI] [PMC free article] [PubMed] [Google Scholar]
- 5.Shoman N, Klassen S, McFadden A, Bickis MG, Torlakovic E, Chibbar R. Reduced PTEN expression predicts relapse in patients with breast carcinoma treated by tamoxifen. Mod Pathol. 2005;18(2):250–9. doi: 10.1038/modpathol.3800296. [DOI] [PubMed] [Google Scholar]
- 6.Vitolo MI, Weiss MB, Szmacinski M, et al. Deletion of PTEN promotes tumorigenic signaling, resistance to anoikis, and altered response to chemotherapeutic agents in human mammary epithelial cells. Cancer Res. 2009;69(21):8275–83. doi: 10.1158/0008-5472.CAN-09-1067. [DOI] [PMC free article] [PubMed] [Google Scholar]
- 7.Nagata Y, Lan KH, Zhou X, et al. PTEN activation contributes to tumor inhibition by trastuzumab, and loss of PTEN predicts trastuzumab resistance in patients. Cancer Cell. 2004;6(2):117–27. doi: 10.1016/j.ccr.2004.06.022. [DOI] [PubMed] [Google Scholar]
- 8.Berns K, Horlings HM, Hennessy BT, et al. A functional genetic approach identifies the PI3K pathway as a major determinant of trastuzumab resistance in breast cancer. Cancer Cell. 2007;12(4):395–402. doi: 10.1016/j.ccr.2007.08.030. [DOI] [PubMed] [Google Scholar]
- 9.Shah OJ, Wang Z, Hunter T. Inappropriate activation of the TSC/Rheb/mTOR/S6K cassette induces IRS1/2 depletion, insulin resistance, and cell survival deficiencies. Curr Biol. 2004;14(18):1650–6. doi: 10.1016/j.cub.2004.08.026. [DOI] [PubMed] [Google Scholar]
- 10.Harrington LS, Findlay GM, Gray A, et al. The TSC1-2 tumor suppressor controls insulin-PI3K signaling via regulation of IRS proteins. J Cell Biol. 2004;166(2):213–23. doi: 10.1083/jcb.200403069. [DOI] [PMC free article] [PubMed] [Google Scholar]
- 11.Zhang H, Bajraszewski N, Wu E, et al. PDGFRs are critical for PI3K/Akt activation and negatively regulated by mTOR. J Clin Invest. 2007;117(3):730–8. doi: 10.1172/JCI28984. [DOI] [PMC free article] [PubMed] [Google Scholar]
- 12.Carracedo A, Ma L, Teruya-Feldstein J, et al. Inhibition of mTORC1 leads to MAPK pathway activation through a PI3K-dependent feedback loop in human cancer. J Clin Invest. 2008;118(9):3065–74. doi: 10.1172/JCI34739. [DOI] [PMC free article] [PubMed] [Google Scholar]
- 13.Hsu PP, Kang SA, Rameseder J, et al. The mTOR-regulated phosphoproteome reveals a mechanism of mTORC1-mediated inhibition of growth factor signaling. Science. 2011;332(6035):1317–22. doi: 10.1126/science.1199498. [DOI] [PMC free article] [PubMed] [Google Scholar]
- 14.Yu Y, Yoon SO, Poulogiannis G, et al. Phosphoproteomic analysis identifies Grb10 as an mTORC1 substrate that negatively regulates insulin signaling. Science. 2011;332(6035):1322–6. doi: 10.1126/science.1199484. [DOI] [PMC free article] [PubMed] [Google Scholar]
- 15.Guertin DA, Sabatini DM. Defining the role of mTOR in cancer. Cancer Cell. 2007;12(1):9–22. doi: 10.1016/j.ccr.2007.05.008. [DOI] [PubMed] [Google Scholar]
- 16.Chandarlapaty S. Negative feedback and adaptive resistance to the targeted therapy of cancer. Cancer Discov. 2012;2(4):311–9. doi: 10.1158/2159-8290.CD-12-0018. [DOI] [PMC free article] [PubMed] [Google Scholar]
- 17.O’Reilly KE, Rojo F, She QB, et al. mTOR inhibition induces upstream receptor tyrosine kinase signaling and activates akt. Cancer Res. 2006;66(3):1500–8. doi: 10.1158/0008-5472.CAN-05-2925. [DOI] [PMC free article] [PubMed] [Google Scholar]
- 18.Rodrik-Outmezguine VS, Chandarlapaty S, Pagano NC, et al. mTOR kinase inhibition causes feedback-dependent biphasic regulation of AKT signaling. Cancer Discov. 2011;1(3):248–59. doi: 10.1158/2159-8290.CD-11-0085. [DOI] [PMC free article] [PubMed] [Google Scholar]
- 19.Carver BS, Chapinski C, Wongvipat J, et al. Reciprocal feedback regulation of PI3K and androgen receptor signaling in PTEN-deficient prostate cancer. Cancer Cell. 2011;19(5):575–86. doi: 10.1016/j.ccr.2011.04.008. [DOI] [PMC free article] [PubMed] [Google Scholar]
- 20.Mulholland DJ, Tran LM, Li Y, et al. Cell autonomous role of PTEN in regulating castration-resistant prostate cancer growth. Cancer Cell. 2011;19(6):792–804. doi: 10.1016/j.ccr.2011.05.006. [DOI] [PMC free article] [PubMed] [Google Scholar]
- 21.Serra V, Scaltriti M, Prudkin L, et al. PI3K inhibition results in enhanced HER signaling and acquired ERK dependency in HER2-overexpressing breast cancer. Oncogene. 2011;30(22):2547–57. doi: 10.1038/onc.2010.626. [DOI] [PMC free article] [PubMed] [Google Scholar]
- 22.Chandarlapaty S, Sawai A, Scaltriti M, et al. AKT inhibition relieves feedback suppression of receptor tyrosine kinase expression and activity. Cancer Cell. 2011;19(1):58–71. doi: 10.1016/j.ccr.2010.10.031. [DOI] [PMC free article] [PubMed] [Google Scholar]
- 23.Muranen T, Selfors LM, Worster DT, et al. Inhibition of PI3K/mTOR leads to adaptive resistance in matrix-attached cancer cells. Cancer Cell. 2012;21(2):227–39. doi: 10.1016/j.ccr.2011.12.024. [DOI] [PMC free article] [PubMed] [Google Scholar]
- 24.Badea TC, Wang Y, Nathans J. A noninvasive genetic/pharmacologic strategy for visualizing cell morphology and clonal relationships in the mouse. J Neurosci. 2003;23(6):2314–22. doi: 10.1523/JNEUROSCI.23-06-02314.2003. [DOI] [PMC free article] [PubMed] [Google Scholar]
- 25.Lesche R, Groszer M, Gao J, et al. Cre/loxP-mediated inactivation of the murine pten tumor suppressor gene. Genesis. 2002;32(2):148–9. doi: 10.1002/gene.10036. [DOI] [PubMed] [Google Scholar]
- 26.Muzumdar MD, Tasic B, Miyamichi K, Li L, Luo L. A global double-fluorescent cre reporter mouse. Genesis. 2007;45(9):593–605. doi: 10.1002/dvg.20335. [DOI] [PubMed] [Google Scholar]
- 27.Ghosh S, Lau H, Simons BW, et al. PI3K/mTOR signaling regulates prostatic branching morphogenesis. Dev Biol. 2011;360(2):329–42. doi: 10.1016/j.ydbio.2011.09.027. [DOI] [PMC free article] [PubMed] [Google Scholar]
- 28.Kwiatkowski DJ, Zhang H, Bandura JL, et al. A mouse model of TSC1 reveals sex-dependent lethality from liver hemangiomas, and up-regulation of p70S6 kinase activity in Tsc1 null cells. Hum Mol Genet. 2002;11(5):525–34. doi: 10.1093/hmg/11.5.525. [DOI] [PubMed] [Google Scholar]
- 29.Ewald AJ, Brenot A, Duong M, Chan BS, Werb Z. Collective epithelial migration and cell rearrangements drive mammary branching morphogenesis. Dev Cell. 2008;14(4):570–81. doi: 10.1016/j.devcel.2008.03.003. [DOI] [PMC free article] [PubMed] [Google Scholar]
- 30.Vitolo MI, Weiss MB, Szmacinski M, et al. Deletion of PTEN promotes tumorigenic signaling, resistance to anoikis, and altered response to chemotherapeutic agents in human mammary epithelial cells. Cancer Res. 2009;69(21):8275–83. doi: 10.1158/0008-5472.CAN-09-1067. [DOI] [PMC free article] [PubMed] [Google Scholar]
- 31.Debnath J, Muthuswamy SK, Brugge JS. Morphogenesis and oncogenesis of MCF-10A mammary epithelial acini grown in three-dimensional basement membrane cultures. Methods. 2003;30(3):256–68. doi: 10.1016/s1046-2023(03)00032-x. [DOI] [PubMed] [Google Scholar]
- 32.Zhan L, Xiang B, Muthuswamy SK. Controlled activation of ErbB1/ErbB2 heterodimers promote invasion of three-dimensional organized epithelia in an ErbB1-dependent manner: Implications for progression of ErbB2-overexpressing tumors. Cancer Res. 2006;66(10):5201–8. doi: 10.1158/0008-5472.CAN-05-4081. [DOI] [PubMed] [Google Scholar]
- 33.Iliopoulos D, Hirsch HA, Struhl K. An epigenetic switch involving NF-kappaB, Lin28, let-7 MicroRNA, and IL6 links inflammation to cell transformation. Cell. 2009;139(4):693–706. doi: 10.1016/j.cell.2009.10.014. [DOI] [PMC free article] [PubMed] [Google Scholar]
- 34.Sternlicht MD, Sunnarborg SW, Kouros-Mehr H, Yu Y, Lee DC, Werb Z. Mammary ductal morphogenesis requires paracrine activation of stromal EGFR via ADAM17-dependent shedding of epithelial amphiregulin. Development. 2005;132(17):3923–33. doi: 10.1242/dev.01966. [DOI] [PMC free article] [PubMed] [Google Scholar]
- 35.Maretzky T, Evers A, Zhou W, et al. Migration of growth factor-stimulated epithelial and endothelial cells depends on EGFR transactivation by ADAM17. Nat Commun. 2011;2:229. doi: 10.1038/ncomms1232. [DOI] [PMC free article] [PubMed] [Google Scholar]
- 36.Martin-Belmonte F, Gassama A, Datta A, et al. PTEN-mediated apical segregation of phosphoinositides controls epithelial morphogenesis through Cdc42. Cell. 2007;128(2):383–97. doi: 10.1016/j.cell.2006.11.051. [DOI] [PMC free article] [PubMed] [Google Scholar]
- 37.Silva CM. Role of STATs as downstream signal transducers in src family kinase-mediated tumorigenesis. Oncogene. 2004;23(48):8017–23. doi: 10.1038/sj.onc.1208159. [DOI] [PubMed] [Google Scholar]
- 38.Cloughesy TF, Yoshimoto K, Nghiemphu P, et al. Antitumor activity of rapamycin in a phase I trial for patients with recurrent PTEN-deficient glioblastoma. PLoS Med. 2008;5(1):e8. doi: 10.1371/journal.pmed.0050008. [DOI] [PMC free article] [PubMed] [Google Scholar]
- 39.Chakrabarty A, Sanchez V, Kuba MG, Rinehart C, Arteaga CL. Feedback upregulation of HER3 (ErbB3) expression and activity attenuates antitumor effect of PI3K inhibitors. Proc Natl Acad Sci U S A. 2012;109(8):2718–23. doi: 10.1073/pnas.1018001108. [DOI] [PMC free article] [PubMed] [Google Scholar]
- 40.Young A, Lou D, McCormick F. Oncogenic and wild-type ras play divergent roles in the regulation of mitogen-activated protein kinase signaling. Cancer Discov. 2012 doi: 10.1158/2159-8290.CD-12-0231. [DOI] [PubMed] [Google Scholar]
- 41.Prahallad A, Sun C, Huang S, et al. Unresponsiveness of colon cancer to BRAF(V600E) inhibition through feedback activation of EGFR. Nature. 2012;483(7387):100–3. doi: 10.1038/nature10868. [DOI] [PubMed] [Google Scholar]
- 42.Corcoran RB, Ebi H, Turke AB, et al. EGFR-mediated re-activation of MAPK signaling contributes to insensitivity of BRAF mutant colorectal cancers to RAF inhibition with vemurafenib. Cancer Discov. 2012;2(3):227–35. doi: 10.1158/2159-8290.CD-11-0341. [DOI] [PMC free article] [PubMed] [Google Scholar]
- 43.Stites EC. The response of cancers to BRAF inhibition underscores the importance of cancer systems biology. Sci Signal. 2012;5(246):pe46. doi: 10.1126/scisignal.2003354. [DOI] [PubMed] [Google Scholar]
- 44.Manning BD, Logsdon MN, Lipovsky AI, Abbott D, Kwiatkowski DJ, Cantley LC. Feedback inhibition of akt signaling limits the growth of tumors lacking Tsc2. Genes Dev. 2005;19(15):1773–8. doi: 10.1101/gad.1314605. [DOI] [PMC free article] [PubMed] [Google Scholar]
- 45.Kim LC, Song L, Haura EB. Src kinases as therapeutic targets for cancer. Nat Rev Clin Oncol. 2009;6(10):587–95. doi: 10.1038/nrclinonc.2009.129. [DOI] [PubMed] [Google Scholar]
- 46.Chaturvedi D, Gao X, Cohen MS, Taunton J, Patel TB. Rapamycin induces transactivation of the EGFR and increases cell survival. Oncogene. 2009;28(9):1187–96. doi: 10.1038/onc.2008.490. [DOI] [PMC free article] [PubMed] [Google Scholar]
Associated Data
This section collects any data citations, data availability statements, or supplementary materials included in this article.