Abstract
Background & objective
Malaria resurgence in highland regions of East Africa has been on increase. The spatio-temporal distribution of larval habitats of malaria vectors determines the distribution of adult vectors, hence, disease transmission. Vector’s ecology is necessary for strategic vector control through effective plan for source reduction. Mapping of the larval habitats is necessary for targeted control measures. The purpose of this study is to assess and compare the spatial and seasonal variations in anopheline larval habitats in Western Kenya.
Methods
A comparative study was conducted on spatial distribution of GPS geo-located anopheline larval habitats in relation to highland and lowland environments. Land use types were categorized and all potential aquatic habitats of malaria vectors were examined in February, May, August and November 2004. Data analyses were performed using SAS JMP software.
Results & discussion
Results showed a higher percentage of Anopheles gambiae s.s. (70.9%) than An. Funestus (29.1%) in highland. In the lowland, An. gambiae s.l. comprised 60.1% while An. funestus represented 39.9%. The distribution of larval breeding is confined to the valley bottom in the highland while it was dispersed in the lowland. Land use type influenced the occurrence of positive breeding habitats in the highland. In the lowland, distribution was due to seasonality. We found high proportion of potential and positive breeding sites in cultivated swamps and farmlands at the highland site. These results suggest that swamp cultivation increases the availability and suitability of larval breeding habitats of malaria vectors, thus malaria transmission in the Western Kenya highlands environment.
Keywords: Habitats, land use change, malaria vector
INTRODUCTION
Highland regions of Africa initially considered malaria-free until the last two decades have experienced episodes of malaria epidemics1-6, that are reported to have spread from 3 to 15 districts in Western Kenya within the last few years. These epidemics have caused high morbidity and mortality7,8, that is of immense concern. Indeed, highland communities lack functional immunity9,10, thus, are more vulnerable to malaria infection unlike their lowland endemic region counterparts. Health facilities have not been sufficient to cope up with the epidemics because of different reasons that include: their sudden strike that takes off-guard medical planners; human population in the region has increased rapidly11,12 since family planning has not been fully embraced; drug and personnel short-age. Several hypotheses proposed to explain the increased malaria transmission in the highlands include: global climate change, demographic patterns, land use change and drug resistance13-18. Anopheles gambiae Giles, An. arabiensis Patton and An. funestus Giles are the primary vectors of human malaria in sub-Saharan Africa. Coetzee19 observed that An. gambiae complex members were sympatric. There have been reports where An. gambiae sensu stricto has been observed in the highland regions with high precipitation. It is characteristic of small temporary open sun-lit pools20-22. Anopheles arabiensis is mainly found in low-lying arid areas19,23,24. Anopheles funestus is determined by the presence of permanent breeding habitats and seasonality23. This implies that malaria transmission is likely to occur throughout the year and hence control strategies should be put in place especially at the time when the risk of transmission is highest. A good understanding of the fluctuations in adult population of vectors is in part determined by factors that affect larval abundance. Larval habitats are an important determinant for adult abundance and distribution.
Lowland areas have stable and endemic malaria. Due to low elevation, with most of the surface almost flat, water accumulates on the ground surface especially in the flood plains, man-made or natural pools, man and animal footprints on farms that provide breeding sites for An. gambiae s.l. This vector species, an r-strategist, breeds very fast, thus, population increases rapidly within a short time. In the highland region, on the other hand, the topography is undulating sometimes with many valleys and plateau. The soils are well-drained thus water does not accumulate easily in pools unless directed. Due to pressure on land for agricultural production and human settlement, wetlands (natural swamps) have been drained for crop production. Studies by Lindblade16 in a Ugandan highland area suggest that cultivation of natural swamps increase malaria transmission. In the same study, the maximum and minimum temperatures were higher in the cultivated swamps than the natural swamps. Minakawa25 found significant association between occurrence of An. gambiae s.s. larvae and habitat size and vegetation type in a highland area of Western Kenya. The same study revealed that warmer daytime temperatures characterized larval habitats for An. gambiae s.s. These studies suggest that in the highland area, the cultivation of natural swamps increase the mi-crohabitat temperature, which in turn shortens the development time for the vector mosquitoes. This has profound effect on the adult population density because more generations will be attained in a shorter time. A change in land use may lead to microclimate change that may cause local malaria upsurge.
In the past, most control measures have been directed at the adult stages. But source reduction through modification of larval habitats was the key to malaria eradication in the United States, Israel and Italy26. For any effective control through source reduction, an understanding of the dynamics of the larval habitats is required if efforts to model and predict adult abundance has to succeed. The purpose of this study is to assess and compare the spatial and seasonal variations in anopheline larval habitats in both the lowland and highland sites of Western Kenya.
MATERIAL & METHODS
Study sites
The study was conducted at two sites: Marani and Kombewa. Marani is a highland area that suffered from malaria epidemics. It is located at 34°48’ east and 0°35’ south in Kisii county, Western Kenya, on undulating land, 17 km northeast of Kisii town (Fig. 1). The altitude ranges from 1508 to 1703 m. This highland is drained by several permanent rivers and streams and is characterized by the presence of springs during the long rainy season. The study area is 16 km2 wide. It is characterized by a high population density and has undergone land-use changes that occurred over a long period of time. The major land-use changes include: conversion of forest land to crop-farming mainly tea growing; conversion of grassland into sugarcane or maize farms; draining of natural swamps and settlement in the former natural forests and grassland areas. Plantations of Eucalyptus forests are located along river valleys for timber production. The main farming activities include maize, millet, banana, tea and coffee, vegetable growing and dairy farming. The area has two rainy seasons (April–July and August–October) that are not well-defined and one dry (November–February) season. The annual rainfall is about 2538 mm while the mean maximum, mean average and mean minimum temperatures are 26.7, 19.8 and 14.4°C respectively.
Fig. 1.
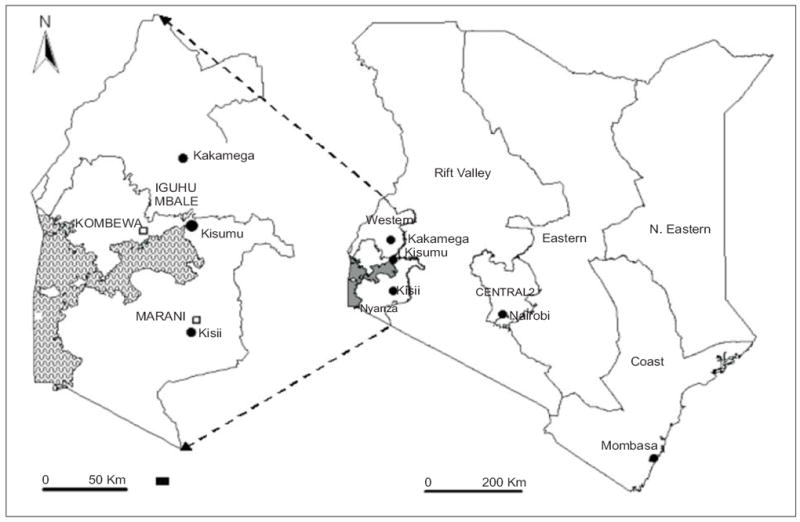
Map showing the study sites.
Kombewa study site is lowland where malaria is holoendemic. It is located at 34°30’ east and 0° 07’ south in Kisumu county, about 30 km from Kisumu town. The altitude ranges between 1100 and 1200 m. It covers 16 km2 and population is lower than in the Marani highland. The main farming activities are maize, mango and sorghum and animal husbandry. The area has one permanent and several seasonal rivers. Kombewa has two rainy (April–July and August–October) seasons and one dry (November–February) season. The annual rainfall is about 1200 mm; the mean minimum, mean average and mean maximum temperatures are 18.5, 29.3 and 35°C respectively.
Weather data
Weather stations had been set up at both Kombewa and Marani for collecting daily minimum and maximum temperatures, relative humidity and rainfall. The average monthly temperature, maximum and minimum had been calculated. The amount of rainfall was estimated as the sum of daily rainfall.
Land use types
Different land use types of the study areas had been categorized as: farmland referring to area under cultivation; cultivated swamp corresponding to reclaimed land under cultivation; pasture that is characterized by the presence of grass or shrubs for animal grazing; swamp, land characterized by water logging; road; river referring to river bank and forest that is an area with either indigenous or exotic tree stands with >75% of canopy cover. Larval breeding habitats include drainage ditches, foot prints (human and animal foot prints), man-made pools, tyre tracks, natural pools, roadside ditches and rock pools.
Larval sampling
Both the study sites were surveyed and all potential aquatic habitats were geo-located using a Trimble GPS (Trimble Inc.) connected to iPAQ PDA (IPAQ Inc.). Malaria vectors were examined. For this purpose, a sample of 40 dips (maximum, depending on the amount of water) was collected from each potential breeding habitat using a standard 350 ml plastic dipper. The presence or absence of anopheline larvae was noted and if no larva was present, the habitat was considered negative. Samples of mosquito larvae and pupae were collected27. The larvae were counted, put in vials and taken to the laboratory where they were identified morphologically to species level using the microscope according to Gilles and De Meillon28. The following environmental variables were recorded: length and width of the habitat, land use type, habitat type, height above the sea level and coordinates. The distance to the nearest river was calculated using the Geographical Information System (GIS), particularly ArcGIS 9.3.1 (ESRI, Inc). Anopheles gambiae s.l. and An. funestus larvae were further identified using polymerase chain reaction (PCR)29. The samples were collected during the months of February (dry season), May (long rainy season), August (short rainy season), and November (dry season) 2004 at both the study sites.
Data analysis
JMP SAS software (SAS Institute Inc.) was used for data analysis. The statistical distribution of data was determined and the natural log transformation was applied, in case the data were not normally distributed. Yates Chi-square test was performed to determine the occurrence of anopheline larvae in different land use/land cover types over different sampling periods and same land use/land cover type. Generalized linear model was used to identify the variables associated with the occurrence (presence or absence) of An. gambiae larvae during the sampling months at both the study sites. The effect of seasonality was determined through an ANOVA test done using generalized linear model for dry and long rain seasons at both Kombewa and Marani. The occurrence of malaria vectors was used as a dependent variable. The multiple comparisons using Tukey-Kramer tests were performed to determine statistical differences in proportions of positive breeding habitats between different land use/land cover types for the same month (season). However, the comparisons were not done in cases where the sample size was 10 and below. The distance of each larval habitat from the nearest river/stream was estimated using ArcGIS 9.3.1 (ESRI, Inc). The t-test was carried out to determine association between anopheline occurrence and elevation, distance from the nearest river /stream and surface area. In case of distance, Chi-square test was further performed to determine the critical distance at which the aggregation of positive larval habitats occurred from the nearest river/stream. The statistical significance was at 0.05 level.
RESULTS
Species composition
A total of 5023 anopheline larvae were counted for the months of February, May, August and November at both the sites—Kombewa (1973 larvae) and Marani (3050 larvae). In Kombewa lowland, An. gambiae s.l. was the most abundant (49.1%) in anopheline larvae collected while in the highland of Marani, it was An. marshallii (51.3%). Of the four species found in November, only two were present in August (An. coustani and An. marshallii). Two major malaria vector species were found, An. gambiae and An. funestus. Of the vector larvae collected, An. gambiae s.s. from Marani, and An. gambiae s.l. from Kombewa were the most abundant (94.6 and 56.9% respectively).
The proportions of vector species in each land use/land cover type during dry and rainy seasons at both the sites are shown in Figs. 2 and 3. The results revealed that higher proportions of malaria vectors occurred mainly on farmlands and cultivated swamps (82.2% An. gambiae s.s. and 5.4% An. funestus) in the highland of Marani. However, in the lowland of Kombewa, the farmland had higher proportions of malaria vectors (27.2 and 24.6% An. gambiae and An. funestus respectively) followed by pastures during the rainy season.
Fig. 2.
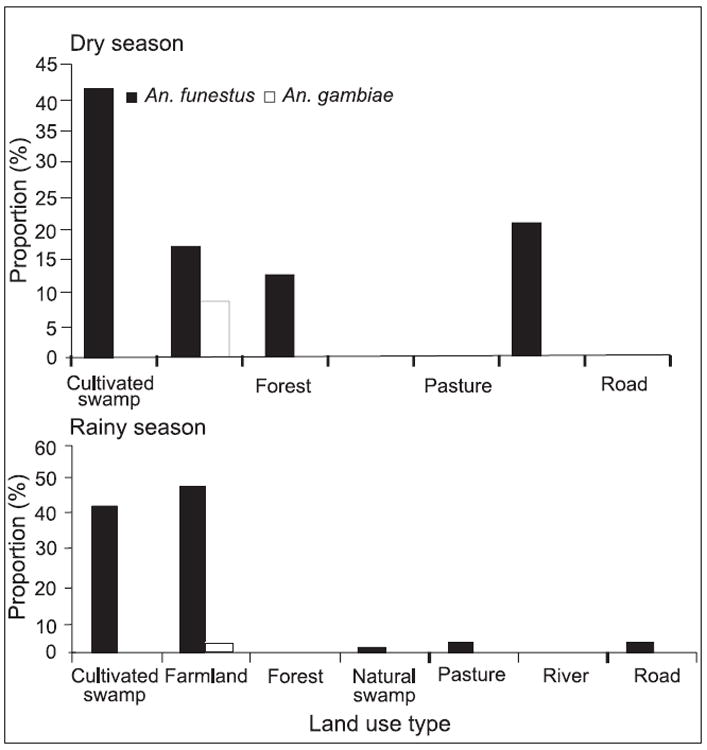
Proportion of malaria vectors in different land use/land cover types at Marani during dry season.
Fig. 3.
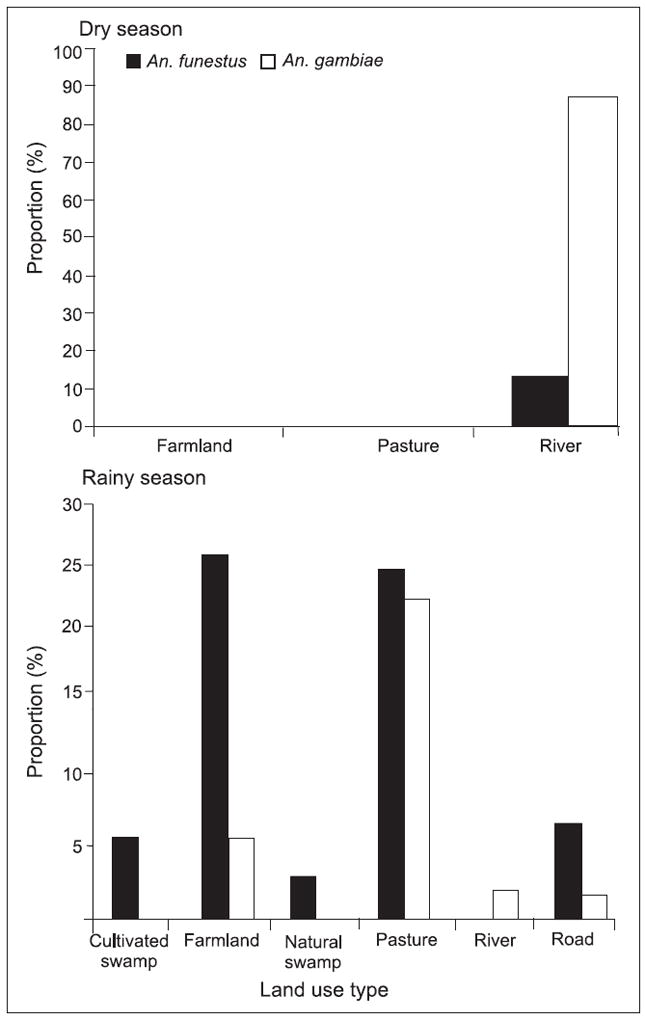
Proportion of malaria vector species in different land-use types at Kombewa during rainy season.
Larval habitat dynamics
A total of 1122 potential breeding habitats were sampled among which 579 (51.6%) were found positive with anopheline larvae. The highland site of Marani comprised 887 potential breeding habitats with 360 (40.6%) positive for anopheline larvae. However, the lowland site of Kombewa comprised only 235 breeding habitats with 219 (93.2%) positive habitats for anopheline larvae.
In the highland site, sampling period significantly affected the presence of anophelines in the potential breeding habitats (χ2 = 17.8, df = 3, p <0.05). There was a significant statistical difference in the presence of anophelines during the months of February, May and August (χ2 = 13.2, df = 4, p <0.05; χ2 = 11.9, df = 4, p <0.05; χ2 = 23.1, df = 4, p <0.05 respectively). At the lowland site of Kombewa, the occurrence of potential breeding habitats in different land use/land cover types was significantly different for August (χ2= 10.9, df = 2, p <0.05). However, no significant difference was found in potential breeding habitats during February, May and November (χ2 = 0.3, df = 2, p >0.05; χ2= 0.9, df = 2, p >0.05 and χ2= 0.01, df = 1, p >0.05 respectively).
The results show that in the highland of Marani, the number of positive breeding habitats in the farmland was significantly different over the sampling periods of August, February and May (t = 2.5, p <0.05, t = 2.5, p <0.05 and t = 2.4, p <0.05 respectively). A significant statistical difference in the number of positive breeding habitats was also observed in pastures over these sampling periods of August, February and May (t = 1.5, p <0.05; t = 2.8, p <0.05 and t = 2.6, p <0.05 respectively). In addition, the numbers of positive breeding habitats were significantly different over sampling period (F = 2.9, df = 3, p <0.05) in swamps. However, there was no statistical difference of positive breeding habitats in different land use/land cover types in November (χ2 =0.82, df = 4, p >0.05) (Table 1). No analysis was done for the road and forest land use types due to less data. In the lowland site, Chi-square showed no statistical difference in the number of positive breeding sites in the same land use/land cover type over the sampling period for all the three land use/land cover types.
Table 1.
Occurrence of breeding sites in different land use/land cover types in February, May, August and November 2004 at Marani and Kombewa
| Month | Habitats | Cultivated swamp | Marani
|
Cultivated swamp | Kombewa
|
|||||||||
|---|---|---|---|---|---|---|---|---|---|---|---|---|---|---|
| Farmland | Forest | Natural swamp | Pasture | River | Road | Farm land | Natural swamp | Pasture | River | Road | ||||
| February | No. of sites | 109 | 196 | 5 | 22 | 39 | 70 | 4 | 0 | 2 | 0 | 1 | 25 | 0 |
| (+)ve habitats | 40 (37)a | 116(59.2)b | 1 (20) | 6 (27.3) | 8 (20.5) | 21 (30)ab | 0(0) | 0(0) | 2 (100) | 0 (0) | 1 (100) | 23 (92) | 0 (0) | |
| May | No. of sites | 110 | 187 | 4 | 53 | 57 | 20 | 14 | 8 | 58 | 4 | 72 | 8 | 8 |
| (+)ve habitats | 48 (43.6)a | 53 (28.3)b | 0 (0) | 8 (15.1) | 14 (24.6)ab | 1 (5) | 2 (14.3) | 6(75) | 50 (86) | 4 (100) | 66 (92) | 6 (75) | 8 (100) | |
| August | No. of sites | 150 | 128 | 13 | 66 | 54 | 51 | 28 | 8 | 13 | 0 | 22 | 47 | 8 |
| (+)ve habitats | 59 (39.3)ab | 64 (50) a | 5 (38.5) | 20 (30.3) b | 11 (20.4) b | 13 (25.5) b | 1 (3.6) | 5(63) | 8(62) | 0 (0) | 5(23) | 30 (64) | 3 (37) | |
| November | No. of sites | 151 | 116 | 36 | 59 | 36 | 11 | 0 | 0 (0) | 3 | 14 | 57 | 0 | |
| (+)ve habitats | 69 (45.7)a | 56 (48.3)a | 10 (27.8)ab | 25 (42.4)a | 10 (27.8) | 2 (18.2) | 0 (0) | 0 (0) | 3 (100) | 12 (86) | 54 (95) | 0 (0) | ||
Letters following positive proportions show results of Turkey multiple comparison tests; Value with different letters were significantly different at p = 0.05 level; Figures in parentheses indicate percentages.
At the highland site of Marani, there was significant difference in occurrence of anophelines in habitat types in February (χ2= 12.7, df = 4, p <0.05). There was, however, no significant difference in proportions of positive breeding habitats in different habitat types during May, August and November (χ2=7.44, df = 5, p >0.05; χ2= 4.5, df = 3, p >0.05; χ2= 8.5, df = 6, p >0.05 respectively). For both rainy (May) and dry (February) seasons, drainage-ditch habitat type had the highest proportion (50% and 31.6% respectively) of the positive breeding sites (Table 2).
Table 2.
Occurrence of breeding sites in different habitat types in Marani for February, May, August and November 2004
| Month | Status | Drainage ditch | Foot prints | Manmade pool | Natural pool | Pond | Rock pool | Spring |
|---|---|---|---|---|---|---|---|---|
| February | No. of sites | 95 | 12 | 26 | 34 | 0 | 6 | 9 |
| (+) ve habitats | 30 (31.6)a | 1 (8.3) | 2 (7.7) | 7 (20.6) | 0 (0) | 0 (0) | 5 (55.6) | |
| May | No. of sites | 92 | 16 | 42 | 116 | 5 | 0 | 1 |
| (+) ve habitats | 46 (50)a | 7 (43.8) | 21 (50)a | 39 (33.6)a | 3 (60) | 0 (0) | 1 (100) | |
| August | No. of sites | 62 | 8 | 57 | 38 | 0 | 4 | 0 |
| (+) ve habitats | 29 (46.8)a | 3 (37.5) | 33 (57.9)a | 14 (36.8)a | 0 (0) | 0 (0) | 0 (0) | |
| November | No. of sites | 72 | 31 | 33 | 54 | 14 | 7 | 23 |
| (+) ve habitats | 30 (41.7)a | 7 (22.6) | 10 (30.3) | 28 (51.9)a | 6 (42.9) | 1 (14.3) | 9 (39.1) |
Letters following positive proportions show results of Tukey multiple comparison tests; Values with different letters were significantly different at p = 0.05 level; Figures in parentheses indicate percentages.
At Marani highland site during the wet season, we surveyed 705 habitats and found 360 (51.1%) positive with anopheline larvae. At the lowland site during the same season we sampled 133 potential habitats and found 124 (93.2%) positive with anopheline larvae. In the dry season at the highland site, the total number of potential habitats reduced to 182 habitats and 53 (29.1%) were found positive, whereas at the lowland site in the dry season, potential habitats dropped to 102, of which 95 (93.1%) were positive with anopheline larvae. At the highland site, farmlands had the highest proportion of positive breeding habitats during both the rainy and dry seasons (79.2 and 88.7% respectively). Most positive anopheline breeding habitats were confined to river valley (>100 m from river) during both dry and rainy seasons (Fig. 4). At the lowland site, most breeding habitats were found in pockets of water pools on the riverbed during the dry season. Natural pool habitat type predominated during both the rainy and dry seasons (47.4 and 95.1% respectively). Distribution of positive breeding sites was dependent on the season. In the dry season (February), these were found in the river beds whereas during the rainy season, most were associated with roads (Fig. 4).
Fig. 4.
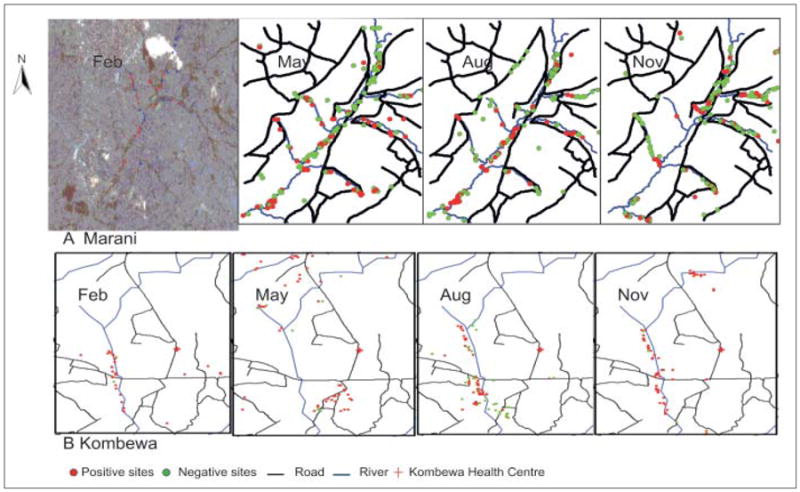
Distribution of anopheline breeding sites at Marani and Kombewa in 2004.
Environmental effects
Distance to the stream
At the highland site of Marani, there was a significant association between the distance from the nearest river/stream and the occurrence of anopheline larvae (F=1.3, df=747, p <0.05). In the lowland site of Kombewa, there was no association between distance from the nearest stream to the occurrence of anopheline larvae (F=0.14, df=1; p >0.05). In both Marani and Kombewa, seasonality influenced the occurrence of anopheline larvae in relation to distance to the nearest river/stream (F=6.97, df=3, p <0.05 and F=24.5, df=3, p <0.05 respectively). In Marani, distance from the river/stream was important during the dry season and long rainy season whereas at Kombewa during the dry season and short rain season. In the highland of Marani during February (dry season), 61 and 83% of breeding habitats were located within 50 and 100 m from the river respectively (Fig. 5). At Kombewa, in February (dry season), 92.2% of the positive breeding habitats were located within a distance of 120 m from the stream (Fig. 6). During the rainy season (May) at Marani, 72% of breeding habitats were located within 50 m from the stream and 93% within 100 m. At the lowland, 61.8% positive breeding sites were located within 520 m, 82.4% within 800 m and 94.1% within 1080 m from the nearest stream. In August (the short rain season) at Marani, 75 and 98% of the positive breeding habitats were located within 50 and 100 m respectively from the river/stream while at Kombewa, 92.2% of positive breeding habitats were located within 280 m from the stream. In November at the highland site, 71.4% positive breeding habitats were located within a distance of 120 m from the river/stream. At the lowland site, 85.3% positive breeding habitats were within a distance of 160 m from the stream.
Fig. 5.
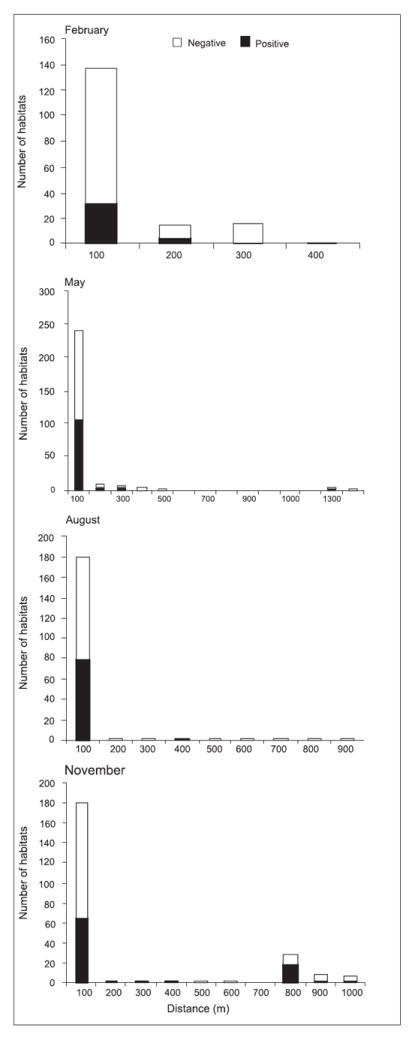
Distribution of larval habitats with reference to distance from the nearest stream at Marani.
Fig. 6.
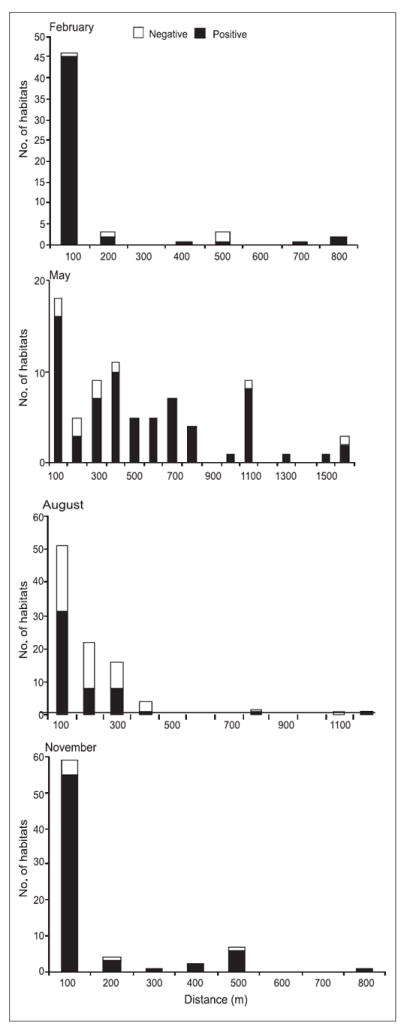
Distribution of larval habitats with reference to distance from the nearest stream at Kombewa.
Fisher’s exact test was done to determine aggregation. The results showed that at Marani, positive breeding sites were aggregated within a distance of 5 m from the stream in August (p <0.05). However, there was not any aggregation of positive breeding habitats during the months of February, May or November (r = 1.4, df = 1, p >0.05;r = 1.0, df = 1, p >0.05 and r = 1.4, df = 1, p >0.05 respectively). At Kombewa, aggregation of positive breeding habitats was detected within a distance of 100 m (Fisher’s exact test, p <0.05) in February and within 5 m from the river in August. In May and November, no aggregation was found.
Elevation
Marani
The results revealed that at Marani, the occurrence of anopheline breeding habitats was associated with elevation during all sampling periods except in November while at Kombewa, there was association in August and November but not in February and May (Table 3). At the highland site it was also observed that in February (dry season), 65 and 90% of positive breeding sites were within an elevation of 1580 and 1620 m respectively whereas at the lowland site, 96% of positive breeding sites were within an elevation of 1220 m. In May (long rainy season) at the highland site, 59.5 and 96% of positive breeding sites were within an elevation of 1580 and 1620 m while 80% of positive breeding habitats were located within 1220 m at the lowland site. In August, 70.9 and 95.2% of positive breeding habitats were located within an elevation of 1580 and 1620 m respectively at the highland site and 82.4% positive breeding habitats within an elevation of 1220 m at the lowland site. In November, 72.5 and 96.7% positive breeding habitats were located within 1580 and 1620 m at the highland site and 78.3% positive breeding habitats located within an elevation of 1220 m at the lowland site (Fig. 7).
Table 3.
Average elevation, distance from nearest stream, surface area, habitat number (%) and t-test results for association of variables to anopheline occurrence at Marani and Kombewa in 2004
| Month | Marani
|
Kombewa
|
|||||||||
|---|---|---|---|---|---|---|---|---|---|---|---|
| Presence | Absence | t-value | df | p-value | Presence | Absence | t-value | df | p-value | ||
| February | Elevation (m) | 1571.2 ± 3.7 | 1581.2 ± 2.1 | 2.3 | 79 | < 0.05 | 1197.4 ± 4.7 | 1178 ± 9.6 | 1.8 | 5 | > 0.05 |
| Distance (m) | 50.7 ± 10 | 70.5 ± 6.7 | 1.2 | 155 | > 0.05 | 103.5 ± 23.3 | 254.1 ± 104.1 | 1.4 | 3 | > 0.05 | |
| Surface area (m2) | 3.4 ± 0.5 | 6.1 ± 1.3 | 2 | 169 | < 0.05 | 12 ± 1.4 | 5.8 ± 1.9 | 2.9 | 7 | < 0.05 | |
| Habitats | 53 (29.1) | 129 (70.9) | 26 (92.9) | 2 (7.1) | |||||||
| May | Elevation (m) | 1572 ± 2.6 | 1567 ± 1.7 | 1.7 | 209 | < 0.05 | 1191.3 ± 3.7 | 1205 ± 8.9 | 1.4 | 11 | > 0.05 |
| Distance (m) | 53.7 ± 11.7 | 112.2 ± 21.6 | 2.4 | 233 | < 0.05 | 489.1 ± 48 | 427.6 ± 175 | 0.4 | 9 | > 0.05 | |
| Surface area (m2) | 25.8 ± 17.2 | 8.7 ± 2.9 | 1 | 128 | > 0.05 | 27.4 ± 6.9 | 9.5 ± 3.4 | 2.1 | 71 | < 0.05 | |
| Habitats | 132 (48.5) | 140 (51.5) | 70 (88.6) | 9 (11.4) | |||||||
| August | Elevation (m) | 1571.4 ± 2.6 | 1585 ± 2.5 | 3.7 | 188 | < 0.05 | 1200.8 ± 2.7 | 1192 ± 2.4 | 2.3 | 94 | < 0.05 |
| Distance (m) | 81.1 ± 46.9 | 108 ± 17.7 | 0.9 | 123 | > 0.05 | 150.9 ± 26.3 | 170.4 ± 27.3 | 0.8 | 94 | > 0.05 | |
| Surface area (m2) | 16.1 ± 3.5 | 27.2 ± 17.7 | 0.6 | 124 | > 0.05 | 11.5 ± 1.9 | 10 ± 3.2 | 0.4 | 77 | > 0.05 | |
| Habitats | 84 (42.2) | 115(57.8) | 54(1000) | 0 (0) | |||||||
| November | Elevation (m) | 1573.3 ± 2.4 | 1569.9 ± 2 | 1.1 | 196 | > 0.05 | 1200.7 ± 4.6 | 1177.8 ± 11.7 | 4.1 | 69 | < 0.05 |
| Distance (m) | 232.4 ± 34.7 | 162 ± 23.4 | 1.7 | 169 | < 0.05 | 110.4 ± 17 | 128.46 ± 59 | 0.3 | 6 | > 0.05 | |
| Surface area (m2) | 10.5 ± 1.3 | 6.4 ± 0.7 | 2.7 | 139 | < 0.05 | 17.3 ± 2 | 12.1 ± 9 | 0.6 | 4 | > 0.05 | |
| Habitats | 91 (38.9) | 143 (61.1) | 69 (93.2) | 5 (6.8) | |||||||
Figures in parentheses indicate percentages.
Fig. 7.
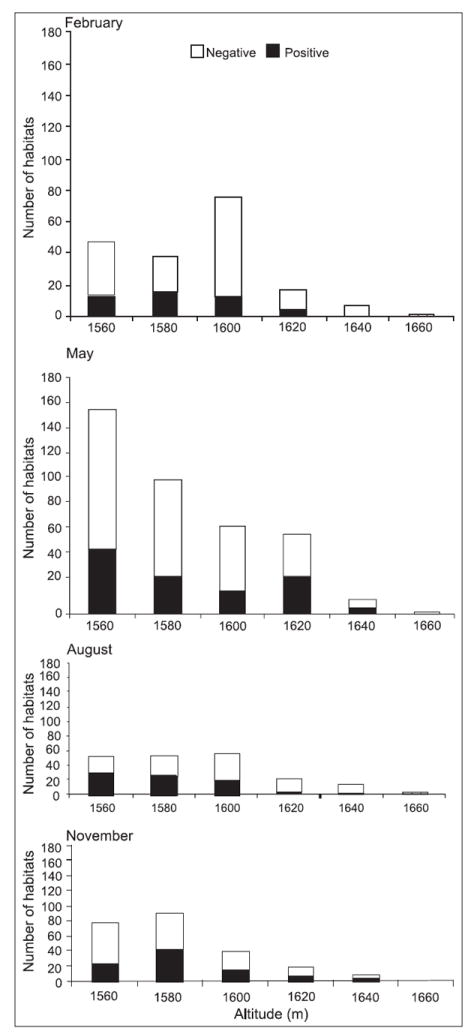
Distribution of breeding sites against height above sea level at Marani in 2004.
We found an association between surface area of positive breeding habitats and occurrence of anopheline larvae in February and May; we, however, found no association in August and November. The mean surface area for positive breeding habitats was largest in May and smallest in August.
DISCUSSION
The study has demonstrated that topography, seasonality and land cover/land use types play an important role in the spatial distribution of anopheline breeding habitats in the highland environment. Indeed, at the highland site, anopheline breeding habitats were mostly found in the valley bottom throughout the sampling period. During the dry season, larval breeding habitats were exclusively confined to the river valley. Topography and man-made features affect the formation of larval breeding habitats at highland site. The highland is characterized by hills interspersed with valleys. The surface run-off water always drains downstream due to gravity thus accumulates in the valley bottoms creating potential mosquito breeding habitats.
In the lowland site, seasonality was the main determinant of spatial distribution of breeding habitats. In fact, because the land is generally flat in the lowland, during the rainy season, water mainly accumulates alongside roads. Breeding habitats are scattered all over the study area. During the dry season, water dries up in most seasonal streams while the water level tremendously recedes in the permanent river leaving small puddles of water on the riverbed, which becomes colonized by anopheline mosquitoes. The larval breeding sites are aggregated on the riverbed.
The results suggest that land-use types affect the availability and suitability of anopheline breeding habitats at the highland site. Farmlands land cover/land-use types had the highest proportions of potential and positive anopheline breeding habitats during both dry and rainy seasons. In the farmlands, An. gambiae s.s. larvae proportion was the highest suggesting better conditions for An. gambiae s.s. survival. The removal of vegetation cover of natural swamps increases the microhabitat temperature, which reduce developmental period of immature aquatic stages and improve the nutrient quality of the habitat. Land under high vegetation cover has low water temperature but the cultivation enables the penetration of direct sunlight which increases water temperature. Minakawa et al30 in another study demonstrated that development of An. gambiae s.s. to adults was shorter in cultivated swamps than natural swamps. In the same study, the survival of immature aquatic stages of An. gambiae s.s. was higher in the cultivated swamps than natural swamps. Munga et al31 demonstrated that emergence of adult An. gambiae s.s. only occurred in farmlands and not in natural swamps. These findings concur with the hypothesis that land use change increases the availability of potential larval habitats and improves their quality making them more suitable for the breeding of malaria vector mosquito in the highland regions. In the lowland environment, factors that catalyze surface water collection were the main determinants.
The study has also demonstrated that An. gambiae s.s. known to colonize small open sun-lit temporary pools20-22 can also thrive in semi-permanent breeding habitats. In Marani, the highest proportion of An. gambiae s.s. was found in drainage ditches that are characteristic of cultivated swamps. The water level of these habitats highly fluctuates with seasons. Anopheles gambiae being an opportunistic species32 colonizes the habitats once they have been created during cultivation. It is important to note that the main malaria transmission season coincides with the crop-planting season, when most of the land is under cultivation. The opening of drainage ditches during this cultivation period favours the proliferation of algae that constitute food nutrients for mosquito larvae22. From these results we suggest that there could be other major paramount factors that determine the suitability of habitats to be colonized by An. gambiae other than size and nature (temporary, semi-permanent or permanent). In the lowland site An. gambiae s.l. was always found in permanent habitats.
The results suggest that targeted larval control activities can be undertaken during the dry and short rainy seasons because larval breeding habitats are just confined to small areas in the valley bottoms. This makes the operation of larval control cost-effective. Furthermore, during these seasons, at both the highland and lowland sites, the breeding habitats are stable and that enhances the effectiveness of larvicides.
CONCLUSION
The study has demonstrated that cultivation of swamps increase the number of breeding habitats and improves their quality making them more suitable for anopheline larval colonization and survival on farmlands. The outcome is increased malaria transmission in areas where the initial conditions did not favour the development of malaria vectors.
Acknowledgments
This paper is published with the permission of the Director, Kenya Medical Research Institute. We acknowledge Ben Omboko and Paul Ochiele for technical assistance. The work was supported by NIH grants R01A150243 and D43 TW01505.
References
- 1.Lepers JP, Deloron P, Fontenille D, Coulange P. Reapperance of falciparum malaria in central highland plateaux of Madagascar. Lancet. 1988;1:586. doi: 10.1016/s0140-6736(88)91375-x. [DOI] [PubMed] [Google Scholar]
- 2.Some ES. Effects and control of a highland malaria epidemic in Uasin Gishu district, Kenya. East African Med J. 1994;71:2–8. [PubMed] [Google Scholar]
- 3.Kigotho AW. Services stretched as malaria reaches Kenyan highlands. Lancet. 1997;350:423. [Google Scholar]
- 4.Kilian AHD, Langi P, Talisuna A, Kabagambe G. Rainfall pattern, El Nino and malaria in Uganda. Trans R Soc Trop Med Hyg. 1999;93:22–3. doi: 10.1016/s0035-9203(99)90165-7. [DOI] [PubMed] [Google Scholar]
- 5.Lindblade KA, Walker ED, Onapa AW. Highland malaria in Uganda: prospective analysis of an epidemic associated with El Niño. Trans R Soc Trop Med Hyg. 1999;93(5):480–7. doi: 10.1016/s0035-9203(99)90344-9. [DOI] [PubMed] [Google Scholar]
- 6.Negash K, Kebede A, Medhin A, Argaw D, Babaniyi O, Guintran JO, et al. Malaria epidemics in the highlands of Ethiopia. East Afr Med J. 2005;82(4):186–92. doi: 10.4314/eamj.v82i4.9279. [DOI] [PubMed] [Google Scholar]
- 7.Malakooti MA, Biomndo K, Shanks GD. Reemergence of epidemic malaria in the highlands of Western Kenya. Emerg Infect Dis. 1998;4:671–6. doi: 10.3201/eid0404.980422. [DOI] [PMC free article] [PubMed] [Google Scholar]
- 8.Githeko AK, Ndegwa W. Predicting malaria epidemics in the Kenyan highlands using climate data: a tool for decision makers. Global Change & Human Health. 2000;2(1):54–63. [Google Scholar]
- 9.John CC, Ouma JH, Sumba PO, Hollingdale MR, Kazura JW, King CL. Lyphocyte proliferation and antibody responses to Plasmodium falciparum liver-stage antigen-1 in a highland area of Kenya with seasonal variation in malaria transmission. Am J Trop Med Hyg. 2002;66:372–8. doi: 10.4269/ajtmh.2002.66.372. [DOI] [PubMed] [Google Scholar]
- 10.John CC, O’Donnell RA, Sumba PO, Moormann AM, Koning-Ward TF, Crabb BS. Evidence that invation-inhibitory antibodies specifif for the 19-kDa fragment of merozoite surface protein-1 (MSP-1 19) can play a protective role against blood-stage Plasmodium falciparum infection in individuals in a malaria endemic area of Africa. J Immunol. 2004;173:666–72. doi: 10.4049/jimmunol.173.1.666. [DOI] [PubMed] [Google Scholar]
- 11.Nyamwange M. Population growth and development: the Kenyan experience. Scand J Dev Altern. 1995;14:149–60. [PubMed] [Google Scholar]
- 12.World population prospects: the 2002 revision. New York: United Nations; 2002. p. vi. [Google Scholar]
- 13.Rogers DJ, Randolph SE. The global spread of malaria in a future, warmer world. Science. 2000;289:1763–6. doi: 10.1126/science.289.5485.1763. [DOI] [PubMed] [Google Scholar]
- 14.Whitmore TC. Tropical forest disturbance, disappearance and species loss. In: Laurance WL, Bierregaard RO Jr, editors. Tropical forests remnants. Chicago: University of Chicago Press; 1997. [Google Scholar]
- 15.Lindsay SW, Martens WJM. Malaria in the African highlands: past, present and future. Bull World Health Organ. 1998;76(1):33–45. [PMC free article] [PubMed] [Google Scholar]
- 16.Lindblade KA, Walker ED, Onapa AW, Katungu J, Wilson ML. Land use change alters malaria transmission parameters by modifying temperature in a highland area of Uganda. Trop Med Int Health. 2000;5(4):263–73. doi: 10.1046/j.1365-3156.2000.00551.x. [DOI] [PubMed] [Google Scholar]
- 17.Githeko AK, Lindsay SW, Confalonieri UE, Patz JA. Climate change and vector-borne diseases: a regional analysis. Bull World Health Organ. 2000;78:1136–47. [PMC free article] [PubMed] [Google Scholar]
- 18.Zhou G, Minakawa N, Githeko AK, Yan G. Association between climate variability and malaria epidemics in the East African highlands. Pro Natl Acad Sci USA. 2004;101:2375–80. doi: 10.1073/pnas.0308714100. [DOI] [PMC free article] [PubMed] [Google Scholar]
- 19.Coetzee M, Craig M, Sueur D. Distribution of African malaria mosquitoes belonging to the Anopheles gambiae complex. Parasitol Today. 2000;16(2):74–7. doi: 10.1016/s0169-4758(99)01563-x. [DOI] [PubMed] [Google Scholar]
- 20.Minakawa N, Mutero CM, Githure JI, Beier JC, Yan G. Spatial distribution and habitat characterization of anopheline mosquito larvae in Western Kenya. Am J Trop Med Hyg. 1999;61:1010–6. doi: 10.4269/ajtmh.1999.61.1010. [DOI] [PubMed] [Google Scholar]
- 21.Minakawa N, Githure JI, Beier CJ, Yan G. Anopheline mosquito survival strategies during the dry period in Western Kenya. J Med Entomol. 2001;38(3):388–92. doi: 10.1603/0022-2585-38.3.388. [DOI] [PubMed] [Google Scholar]
- 22.Gimnig JE, Ombok M, Kamau L, Hawley WA. Characteristics of larval anopheline (Diptera: Culicidae) habitats in Western Kenya. J Med Entomol. 2001;38:282–8. doi: 10.1603/0022-2585-38.2.282. [DOI] [PubMed] [Google Scholar]
- 23.Minakawa N, Sonye G, Mogi M, Githeko A, Yan G. The effects of climatic factors on the distribution and abundance of malaria vectors in Kenya. J Med Entomol. 2002;39(6):833–41. doi: 10.1603/0022-2585-39.6.833. [DOI] [PubMed] [Google Scholar]
- 24.Shililu J, Ghebremeskel T, Mengistu S, Fekadu H, Zerom M, Mbogo C, et al. Distribution of anopheline mosquitoes in Eritrea. Am J Trop Med Hyg. 2003;69(3):295–302. [PubMed] [Google Scholar]
- 25.Minakawa N, Sonye G, Mogi M, Yan G. Habitat characterization of Anopheles gambiae s.s. larvae in a Kenyan highland. Med Vet Entomol. 2004;18:301–5. doi: 10.1111/j.0269-283X.2004.00503.x. [DOI] [PubMed] [Google Scholar]
- 26.Kitron US. Suppression of transmission of malaria through source reduction; anti-anopheline measures applied in Israel, United States and Italy. Rev Infect Dis. 1989;11:391–406. doi: 10.1093/clinids/11.3.391. [DOI] [PubMed] [Google Scholar]
- 27.Manual on practical entomology in malaria. Pt II: Methods and techniques, No 13. Vol. 11. Geneva: World Health Organization; 1975. pp. 391–406. [Google Scholar]
- 28.Gilles MT, De Meillon B. The anophelene of Africa South of the Sahara (Ethiopian Zoologeographical Region. Publication of the South African Institute for Medical Research. 1968;54:1–343. [Google Scholar]
- 29.Scott JA, Brogdon WG, Collins FH. Identification of single specimens of the Anopheles gambiae complex by the polymerase chain reaction. Am J Trop Med Hyg. 1993;49:520–9. doi: 10.4269/ajtmh.1993.49.520. [DOI] [PubMed] [Google Scholar]
- 30.Minakawa N, Omukunda E, Zhou G, Githeko A, Yan G. Malaria vector productivity in relation to the highland environment in Kenya. Am J Trop Med Hyg. 2006;75(3):448–53. [PubMed] [Google Scholar]
- 31.Munga S, Minakawa N, Zhou G, Mushinzimana E, Barrack JO, Githeko AK, et al. Association between land cover and habitat productivity of malaria vectors in Western Kenya highlands. Am J Trop Med Hyg. 2006;74(1):69–75. [PubMed] [Google Scholar]
- 32.Gordeev MI. Resistance to hunger as an element of the adaptive strategy of malaria mosquito larva. Genetika. 1997;33(6):844–51. [PubMed] [Google Scholar]


