

Advances in nanotechnology have resulted in the development of new nanoparticles that have the potential to revolutionize medicine. Many nanomaterials have been engineered that promise to enhance drug delivery efficacy to target tissues, reduce side effects, and provide a delivery vehicle for hydrophobic anticancer drugs or imaging agents. Among these materials, MCM-41 mesoporous silica has received much attention because of its large surface area, large internal pore volume, tunable pore size and good chemical and thermal stability.[1–6] Mesoporous silica nanoparticles (MSNs) are taken up into cancer cells by energy-dependent endocytosisand the majority of them co-localize with the endo/lysosomal compartments.[7–11] We as well as others have shown that MSNs can serve as efficient drug delivery vehicles and imaging vectors.[1–3,12–24] Their biocompatibility, biodistribution and their efficacy to inhibit tumor growth have been demonstrated in animal studies.[25–28]
While the uptake of MSNs by cancer cells has been investigated in a number of studies,[7,12,29–33] little is known about their ultimate fate inside cells. Recently, it has been reported that MSNs are exocytosed from cells.[34] However, the cellular mechanism responsible for this event was not addressed. Possible mechanisms of MSN exocytosis are presented in Scheme 1, where endocytosed nanoparticles co-localize to the lysosomes and they could either enter the Golgi Apparatus for excretion or undergo lysosomal exocytosis. In the previous study mentioned above, MSN exocytosis was observed with nanoparticles that are not surface-modified.[34] Considering that coating the outer surface of MSNs with 3-(trihydroxysilyl)propyl methylphosphonate has been shown to improve nanoparticle dispersibility,[12] and that MSNs used for cancer therapy usually have targeting moieties attached on their surface,[25–28] exocytosis needs to be studied using surface modified MSNs. In this study, we examine MSNs with surface modification and show that phosphonate-modified nanoparticles (termed P-MSNs throughout this paper) mainly use lysosomal exocytosis to exit cells. We find that the P-MSNs added to cells can be recovered intact after their excretion from cells and that this is mediated by fusion of lysosomes to the plasma membrane. We demonstrate that P-MSN exocytosis can be regulated by affecting lysosomal exocytosis. Since drug release from P-MSNs occurs via diffusion, the resident time of the P-MSNs inside the cells may influence the amount of drug released inside the cell. By decreasing the exocytosis rate of camptothecin loaded P-MSNs, we show an improvement in the cellular effects of delivered drugs.
Scheme 1.
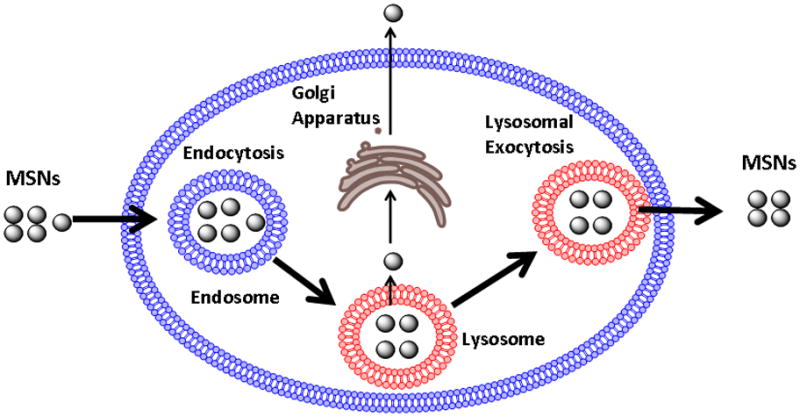
MSN endocytosis and possible mechanisms of exocytosis. Endocytosed MSNs mainly co-localize to the lysosome. We examined two exocytosis pathways that could be responsible for MSN exocytosis, excretion through the Golgi apparatus and lysosomal exocytosis.
Our initial insight into P-MSN exocytosis was obtained when we examined uptake of fluorescein isothyocyanate (FITC) labeled P-MSNs into lung cancer cell line A549 by flow cytometry analysis. The nanoparticles (Figure 1A) were prepared by sol-gel method [12,35] and surface modified by the addition of 3-(trihydroxysilyl)propyl methylphosphonate.[29] FITC was attached via a co-condensation method. Each particle has an average diameter of ~130 nm and contains more than a thousand pores, each having a diameter of 2–3 nm. As shown in Figure 1B, the green fluorescence of P-MSNs can be detected inside the cell 2 hrs after the addition of P-MSNs into the media. The fluorescence largely overlaps with the staining of anti-LAMP1 antibody, suggesting that they are localized in the lysosomes. Interestingly, upon further incubation, we noticed that the fluorescent signal inside the cell decreased (Figure S1). To quantify P-MSN fluorescence inside the cells by flow cytometry, A549 cells were incubated with P-MSNs for 2 hrs, and then washed with PBS two times before adding fresh growth medium for further incubation (6, 24 and 48 hrs). As seen in Figure 1C, the fluorescence inside the cells dramatically increased after incubation with P-MSNs for 2 hrs due to nanoparticle uptake, but this fluorescence dramatically decreased after 6 hrs and reached almost basal level after 24 and 48 hrs, suggesting that the particles had exited the cells. There was a 65%, 82%, and 95% decrease in fluorescence inside the cells after 6, 24, and 48 hrs, respectively (Figure 1C). These results were confirmed with ICP-OES, in which the silicon (Si) concentration inside the cells was measured after P-MSN endocytosis and compared to the Si concentration in the cell media after 24 hrs for detection of exocytosed P-MSNs. We discovered that when a total mass of 5 μg of silicon was endocytosed by 4 × 10⁵ cells after 2 hr treatment with P-MSNs, 4.7 μg of silicon were exocytosed and detected in the media 24 hrs later (Figure 1D).
Figure 1.

Exocytosis of P-MSNs from A549 cells. A) TEM pictures of phosphonate modified MSNs (P-MSNs) used for exocytosis experiments. B) Fluorescent microscopy analysis detecting the P-MSNs fluorescence inside the cells after 2 hrs treatment with the nanoparticles and staining of lysosomes with lyso-Tracker Red. MSNs (green), Lysosomes (red), Nucleus (blue). C) Flow cytometry analysis of A549 cells treated with P-MSNs for 2 hrs, washed with PBS, and incubated for an additional 6, 24, and 48 hrs. Fluorescence is quantitated as shown in the lower panel. D) ICP-OES analysis of P-MSNs endocytosed by A549 cells after 2 hrs (left) as well as P-MSN exocytosis after 24 hrs (right). E) TEM pictures of Zinc-Doped iron core P-MSNs before being added to cells (left) and collected with a magnet after being exocytosed by cells (right). F) ICP-OES analysis to measure the extent of exocytosis of phosphonated, PEI-coated, and folate modified MSNs.
In the next experiment, we recovered P-MSNs exocytosed from cells by using MSNs containing zinc-doped iron oxide cores and a Neodymium (NdFeB) magnet. These nanoparticles were prepared by forming a mesoporous silica shell around the zinc-doped iron oxide nanocrystal core[15] (Figure 1E, left panel). They have the size and surface modification (phosphonate attachment) similar to the P-MSNs used in the previous experiments. The zinc-doped iron oxide core P-MSNs were endocytosed and excreted from A549 cells in a manner similar to that seen with P-MSNs without zinc-doped iron oxide core (Figure S2). The exocytosed zinc-doped iron oxide core P-MSNs were collected from the media using an NdFeB magnet. TEM analysis of the exocytosed zinc-doped iron oxide core P-MSNs (Figure 1E, right panel) showed an intact spherical structure with organized pores, similar in appearance with the P-MSNs added to the media (Figure 1E left panel). These results show that P-MSNs are excreted from cells, and that they are intact.
Other types of MSNs have also been developed for delivery of therapeutics. MSNs modified with polyethylenimine (PEI) are used for siRNA delivery,[14,36] while folate modified MSNs are used to target tumors.[16] These surface modified MSNs were also exocytosed but at a slower rate, as shown in Figure 1F. PEI- or folate-coated MSNs were incubated with A549 cells and the amount of nanoparticles that had been exocytosed after 6 hrs was quantitatively compared to MSNs modified with phosphonate by ICP-OES. After 6 hrs of incubation, 84% of the P-MSNs had been exocytosed from the cells, compared to 66% and 49% of the folate-MSNs and PEI-MSNs respectively (Figure 1F). This suggests that although different surface modifications affect the exocytosis rate of MSNs, the particles are able to exit the cells. For the remainder of this work, we focused on P-MSNs and investigated their exocytosis mechanism.
We first used a number of human cell lines and found that there are differences in the rate of P-MSN exocytosis among them. The cell lines used are the lung cancer cell line A549, breast cancer cell lines MDA-MB231, MCF-7 and MDA-MB435, the pancreatic cancer cell line PANC-1, and the human embryonic stem cell line H9. All cell lines were incubated with fluorescent P-MSNs for 2 hours to allow uptake of nanoparticles by the cells. After the nanoparticle uptake, the cells were washed with PBS to remove remaining P-MSNs and fresh growth medium was added. Flow cytomety was performed to measure the nanoparticle fluorescence inside cells. The fluorescence measurement obtained immediately after nanoparticle uptake was compared to the fluorescence measurement obtained after 24 hrs incubation to determine the percentage of nanoparticles that had exited the cells. The results shown in Figure 2 demonstrate that there are variations in the rate of P-MSN exocytosis among different cell lines. The order of exocytosis efficiency starts with A549 cells having the highest excretion with 87% followed by MDA-MB231 (81%), PANC-1 (75%), MCF-7 (61%), MDA-MB 435 (36%), and H9 (4%). The H9 cells had the lowest phosphonate-modified MSN exocytosis, suggesting that P-MSNs remain inside embryonic stem cells for days and are not exocytosed as fast as in other cell lines. These results are consistent with reports that MSNs can be used to label human mesenchymal stem cells[37–39] and can be tracked for several days after transplantation into mice.[38,39]
Figure 2.
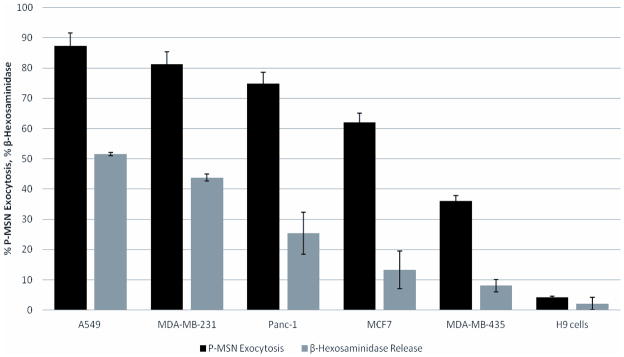
Efficiency of cells to excrete P-MSNs correlates well with secretion of β-hexosaminidase. To measure P-MSN exocytosis, cells were grown to high confluency first, incubated with P-MSN, washed with PBS, changed to fresh media and then incubated for 24 hrs. Exocytosis of P-MSNs is measured by flow cytometry. Release of β-hexosaminidase is a measurement of lysosomal exocytosis.
The rate of P-MSN exocytosis appears to correlate with the rate of lysosomal exocytosis. Lysosomal exocytosis is the fusion of the lysosomal membrane with the plasma membrane, resulting in the release of lysosome components out of the cell. This mechanism has been observed in a variety of cells and is thought to be involved in membrane repair,[40] acquisition of metastatic potential in cancer cells,[41] and resistance to autophagy induced cell death. [42] The fusion of lysosomes with the plasma membrane has been reported in hepatocytes, fibroblasts, epithelial cells and cancer cells.[43] Lysosomal exocytosis can be detected by measuring the release of β-hexosaminidase, an enzyme that resides inside lysosomes, into the culture media. Enzyme assays for the release of β-hexosaminidase revealed that A549 cells and MDA-MB 231 cells have a relatively high rate of lysosomal exocytosis with 51% and 44% of the enzyme being released after 24 hours of incubation respectively, while PANC-1 had 25%, MCF-7 had 13%, and MDA-MB 435 along with H9 having less than 10% enzyme secretion (Figure 2). The order of these cells to secrete β-hexosaminidase appears to correlate well with the order of excretion of P-MSNs, suggesting that lysosomal exocytosis plays a major role in these cell lines’ exocytosis of P-MSNs.
The exocytosis of P-MSNs does not involve Golgi apparatus as disruption of the Golgi apparatus did not prevent P-MSN exocytosis. A549 cells were treated with Exo1 or Brefeldin A, two compounds known to inhibit protein exocytosis by causing collapse of the Golgi apparatus.[44–47] Cells were treated with P-MSNs for two hours to allow cellular uptake of the nanoparticles, then the growth medium was changed to fresh medium containing Exo1 (50 μM) or Brefeldin A (10 μM). Flow cytometry was performed 6 hrs later to monitor these compounds’ effect on P-MSN exocytosis (Figure 3A, left panel). Our results show that treated cells were able to exocytose P-MSNs as efficiently as the control cells, even though the Golgi had collapsed by treatment with Brefeldin A or Exo1 (Figure 3A, right panel) as demonstrated by Anti-golgin 97 staining and fluorescence microscopy. These results suggest that disruption of the Golgi apparatus does not have a significant effect on P-MSN excretion by cells.
Figure 3.

A) Measurement of P-MSN exocytosis by flow cytometry of A549 cells treated with Brefeldin A (10 μM) and Exo1 (50 μM) (left panel). Right panel shows that Brefeldin A and Exo1 disrupt the Golgi apparatus (stained with green anti-golgin 97). B) A549 cells were treated with the following inhibitors: Nocodazole (20 μM), Cytochalasin D (20 μM), Bafilomycin A1 (100 nM), and LY294002 (2 μM). Flow cytometry was performed to determine the effect of these inhibitors on P-MSN exocytosis. C) Cells were treated P-MSNs for two hours and then 10 μM Ionomycin was added for two hours to accelerate P-MSN exocytosis (left). Treatment with Ionomycin also increased the lysosomal exocytosis (right). D) Treatment with U18666A impeded P-MSNs exocytosis in a dose dependent manner. E) Cell killing enhancement of P-MSNs loaded with camptothecin by impeding P-MSN exocytosis with Bafilomycin A (12.5 nM) and U18666A (2.5 μM). Cells were treated with P-MSN loaded with CPT for a final concentration of 50 nM CPT and Bafilomycin A and U18666A for 24 hrs.
The above results support the idea that P-MSNs are localized in the lysosome and then exocytosed by lysosomal exocytosis. There are, however, observations of a minor population of MSNs that does not co-localize with the lysosomes.[14,31,33,37,48] This observation is likely dependent on the type and amount of MSNs used, time of incubation, and cell lines utilized. Further work is needed to examine whether they represent a minor population of MSNs that escaped lysosomes and whether they utilize a different pathway for their exocytosis.
In the next set of experiments, inhibitors of lysosomal exocytosis were used to further investigate P-MSN exocytosis. Our results show that a number of reagents that inhibit lysosomal exocytosis, such as Cytochalasin D, Bafilomycin A1, Nocodazole and LY294002, also inhibit P-MSN exocytosis. As shown in Figure 3B, we found that inhibition of lysosome acidification by Bafilomycin A1 can inhibit P-MSN exocytosis. We also found that Nocodazole, which inhibits microtubule formation, and Cytochalasin D, which inhibits actin polymerization, both inhibit P-MSN exocytosis. This may be because actin polymerization and microtubule formation are required for transport of the lysosomes to the periphery and fusion with the plasma membrane.[49–51] Signaling through the lipid kinase PI3K is also important for lysosomal exocytosis as it leads to an increase in cytosolic Ca2+ resulting in the fusion of lysosomes with the plasma membrane. The use of PI3 kinase inhibitors has been shown to decrease lysosomal exocytosis[42] and we found that LY294002, a PI3 kinase inhibitor, also causes inhibition of P-MSN exocytosis (Figure 3B). The reagents were added to the cells after the P-MSNs had been endocytosed, so that the inhibitors will only affect the exocytosis of the nanoparticles and not the endocytosis. To confirm that these inhibitors were in fact blocking lysosomal exocytosis, the release of β-hexosaminidase from cells was measured. The control cells secreted approximately 23% β-hexosaminidase after 6 hrs incubation whereas the cells treated with LY294002 and Nocodazole secreted approximately 16% and 14% respectively (Figure S3). In cells treated with Cytochalasin D and Bafilomycin A1 the secretion was less than 5% (Figure S3). There is good correlation between these effects and the effects on P-MSN exocytosis. This further supports the idea that the majority of P-MSNs are exocytosed through lysosomal exocytosis.
We found that increase in intracellular calcium accelerates lysosomal exocytosis and enhances P-MSN exocytosis. The fusion of the lysosomal membrane with the plasma membrane depends on synaptotagmin VII,[52,53] which is a transmembrane protein that upon binding calcium, undergoes a conformational change that allows it to bind to the SNARE complex on the plasma membrane, facilitating membrane fusion. To study the effect of increased intracellular calcium concentration on P-MSN exocytosis, cells were treated with Ionomycin, an ionophore that transports calcium into the cells. As shown in Figure 3C, left panel, Ionomycin treatment accelerated P-MSN exocytosis with 80% of the nanoparticles out of the cells after only two hours of incubation. This corresponded to the increase in lysosomal exocytosis caused by the Ionomycin treatment, as evidenced by an increase in β-hexosaminidase release (Figure 3C, right panel). These results suggest that acceleration of lysosomal exocytosis also accelerates P-MSN exocytosis, supporting the idea that an important portion of P-MSNs exit cells through this mechanism.
U18666A, a class 2 amphiphile, known to alter cholesterol accumulation and affect different intracellular trafficking pathways, impedes P-MSN exocytosis in A549 cells. Treatment of cells with U18666A mimics the cellular effects of Niemann-Pick disease type C1 (NPC1), a neurodegenerative disease characterized by excess accumulation of cholesterol in the lysosomes.[54,55] This compound can also alter the calcium concentration in lysosomes.[56] A549 cells were pre-treated with U18666A for 18 hrs and then P-MSNs were added for two hours. After rinsing the cells with PBS, the cells were incubated for an additional 6 hours. Treatment with U18666A markedly decreased P-MSN exocytosis in A549 cells in a concentration-dependent manner (Figure 3D). Furthermore, this compound also inhibited lysosomal exocytosis (Figure S4). This provides further support for the idea that lysosomal exocytosis is important for P-MSN exocytosis.
When P-MSN exocytosis is inhibited by Bafilomycin A1 or U18666A, cell killing by camptothecin (CPT)-loaded P-MSNs is enhanced (Figure 3E). The amount of time that MSNs remain inside the cells could affect the drug delivery efficacy of the nanoparticles, as longer retention time would allow for more drug to be released inside the cells and increase cytotoxicity. The fact that some cell lines carry out P-MSN exocytosis faster than others raises the possibility that the efficacy of P-MSN drug delivery could be enhanced by slowing down exocytosis. Therefore we treated the lung cancer cell line A549 cells with CPT-loaded P-MSNs in the presence of Bafilomycin A1 or U18666A for 24 hrs and cell killing assays were performed. As shown in Figure 3E, the cytotoxicity of the CPT-loaded P-MSNs increased significantly. These results are in line with the idea that longer retention time inside the cell enhances intracellular drug release leading to more cell killing.
In summary, our results provide convincing evidence that P-MSNs are exocytosed from cells after uptake. The exocytosis of P-MSNs is demonstrated by measuring the FITC fluorescence inside the cells through flow cytometry and by fluorescence microscopy, as well as by ICP-OES analysis. P-MSNs exocytosed from cells were recovered by using a magnet to capture iron oxide core P-MSNs. TEM analysis showed that exocytosed particles are similar in shape and appearance to particles before cellular uptake. We observed good correlation between P-MSN exocytosis and lysosomal exocytosis in different cell lines, and inhibition of lysosomal exocytosis decreased P-MSN exocytosis. Increasing the rate of lysosomal exocytosis with Ionomycin accelerated P-MSN exocytosis in A549 cells. These results suggest that P-MSNs primarily use lysosomal exocytosis to exit cells. Finally, we have shown that combining CPT-loaded P-MSNs with Bafilomycin A1 or U18666A enhances the cell killing efficacy of the nanoparticles. The rate of MSN exocytosis is important for drug delivery and this should be taken into account when designing surface modified MSNs for cancer therapy.
Experimental Section
Synthesis of Phosphonated, PEI, and Folate-Coated fluorescently-Labeled MSNs
In a typical synthesis, cetyltrimethylammonoium bromide (CTAB, 250 mg, 0.7 mmol) was mixed with NaOH solution (875 μL, 2 M) and H2O (120 mL). The mixture solution was heated to 80 °C. Fluorescein isothiocyanate (2.7 mg) was dissolved in absolute EtOH (1.5 mL) and mixed with 3-aminopropyltriethoxysilane (APTES, 6 μL) for 2 h. After the temperature had stabilized, tetraethyl orthosilicate (1.2 mL) was mixed with the ethanolic FITC-APTES solution and added to the CTAB solution. For phosphonate-coated nanoparticles, 3-(trihydroxysilylpropyl)methylphosphonate (315 μL) was added to the solution after 15 min. The solution was stirred vigorously at 80 °C for 2 h. The synthesized nanoparticles were collected by centrifugation and washed with MeOH. For PEI coating, as-synthesized nanoparticles (30 mg) were suspended in a 3 mL solution of PEI (weight 0.8 kD, 2.5 mg/mL) and ethanol. Particles were stirred for 30 minutes and washed three times with ethanol to remove excess PEI. For folate modified MSNs, folic acid (50 mg) was first dissolved in 5 mL DMSO and APTES (250 uL) was added to the solution. Next, N-hydroxysuccinimde (0.15 mg) and 1-(3-dimethylaminopropyl)-3-ethylcarbodiimide hydrochloride (0.25 mg) were added to the mixture and stirred for 2 hours. The previous solution was then added to a suspension of MSNP (100 mg) and toluene (20 mL), and stirred for 20 h at room temperature. Materials were washed twice with toluene.
Synthesis of Phosphonated, Fluorescent Iron-Core MSNs
As previously reported by C.R. Thomas et al. J. Am. Chem. Soc. 2010,[15] magnetic nanoparticles with Zn ion doped were synthesized using the method developed by Jang et al.[57] A typical synthesis to produce Zn0.4Fe2.6O4 nanoparticles is as follows: ZnCl2 (30 mg), FeCl2 (40 mg), and Fe(acac)3 (353 mg) were placed in a 50 mL three-neck round-bottom flask in the presence of surfactants (oleic acid and oleylamine) in octyl ether. The reaction mixture was heated at 300 °C for 1 h and the reaction products were cooled to room temperature. Upon addition of ethanol, a black powder precipitated and was isolated by centrifugation. The isolated nanoparticles were dispersed in toluene. Nanocrystals have 15 nm size with narrow size distribution (σ < 5%). Zinc-doped iron oxide nanocrystals were dissolved in chloroform at a concentration of 50 mg/mL. One milliliter of the iron oxide nanocrystals in chloroform was added to a solution of 100 mg cetyl trimethylammonium bromide (CTAB, Aldrich, 95%) in 5 mL of water. The mixture was sonicated and the chloroform was boiled off from the solution with rapid stirring. The aqueous CTAB stabilized zinc-doped iron oxide nanocrystals were added to an 80 °C solution of 43 mL distilled water with 350 μL of 2.0 M NaOH, and 500 μL tetraethyl orthosilicate (TEOS, Aldrich, 98%) was slowly added. After 15 minutes, 125 μL 3-(hydroxysilylpropyl) methylphosphonate was added. Following two hours of rapid stirring at 80 °C, the magnetic-core silica nanoparticles were collected by centrifugation and washed with ethanol and water. The CTAB was removed by dispersing the as-synthesized materials in a solution containing 133.3 mg ammonium nitrate (Fisher) and 50 mL 95% ethanol. This mixture was heated to 60 °C for 15 minutes, then the particles were collected by centrifugation and washed with ethanol. The fluorescent functionality for optical monitoring of the nanoparticles in cells, fluorescein isothiocyanate, was attached to the mesoporous silica framework. 3 mg fluorescein isothiocyanate (FITC, Sigma, 90%) was dissolved in 1 mL ethanol, and 12 μL 3-aminopropyltriethoxysilane (3-APTES, Aldrich, 98%) was added. This solution was reacted under nitrogen for 2 hours, then added to the 80 °C solution of aqueous sodium hydroxide. After 10 minutes, the CTAB-ZnNC solution was added, and the procedure followed in the same manner as above.
Cell Culture
The human cancer cell line A549 was obtained from American Type Culture Collection and was maintained in Dulbecco’s modified Eagle’s medium (DMEM; GIBCO) supplemented with 10% fetal bovine serum (Sigma), 1% L-glutamine, 1% penicillin and 1% streptomycin stock solutions. Human cancer cell lines MDA-MB 231 and MDA-MB 435 were a gift from Dr. Neil O’Brien at UCLA and were maintained RPMI-1640 medium (Cellgro) supplemented with 10% fetal bovine serum (Sigma). The media were changed every three days, and the cells were passaged by trypsination before confluence. The human embryonic stem cell line H9 was cultured as previously described.[58] Briefly, human embryonic stem cells were cultured in DMEM/F-12 medium supplemented with 20% Knock-out serum replacement (Gibco), 1% non-essential amino acids, 0.5% L-glutamine, 1% penicillin-streptomycin, 100 μM β-mercaptoethanol, & 4 ng/ml bFGF. hESC cultures were maintained on feeder layers of inactivated murine embryonic fibroblasts (MEFs). For nanoparticle uptake experiments hESCs were plated on Matrigel (BD Biosciences) and fed with MEF-conditioned medium.
Iron Core MSN Transmission Electron Microscopy (TEM)
Cells were seeded in a 6-well plate at a confluency of 4 × 10⁵ cells per well overnight. The next day, cells were treated with 20 μg/mL P-MSNs for two hours and then the medium was changed with fresh growth medium. After 24 hours incubation, the media from the six wells were collected and mixed in a culture flask. A NdFeB magnet was placed on the wall of the flask to immobilized the nanoparticles, the media was removed, the nanoparticles were washed with PBS and resuspended in a small volume of PBS. TEM was performed on the isolated nanoparticles.
Fluorescent Microscopy for Lysosome Staining and Golgi Apparatus Staining
The fluorescence of nanoparticles at an excitation wavelength of 488 nm was used to confirm cellular uptake of P-MSNs. The cells were incubated in an eight-well Lab-Tek chamber slide system (Nalge Nunc International) with the nanoparticles and then washed with PBS to remove the nanoparticles that did not enter cells. The cells were washed with PBS, fixed with 4% paraformaldehyde for 15 min, permeabilized with 0.2% Triton X-100 in PBS for 10 min, and blocked with 1% BSA in PBS for 1 hr. Anti-LAMP1(Abcam ab24170) antibody was added (2 μg/mL) and incubated overnight at 4° C. Staining with secondary antibody tagged with Dylight 594 (Abcam ab96885) was done for 1hr at room temperature. The cells were then stained with DAPI solution for nuclear staining and pictures were taken using a fluorescent microscope.
For Golgi apparatus staining, cells were seeded in a four-well chamber slide and treated with Exo 1 (50 μM) and Brefeldin A (5 μM) for 6 hours. Cells were prepared similar to the lysosome staining procedured previously described. Anti-golgin 97 antibody (Invitrogen CDF4) was used for staining (5 μg/mL). Staining with secondary antibody tagged with FITC was done for two hours at room temperature.
MSN Exocytosis Measurement by Flow Cytometry
Cells were seeded in a six-well plate at a confluency of 4 × 10⁵ cells per well overnight. Cells were incubated with 20 μg/mL of P-MSN (or iron core MSN) for 2 hrs, then washed with PBS and either incubated in growth media for different time points or treated with inhibitors for 6 hrs (LY294002 250 nM, Nocodazole 10 μM, Cytochalasin D 20 μM, Bafilomycin A1 100 nM). After incubation, cells were trypsinized, washed with 0.05% tryphan blue solution to decrease the background fluorescence and washed two more times with PBS. Flow cytometry was performed (UCLA Flow Cytometry Core Facilities) by measuring the green fluorescence of the cells, which corresponds to the fluorescence of the P-MSNs.
ICP-OES Analysis
A549 cells were seeded in a 6-well plate at a confluency of 4 × 10⁵ cells per well. Cells were treated with 40 μg/mL P-MSNs for two hours and then the medium was removed and the cells washed with PBS two times. Fresh growth medium was added to the cells and incubated for 24 hrs. The cell media were collected, the cells washed with 2 mL of PBS, and the PBS wash was combined with the cell media for ICP-OES analysis. In a typical ICP-OES run, cell culture washes were digested by adding an equal volume of 70% nitric acid (Aldrich), and heated at 80°C for 3 hours. Digested solutions were sonicated for 15 minutes with stirring to ensure sample homogeneity and diluted to a 5% nitric acid concentration. Runs were standardized through serial dilutions of a stock solution of 1000 ug/mL silicon in 5% nitric acid (Fisher). Samples were run on a Thermo Jarrell Ash IRIS 1000 ICP-OES instrument, and silicon concentration determined through monitoring the emission of the 251.611 nm line.
β-Hexosaminidase Assay
Cells were seeded in a twelve-well plate at a confluency of 3 × 10⁵ cells per well overnight. The medium was removed from the wells, the cells were washed with PBS and fresh medium was added to the wells. The cells were incubated for 6 hours with or without inhibitors (LY294002 250 nM, Nocodazole 10 μM, Cytochalasin D 20 μM, Bafilomycin A1 100 nM). The media (supernatant) were collected and the cells were lysed with 0.1% Triton X 100 in DMEM. The β-hexosaminidase assay was performed in a 96-well plate by mixing 50 μL of 2 mg/mL 4-nitrophenyl N-acetyl-β-D-galactosaminide in 0.1 M citrate buffer (pH 4.5) with 75 μL of supernatant or cell lysate and incubating for 1 hour at 37° C. After the incubation, 100 μL of 0.2 M borate buffer (pH 9.8) was added to the mixture to stop the reaction. The absorbance was read at 405 nm using a plate reader. Percentage values were obtained by dividing the reading from the supernatant with that of the cell lysate.
Cell Killing Assay
Cells were seeded in a 96-well plate at a confluency of 5 × 10³ cells per well overnight. The next day, cells were treated with Bafilomycin A1 (12.5 nM), U1866A (2.5 μM), CPT-loaded P-MSNs, and the combinations of P-MSN-CPT and Bafilomycin A1 or U18666A for 24 hrs. Cells were washed with PBS and incubated in DMEM with 10% WST-8 solution (Dojindo Co) for 3 hrs. The absorbance of each well was measured at 450 nM in a plate reader.
Supplementary Material
Acknowledgments
This work has been supported by the U. S. National Institutes of Health (R01 CA133697 and T32GM067555).
Footnotes
Supporting Information is available on the WWW under http://www.small-journal.com or from the author.
References
- 1.Yanes RE, Tamanoi F. Ther Deliv. 2012;3:389. doi: 10.4155/tde.12.9. [DOI] [PMC free article] [PubMed] [Google Scholar]
- 2.Slowing II, Vivero-Escoto JL, Wu CW, Lin VS. Adv Drug Deliv Rev. 2008;60:1278. doi: 10.1016/j.addr.2008.03.012. [DOI] [PubMed] [Google Scholar]
- 3.Vallet-Regi M, Ramlia A, del Real RP, Perez-Pariente J. Chem Mater. 2001;13:308. [Google Scholar]
- 4.Kresge CT, Leonowicz ME, Roth WJ, Vartuli JC, Beck JS. Nature. 1992;359:710. [Google Scholar]
- 5.Ashley CE, Carnes EC, Phillips GK, Padilla D, Durfee PN, Brown PA, Hanna TN, Liu J, Phillips B, Carter MB, Carroll NJ, Jiang X, Dunphy DR, Willman CL, Petsev DN, Evans DG, Parikh AN, Chackerian B, Wharton W, Peabody DS, Brinker CJ. Nat Mater. 2011;10:389. doi: 10.1038/nmat2992. [DOI] [PMC free article] [PubMed] [Google Scholar]
- 6.Kobler J, Moller K, Bein T. ACS Nano. 2008;2:791. doi: 10.1021/nn700008s. [DOI] [PubMed] [Google Scholar]
- 7.Lu J, Liong M, Sherman S, Xia T, Kovovich M, Nel AE, Zink JI, Tamanoi F. Nanobiotechnol. 2007;3:89. doi: 10.1007/s12030-008-9003-3. [DOI] [PMC free article] [PubMed] [Google Scholar]
- 8.Lee CH, Cheng SH, Huang IP, Souris JS, Yang CS, Mou CY, Lo LW. Angew Chem Int Ed. 2010;49:8214. doi: 10.1002/anie.201002639. [DOI] [PubMed] [Google Scholar]
- 9.He Q, Zhang Z, Gao Y, Shi J, Li Y. Small. 2009;5:2722. doi: 10.1002/smll.200900923. [DOI] [PubMed] [Google Scholar]
- 10.Meng H, Xue M, Xia T, Ji Z, Tarn DY, Zink JI, Nel AE. ACS Nano. 2011;5:4131. doi: 10.1021/nn200809t. [DOI] [PMC free article] [PubMed] [Google Scholar]
- 11.Sauer AM, Schlossbauer A, Ruthardt N, Cauda V, Bein T, Brauchle C. Nano Lett. 2010;10:3684. doi: 10.1021/nl102180s. [DOI] [PubMed] [Google Scholar]
- 12.Lu J, Liong M, Zink JI, Tamanoi F. Small. 2007;3:1341. doi: 10.1002/smll.200700005. [DOI] [PubMed] [Google Scholar]
- 13.Lu J, Choi E, Tamanoi F, Zink JI. Small. 2008;4:421. doi: 10.1002/smll.200700903. [DOI] [PMC free article] [PubMed] [Google Scholar]
- 14.Meng H, Liong M, Xia T, Li Z, Ji Z, Zink JI, Nel AE. ACS Nano. 2010;4:4539. doi: 10.1021/nn100690m. [DOI] [PMC free article] [PubMed] [Google Scholar]
- 15.Thomas CR, Ferris DP, Lee J-H, Choi E, Cho MH, Kim ES, Stoddart JF, Shin JS, Cheon J, Zink JI. J Am Chem Soc. 2010;132:10623. doi: 10.1021/ja1022267. [DOI] [PubMed] [Google Scholar]
- 16.Zhu C-L, Lu C-H, Song X-Y, Yang H-H, Wang X-R. J Am Chem Soc. 2011;133:1278. doi: 10.1021/ja110094g. [DOI] [PubMed] [Google Scholar]
- 17.Liong M, Lu J, Kovochich M, Xia T, Ruehm SG, Nel AE, Tamanoi F, Zink JI. ACS Nano. 2008;2:889. doi: 10.1021/nn800072t. [DOI] [PMC free article] [PubMed] [Google Scholar]
- 18.Mortera R, Vivero-Escoto J, Slowing II, Garrone E, Onida B, Lin VSY. Chem Commun. 2009:3219. doi: 10.1039/b900559e. [DOI] [PubMed] [Google Scholar]
- 19.Trewyn BG, Giri S, Slowing II, Lin VSY. Chem Commun. 2007:3236. doi: 10.1039/b701744h. [DOI] [PubMed] [Google Scholar]
- 20.Gary-Bobo M, Mir Y, Rouxel C, Brevet D, Hocine O, Maynadier M, Gallud A, Da Silva A, Mongin O, Blanchard-Desce M, Richeter S, Loock B, Maillard P, Morere A, Garcia M, Raehm L, Durand JO. Int J Pharm. 2012;432:99. doi: 10.1016/j.ijpharm.2012.04.056. [DOI] [PubMed] [Google Scholar]
- 21.Gary-Bobo M, Hocine O, Brevet D, Maynadier M, Raehm L, Richeter S, Charasson V, Loock B, Morere A, Maillard P, Garcia M, Durand JO. 2012;423:509. doi: 10.1016/j.ijpharm.2011.11.045. [DOI] [PubMed] [Google Scholar]
- 22.Santra S, Liesenfeld B, Dutta D, Chatel D, Batich CD, Tan W, Moudgil BM, Mericle RA. J Nanosci Nanotechnol. 2005;5:899. doi: 10.1166/jnn.2005.146. [DOI] [PubMed] [Google Scholar]
- 23.Bottini M, Cerignoli F, Mills DM, D’Annibale F, Leone M, Rosato N, Magrini A, Pellecchia M, Bergamaschi A, Mustelin T. J Am Chem Soc. 2007;129:7814. doi: 10.1021/ja070245c. [DOI] [PMC free article] [PubMed] [Google Scholar]
- 24.Vallet-Regi M, Balas F, Arcos D. Angew Chem Int Ed Engl. 2007;46:7548. doi: 10.1002/anie.200604488. [DOI] [PubMed] [Google Scholar]
- 25.Lu J, Li Z, Zink JI, Tamanoi F. Nanomedicine: NBM. 2012;8:212. doi: 10.1016/j.nano.2011.06.002. [DOI] [PMC free article] [PubMed] [Google Scholar]
- 26.Lu J, Liong M, Li Z, Zink JI, Tamanoi F. Small. 2010;16:1794. doi: 10.1002/smll.201000538. [DOI] [PMC free article] [PubMed] [Google Scholar]
- 27.Gary-Bobo M, Mir Y, Rouxel C, Brevet D, Basile I, Maynadier M, Vaillant O, Mongin O, Blanchard-Desce M, Morere A, Garcia M, Durand JO, Raehm L. Angew Chem Int Ed. 2011;50:11425. doi: 10.1002/anie.201104765. [DOI] [PubMed] [Google Scholar]
- 28.Mamaeva V, Rosenholm JM, Bate-Eya LT, Bergman L, Peuhu E, Duchanoy A, Fortelius LE, Landor S, Toivola DM, Linden M, Sahlgren C. Mol Ther. 2011;19:1538. doi: 10.1038/mt.2011.105. [DOI] [PMC free article] [PubMed] [Google Scholar]
- 29.Bagwe RP, Hilliard LR, Tan W. Langmuir. 2006;22:4357. doi: 10.1021/la052797j. [DOI] [PMC free article] [PubMed] [Google Scholar]
- 30.Slowing I, Trewyn BG, Lin VS. J Am Chem Soc. 2006;128:14792. doi: 10.1021/ja0645943. [DOI] [PubMed] [Google Scholar]
- 31.Ferris DP, Lu J, Gothard C, Yanes R, Thomas CR, Olsen JC, Stoddart JF, Tamanoi F, Zink JI. Small. 2011;7:1816. doi: 10.1002/smll.201002300. [DOI] [PMC free article] [PubMed] [Google Scholar]
- 32.Gan Q, Dai D, Yuan Y, Qian J, Sha S, Shi J, Liu C. Biomed Microdevices. 2012;14:259. doi: 10.1007/s10544-011-9604-9. [DOI] [PubMed] [Google Scholar]
- 33.Huang X, Teng X, Chen D, Tang F, He J. Biomaterials. 2010;31:438. doi: 10.1016/j.biomaterials.2009.09.060. [DOI] [PubMed] [Google Scholar]
- 34.Slowing II, Vivero-Escoto JL, Zhao Y, Kandel K, Peeraphatdit C, Trewyn BG, Lin VS. Small. 2011;7:1526. doi: 10.1002/smll.201002077. [DOI] [PubMed] [Google Scholar]
- 35.Huh S, Wiench JW, Yoo JC, Pruski M, Lin VSY. Chem Mater. 2003;15:4247. [Google Scholar]
- 36.Hom C, Lu J, Liong M, Luo H, Li Z, Zink JI, Tamanoi F. Small. 2010;6:1185. doi: 10.1002/smll.200901966. [DOI] [PMC free article] [PubMed] [Google Scholar]
- 37.Huang DM, Hung Y, Ko BS, Hsu SC, Chen WH, Chien CL, Tsai CP, Kuo CT, Kang JC, Yang CS, Mou CY, Chen YC. FASEB J. 2005;19:2014. doi: 10.1096/fj.05-4288fje. [DOI] [PubMed] [Google Scholar]
- 38.Hsiao JK, Tsai CP, Chung TH, Hung Y, Yao M, Liu HM, Mou CY, Yang CS, Chen YC, Huang DM. Small. 2008;4:1445. doi: 10.1002/smll.200701316. [DOI] [PubMed] [Google Scholar]
- 39.Liu HM, Wu SH, Lu CW, Yao M, Hsiao JK, Hung Y, Lin YS, Mou CY, Yang CS, Huang DM, Chen YC. Small. 2008;4:619. doi: 10.1002/smll.200700493. [DOI] [PubMed] [Google Scholar]
- 40.Gerasimenko JV, Gerasimenko OV, Petersen OH. Curr Biol. 2001;11:R971. doi: 10.1016/s0960-9822(01)00577-2. [DOI] [PubMed] [Google Scholar]
- 41.Castino R, Demoz M, Isidoro C. J Mol Recognit. 2003;16:337. doi: 10.1002/jmr.643. [DOI] [PubMed] [Google Scholar]
- 42.Carini R, Castino R, De Cesaris MG, Splendore R, Demoz M, Albano E, Isidoro C. J Cell Sci. 2004;117:1065. doi: 10.1242/jcs.00923. [DOI] [PubMed] [Google Scholar]
- 43.Rodriguez A, Webster P, Ortego J, Andrews NW. J Cell Biol. 1997;137:93. doi: 10.1083/jcb.137.1.93. [DOI] [PMC free article] [PubMed] [Google Scholar]
- 44.Feng Y, Yu S, Lasell TKR, Jadhav AP, Macia E, Chardin P, Melancon PP, Roth M, Mitchison T, Kirchhausen T. PNAS. 2003;100:6469. doi: 10.1073/pnas.0631766100. [DOI] [PMC free article] [PubMed] [Google Scholar]
- 45.Peyroche A, Antonny B, Robineau S, Acker J, Cherfils J, Jackson CL. Mol Cell. 1999;3:275. doi: 10.1016/s1097-2765(00)80455-4. [DOI] [PubMed] [Google Scholar]
- 46.Dasher C, Balch WE. J Biol Chem. 1994;269:1437. [PubMed] [Google Scholar]
- 47.Strous GJ, Kerkhof PV, Meer GV, Rijnboutt S, Stoorvogel W. J Biol Chem. 1993;268:2341. [PubMed] [Google Scholar]
- 48.Meng H, Xue M, Xia T, Zhao YL, Tamanoi F, Stoddart JF, Zink JI, Nel AE. J Am Chem Soc. 2010;132:12690. doi: 10.1021/ja104501a. [DOI] [PMC free article] [PubMed] [Google Scholar]
- 49.Cordonnier MN, Dauzonne D, Louvard D, Coudier E. Mol Biol Cell. 2001;12:4013. doi: 10.1091/mbc.12.12.4013. [DOI] [PMC free article] [PubMed] [Google Scholar]
- 50.Ono K, Wang X, Han J. Mol Cell Biol. 2001;21:8276. doi: 10.1128/MCB.21.24.8276-8288.2001. [DOI] [PMC free article] [PubMed] [Google Scholar]
- 51.Rodriguez A, Martinez I, Chung A, Berlot CH, Andrews NW. J Biol Chem. 1999;274:16754. doi: 10.1074/jbc.274.24.16754. [DOI] [PubMed] [Google Scholar]
- 52.Flannery AR, Czibener C, Andrews NW. J Biol Chem. 2010;191:599. doi: 10.1083/jcb.201003021. [DOI] [PMC free article] [PubMed] [Google Scholar]
- 53.Martinez I, Chakrabarti S, Hellevik T, Morehead J, Fowler K, Andrews NW. J Cell Biol. 2000;148:1141. doi: 10.1083/jcb.148.6.1141. [DOI] [PMC free article] [PubMed] [Google Scholar]
- 54.Lange Y, Ye J, Steck TL. J Biol Chem. 1998;273:18915. doi: 10.1074/jbc.273.30.18915. [DOI] [PubMed] [Google Scholar]
- 55.Sparrow SM, Carter JM, Ridgway ND, Cook HW, Byers DM. Neurochem Res. 1999;24:69. doi: 10.1023/a:1020932130753. [DOI] [PubMed] [Google Scholar]
- 56.Lloyd-Evans E, Morgan AJ, He X, Smith DA, Elliot-Smith E, Sillence DJ, Churchill GC, Schuchman EH, Galione A, Platt FM. Nature Med. 2008;14:1247. doi: 10.1038/nm.1876. [DOI] [PubMed] [Google Scholar]
- 57.Jang JT, Nah H, Lee JH, Moon SH, Kim MG, Cheon J. Angew Chem Int Ed. 2009;48:1234. doi: 10.1002/anie.200805149. [DOI] [PubMed] [Google Scholar]
- 58.Damoiseaux R, Sherman SP, Alva JA, Peterson C, Pyle AD. Stem Cells. 2009;27:533. doi: 10.1634/stemcells.2008-0596. [DOI] [PMC free article] [PubMed] [Google Scholar]
Associated Data
This section collects any data citations, data availability statements, or supplementary materials included in this article.