Abstract
Non-ergodic as well as ergodic activation methods are capable of maintaining the integrity of base pairs during the top-down analysis of nucleic acids. Here, we investigate the significance of this characteristic in the investigation of higher-order structures of increasing complexity. We show that cognate fragments produced by typical backbone cleavages may not be always detected as separate sequence ions, but rather as individual products that remain associated through mutual pairing contacts. This effect translates into unintended masking of cleavage events that take place in double-stranded regions, thus leading to the preferential detection of fragments originating from unpaired regions. Such effect is determined by the stability of the weak non-covalent association between complementary stretches, which is affected by base composition, length of the double-stranded structure, and charge of the precursor ion selected for analysis. Although such effect may prevent the achievement of full sequence coverage for primary structure determination, it may provide the key to correctly differentiate double- versus single-stranded regions, in what could be defined as gas-phase footprinting experiments. In light of the critical role played by base pairs in defining the higher-order structure of nucleic acids, these approaches will be expected to support an increased utilization of mass spectrometry for the investigation of nucleic acid structure and dynamics.
Keywords: Top-down, ECD, EDD, IRMPD, nucleic acids, base-pairing, higher-order structure
Introduction
The higher-order structure of nucleic acids is largely defined by base pairing interactions. The annealing of contiguous sequences determines elements of secondary structure, whereas that of distal stretches delineates their tertiary structure. For this reason, any technology capable of revealing the identity and correct position of paired nucleotides could in principle provide a platform for solving the 3D structure of these biopolymers. The observation that soft ionization techniques can preserve base pairing during MS analysis1-4 has opened the door for the possible application of gas-phase methods to the structural elucidation of nucleic acids. Taking advantage of this intrinsic capability, we are investigating whether activation techniques developed to obtain the primary structure (i.e., sequence) of nucleic acids5-7 could be applied to discriminate paired versus unpaired nucleotides, thus enabling the direct analysis of their higher-order structure.
Non-ergodic activation methods employed for the top-down analysis of biopolymers have been proven capable of inducing fragmentation of the covalent backbone, while simultaneously retaining the weak non-covalent interactions that stabilize structure folding and ligand binding. During electron capture dissociation (ECD)8 of polypeptides, which involves the recombination of low-energy (<0.2 eV) electrons with multiply protonated precursor ions, the preservation of intramolecular interactions can produce fragmentation patterns consistent with the spatial organization of folded species.9, 10 In similar fashion, intermolecular contacts can be retained upon electron transfer dissociation (ETD),11 a related activation method that relies on anionic vehicles for delivering electrons to multi-cationic precursors. This property has enabled the identification of interface residues involved in subunit association.12 The stabilizing effects of intramolecular interactions have been invoked to explain the inability of obtaining full sequence information from oligonucleotide samples by electron detachment dissociation (EDD),13, 14 a technique in which multi-anionic precursors are irradiated with more energetic electrons (>10 eV).15 Although the electronic processes associated with these activation methods are still debated, their common denominator consists of the formation of radical species, followed by immediate cleavage of adjacent covalent bonds. The non-ergodic nature and short time scale (<10-12 s) of these events minimize the intramolecular redistribution of vibrational energy, which leaves local non-covalent bonds largely unaffected.9, 10
Ergodic activation methods operate on longer time scales, involve energy redistribution, and tend to disrupt weak non-covalent interactions. Submitted to collision-induced dissociation (CID),16 double-stranded structures can undergo base pair disruption and strand separation. Duplex dissociation was followed as a function of collision energy to generate gas-phase melting curves that mimicked very closely thermal denaturation curves obtained in solution.17, 18 Based on the ability of trapped ions to absorb infrared photons from their surroundings, blackbody infrared radiative dissociation (BIRD)19 was employed to study the stability of complementary and non-complementary DNA duplexes in a solvent-free environment.20 Infrared multiphoton dissociation (IRMPD),21 which can be accomplished by irradiating precursor ions with a CO2 laser, was shown capable of inducing strand separation and ligand ejection from selected drug-DNA duplex complexes.22 For each of these activation methods, dissociation of non-covalent interactions is typically accompanied, or overshadowed, by the concomitant cleavage of covalent bonds, which results in loss of nucleobases and fragmentation of the phosphodiester backbone. In most cases, the presence of relatively stable non-covalent interactions represents an obstacle to the observation of the complete fragment series that provide the sought-after sequence information.5-7 For this reason, efforts have been dedicated to exploring the interplay between kinetic and thermodynamic factors that determine the prevalence of covalent versus non-covalent dissociation.23
Capitalizing on the behavior of base pairing and ligand interactions upon gas-phase activation, MS-based technologies will be expected to play an increasing role in the investigation of the structure and dynamics of nucleic acids. In this direction, we have employed sustained off-resonance irradiation (SORI)24 CID to characterize the unique structural features exhibited by DNA-RNA hybrid duplexes25, 26 and RNA stemloop structures27, 28 involved in viral replication. The observation that backbone fragmentation could be inhibited by the contact of non-covalent ligands27 prompted us to propose the utilization of classic nucleic acid ligands as non-covalent structural probes.28 This general strategy relies on firm knowledge of the binding profiles of such ligands and counts on the ability to locate their specific sites by top-down MS. We have also shown that SORI-CID can be effectively employed to interrogate the conformational state of RNA complexes, such as those involved in the dimerization and packaging of the HIV-1 genome.29, 30 In this case, isomeric dimers that could not be recognized from their identical molecular mass were readily distinguished on the basis of the different gas-phase stabilities afforded by their interstrand pairing.30 We are now investigating the possibility of combining non-ergodic and ergodic techniques available in Fourier transform ion cyclotron resonance (FTICR)31, 32 MS to enable the differentiation of paired versus unpaired nucleotides, which could afford the experimental data necessary to elucidate higher-order structures of nucleic acids.
Materials and Methods
All nucleic acid samples employed in the study (Scheme 1) were purchased from IDT (Coralville, IA) and desalted by ultrafiltration against 100 mM ammonium acetate (pH adjusted to 7.0). Each construct was heat-refolded to obtain the desired conformation by taking the solution to 95°C for 5 min in a water-bath, then allowing it to return slowly to room temperature. Stock concentrations were determined by UV absorbance using molar extinction coefficients calculated from the respective sequences. Immediately before analysis, samples were diluted by addition of 100 mM ammonium acetate and a 10% volume of 2-propanol to obtain a final 1μM concentration. Each analysis typically required 2μL of sample solution.
Scheme 1.
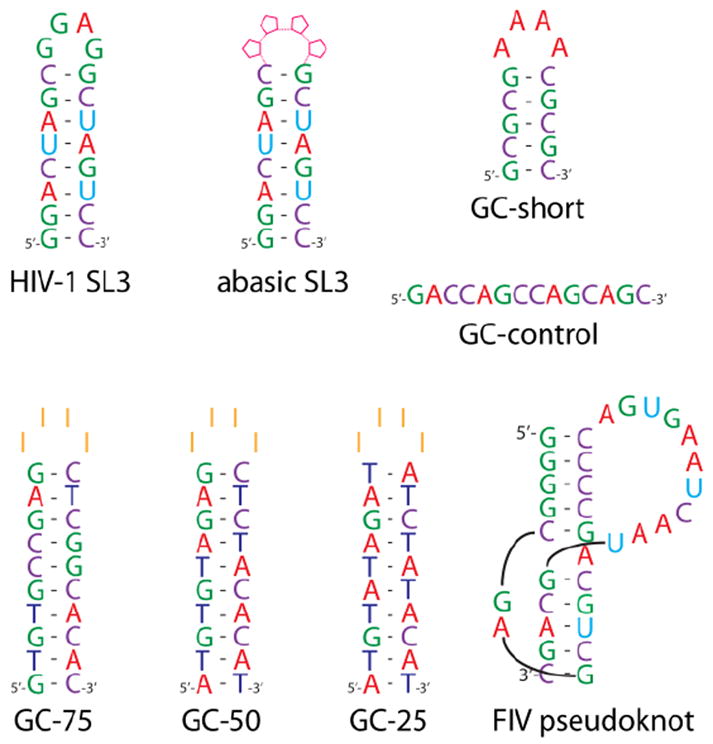
Nucleic acid constructs employed in the study. In abasic SL3, the four loop positions were replaced with deoxy-ribonucleotides devoid of nucleobase.
All experiments were carried out on a Bruker Daltonics (Billerica, MA) Apex Qe FTICR mass spectrometer equipped with a 12T superconducting magnet and an Apollo II electrospray source that was modified with a resistively heated metal capillary. Analyses were performed in nanospray mode using non-coated quartz emitters that were held at approximately 1100V relative to the capillary entrance. Selected precursor ions were initially isolated in the mass selective quadrupole situated at the front end of this hybrid instrument. They were then immediately transmitted to the FTICR cell to complete the different top-down experiments. ECD of positively charged precursors was accomplished by using electrons emitted from a hollow dispenser cathode heated by supplying a current of 1.5A, and then accelerated into the cell by a potential of up to 6.5V. In similar fashion, EDD was performed in negative ion mode by using electrons from the cathode operating at 1.7A and up to 23V acceleration. IRMPD was completed by shining laser pulses of up to 50msec through a BaF2 window in the back of the cell. The source was a Synrad (Mukilteo, WA) CO2 laser producing infrared light of 1057nm wavelength and up to 25w power.
Experiments combing consecutive stages of activation were carried out by performing SORI-CID immediately after the initial IRMPD step, without intervening precursor ion isolation. Best results were obtained by applying irradiation frequencies that were 600 to 2000Hz below that of the precursor. Mild activation regimes were obtained by applying the off-resonant pulse for about 250msec using 26 to 31dB attenuation of the maximum power output allowed by the hardware. For comparison purposes, typical experiments designed to obtain sequence information rely instead on pulses generated with 17 to 20db attenuation of maximum power. Argon was used as the collision gas in pulsed bursts of 100-250ms, which resulted in momentary increases from 1×10-11 to 1×10⁻⁷ mbar of the background pressure measured by the instrument gauge located underneath the ion optics. No attempt was made to determine the actual pressure within the FTICR cell. Typical product ion spectra consisted of the average of 50 to 100 acquisitions.
Data processing and interpretation were respectively carried out by using DataAnalysis v4.0 (Bruker Daltonics) and Mongo Oligo Mass Calculator v2.06,33 which is hosted at http://rna-mdb.cas.albany.edu/RNAmods/masspec/mongo.htm by the RNA Institute of the University at Albany. For the evaluation of loop versus stem fragmentation, signals corresponding to I-, II- and III- (491.0, 805.1, and 1119.1 m/z, respectively) were selected to represent the incidence of loop cleavages, whereas those corresponding to [a3-B]-, w3-, [a5-B]-, and w5- (714.1, 923.2, 1347.2 or 1363.2, and 1510.3 or 1525.3 or 1540.3 m/z, respectively) were employed for stem events. The relative intensities of all the isotopic species detected for each fragment were summed together, then the results for loop or stem species were pooled separately. Owing to the fact that all the representative fragments exhibited the same charge, it was not necessary to normalize the relative intensities by the respective charge state. It has been demonstrated that utilizing relative intensities of fully resolved isotopic signals is equivalent to employing the corresponding peak areas for most quantification purposes in FTICR mass spectrometry.34 The value obtained from each pool was divided by their sum to express the separate contributions in percent form.
Results and Discussion
Gas-phase dissociation of structured constructs
Non-ergodic activation methods were initially employed for the top-down analysis of RNA structures involved in the lifecycle of retroviruses responsible for infectious diseases (Scheme 1). Representative results are provided in Figure 1a, which displays the spectrum obtained by ECD activation of the 4+ charge state of SL3 hairpin. Its examination immediately reveals that the predominant products originated from the neutralization of up to two positive charges, which was induced by recombination of two electrons with the cationic precursor. Only a few fragments were detected in the low range and near the charge-neutralized products. Their masses correspond to structures produced by loss of G nucleobase and backbone cleavages resulting in mono- and di-nucleotide species. The fact that G nucleotides are located both at the end of the double-stranded stem and in the single-stranded loop made it impossible to unambiguously assign the origin of such losses. For this reason, an analogue was analyzed in which the loop bases were replaced with abasic nucleotides (abasic SL3, Scheme 1). Under the same experimental conditions, the analogue exhibited the loss of abasic fragments, which clearly traced the cleavage events to the loop region of the construct (Figure 1b). Similar outcomes were observed when these RNA samples were analyzed in negative ion mode and submitted to EDD activation. Although nucleic acid analytes can be detected in positive ion mode under appropriate conditions, their analysis is typically completed in negative ion mode to take advantage of their highly charged phosphate groups. In this case, electron detachment from the anionic precursors provided charge-reduced species with very limited fragmentation (not shown). These results were consistent with those reported by Mo and Håkannson for DNA oligonucleotides of similar length and charging.14
Figure 1.
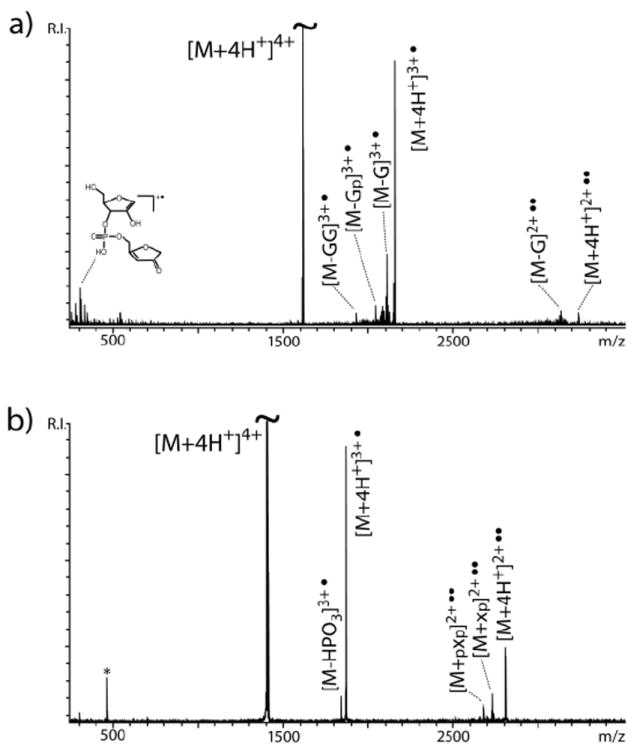
ECD product ion spectra of a) SL3 RNA and b) abasic SL3. The letter p indicates a phosphate group; x indicates an abasic nucleotide; * indicates noise produced by frequency harmonics.
Ergodic activation methods are generally expected to possess greater ability to generate characteristic backbone fragments that are consistent with the primary structure of the analyte under investigation. Fulfilling this prediction, IRMPD activation of the 4- charge state of SL3 produced typical c and y fragments by cleavage of the 5’ P-O bond (Figure 2, see ref. 6 for systematic nomenclature). Annotating the fragmentation events on the hairpin structure helped appreciate the fact that these ion series are not complete and do not cover the full extent of the RNA sequence (Figure 2 inset and Table 1). A careful examination of the experimental data revealed the presence of numerous internal fragments corresponding to losses from the GGAG loop of the hairpin structure. At the same time, the observed sequence ions (i.e., c and y) did not appear to be distributed over the entire length of the stem, but were limited to its terminal stretches. Taken together, these results suggest a greater susceptibility to fragmentation by single-stranded nucleotides located either in loop regions, or at the end of helical structures that may be momentarily destabilized by characteristic base-pair dynamics commonly described as “fraying” or “breathing.”
Figure 2.
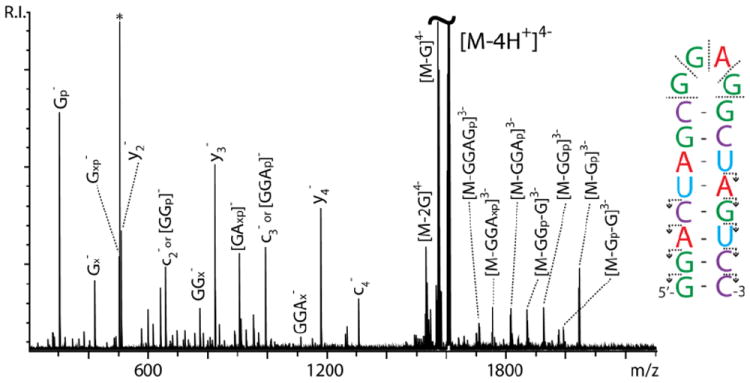
IRMPD product ion spectrum provided by SL3 RNA. Refer to citation 6 for the systematic nomenclature of sequence ion series. The letter p indicates a phosphate group; x indicates a base-loss product; * indicates noise. In the inset, the direction of the arrows points toward the end of the construct contained by a given fragment. Absence of arrow indicates internal fragments that do not contain construct ends.
Table 1.
Summary of product ions obtained by submitting SL3 RNA to IRMPD and IRMPD/ SORI-CID. The list includes typical series ions, as well as internal fragments. Expected mass over charge ratios (m/z) were calculated from the corresponding monoisotopic masses.
| Product ion | Calculated m/z | Observed by IRMPD (Fig. 2) | Observed by IRMPD / SORI-CID (Fig. 5) |
|---|---|---|---|
| c1- | 344.039 | 344.046 | 344.040 |
| y2- | 547.118 | 547.129 | 547.119 |
| c2- | 689.086 | 689.104 | 689.087 |
| y3- | 853.143 | 853.161 | 853.144 |
| c3- | 1018.138 | 1018.155 | 1018.139 |
| y4- | 1198.190 | 1198.207 | 1198.191 |
| c4- | 1323.179 | 1323.197 | 1323.179 |
| y5- | 1527.242 | 1527.261 | 1527.243 |
| c52- | 814.098 | - | 814.099 |
| y62- | 916.129 | - | 916.130 |
| c62- | 978.624 | - | 978.625 |
| y72- | 1068.650 | - | 1068.651 |
| c72- | 1151.148 | - | 1151.149 |
| y82- | 1241.174 | - | 1241.176 |
| c82- | 1303.668 | - | 1303.669 |
| y92- | 1413.697 | - | 1413.697 |
| c92- | 1476.192 | - | 1476.193 |
| y102- | 1578.223 | - | 1578.227 |
| c103- | 1098.808 | - | 1098.808 |
| y113- | 1166.828 | - | 1166.830 |
| c113- | 1208.492 | - | 1208.494 |
| y123- | 1281.844 | - | 1281.845 |
| c123- | 1323.507 | - | 1323.510 |
| y133- | 1383.525 | - | 1383.521 |
| c133- | 1438.523 | - | 1438.522 |
| y143- | 1498.540 | - | 1498.543 |
| c143- | 1540.203 | - | 1540.206 |
| y153- | 1608.224 | - | 1608.228 |
| y164- | 1282.422 | - | 1282.512 |
| Gp- | 344.039 | 344.046 | 344.040 |
| Gx- | 458.071 | 458.082 | 458.082 |
| Gxp- | 538.038 | 538.052 | 538.039 |
| GGp- | 689.086 | 689.104 | 689.088 |
| GGx- | 803.119 | 803.147 | 803.121 |
| GAxp- | 867.090 | 867.122 | - |
| GGAp- | 1018.138 | 1018.155 | 1018.139 |
| GGAx- | 1132.172 | 1132.223 | - |
| [M - GGAGp]3- | 1704.359 | 1704.374 | - |
| [M - GGAxp]3- | 1759.329 | 1759.339 | - |
| [M - GGAp]3- | 1819.375 | 1819.383 | - |
| [M - GAxp]3- | 1874.364 | 1874.381 | - |
| [M - GGp -G]3- | 1878.701 | 1878.716 | - |
| [M - GGp]3- | 1929.059 | 1929.064 | - |
| [M - Gp -G]3- | 1993.717 | 1993.725 | - |
| [M - Gp]3- | 2044.067 | 2044.092 | - |
Significance of structural context
The apparent structure-specific effects suggested by both the ECD/EDD and IRMPD data were further investigated by utilizing relatively short DNA oligonucleotides designed ad hoc (Scheme 1). In these constructs, different types of nucleotides were segregated in specific regions to facilitate tracing the origin of cleaved products and to enable direct correlations with the respective structural contexts. When the GC-short hairpin was activated by IRMPD, the predominant formation of a-B and w fragments was observed, corresponding to the cleavage of the 3’ C-O bond (Figure 3a, see ref. 6 for systematic nomenclature). The fragments carried charges ranging from 1- to 4-, the precursor’s charge state. In this case, the characteristic ion series covered the entire extent of the hairpin structure, thus providing full sequence coverage. No evidence was noted for preferential fragmentation patterns. These results matched those obtained from a construct sharing the same number of nucleotides, but devoid of any putative secondary structure (GC-control, Figure 3b). However, a different outcome was observed when progressively lower charge states were selected for activation. For instance, the 3- charge state of GC-short displayed an appreciable decrease of sequence ions (i.e., a-B and w) and a corresponding increase of internal fragments, the majority of which included adenine nucleotides (Figure 4a). This trend was even more accentuated for the 2- charge state, which displayed almost exclusively internal fragments under the same experimental conditions (Figure 4b). In contrast, the lower charge states of GC-control provided no remarkable variations from the results obtained from the 4- precursor (Figure 3b), with well-distributed detection of sequence ions across the board (not shown). In these experiments, the prominent detection of A-containing internal fragments, which place the cleavage events in the loop region, should be considered in the backdrop of the simultaneous reduction of G- and C-containing fragments from the stem of the hairpin. The excellent correlation between the precursor charge state and the decreased incidence of stem fragmentation is consistent with the expected effects of Coulombic repulsion on possible strand separation (or “unzipping”) dynamics of double-stranded structures, which increases with the charge state.17 The loss of G and C nucleobases, which persisted also at lower charge states, could be attributed to terminal base-pairs affected by helix “fraying.”
Figure 3.
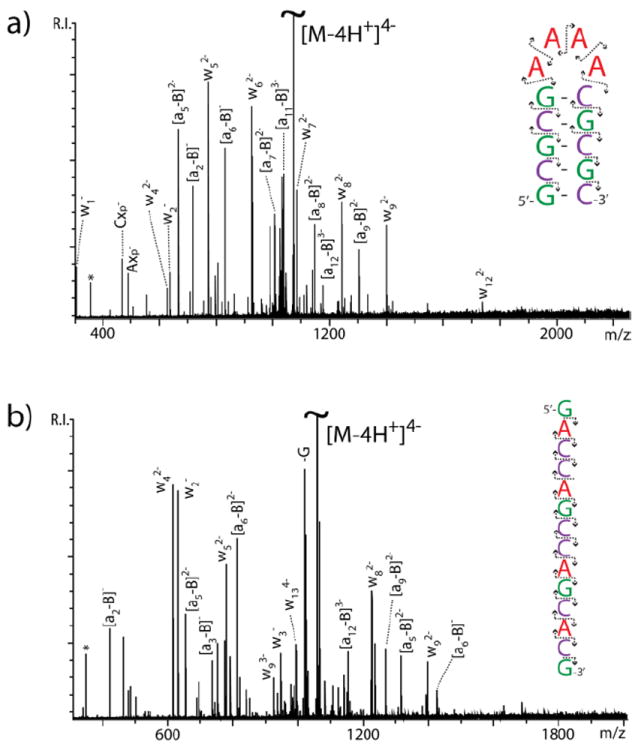
IRMPD product ion spectra obtained from the 4- charge state of a) GC-short and b) GC-control. Refer to citation 6 for the systematic nomenclature of sequence ion series. The asterisk * indicates noise. In the insets, the direction of the arrows points toward the end of the construct contained by a given fragment.
Figure 4.
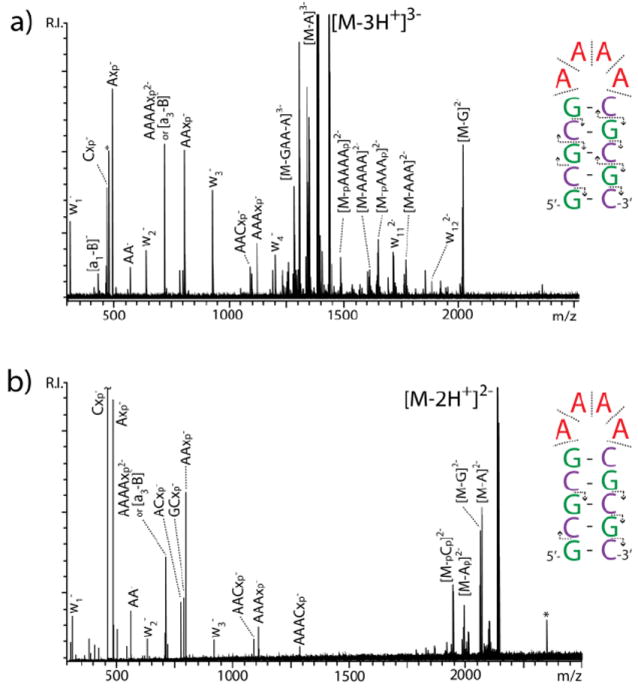
IRMPD product ion spectra obtained from a) the 3- charge state and b) the 2- of GC-short. The asterisk * indicates noise. In the insets, the direction of the arrows points toward the end of the construct contained by the fragment. Absence of arrow indicates internal fragments that do not contain construct ends.
The influence of stem stability on the balance between loop and stem events was investigated by analyzing analogues with different base composition. A series of constructs of identical length was designed, which shared a conserved loop consisting of four inosines (I), but included stems of different GC content (Scheme 1). The comparison was carried out by monitoring three representative fragments from either the loop or the stem region, which were obtained by activating the 4- precursor ions under the same experimental conditions. The relative intensities for each set were pooled and then divided by their sum to express the different contributions in percentage terms (see Materials and Methods). Plotted against the respective GC content, the contributions showed an increasing imbalance in favor of loop cleavage as the number of GC base-pairs increased (Figure 5). Not surprisingly, this trend tracked very closely the increase of melting temperature (tm) exhibited by the stems in the series. Analogous results were obtained by analyzing series in which tm was increased by extending the length of the double-stranded region, thus further supporting the observation that fragmentation patterns are greatly influenced by the stability of underlying base-pairing interactions.
Figure 5.
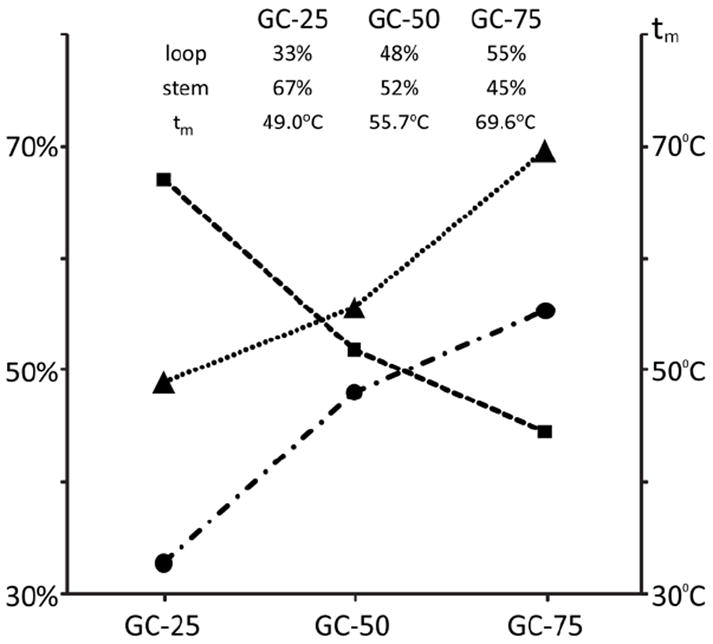
Effects of GC content on the balance between loop and stem fragmentation. The percent contribution of representative loop species are marked with squares, those of stem species with circles. Triangles mark the melting temperatures of the respective constructs.
Effects of base pairing on dissociation patterns
Explaining the apparent inhibitory effects induced by base pairing must account for the fact that hydrogen bonding and π-stacking interactions involve functional groups that are distal to cleaved phosphodiester bonds. From a mechanistic point of view, their situation discourages a direct cause-effect rationalization. The initial loss of nucleobase by dissociation of the N-glycosidic bond is considered a necessary prelude to backbone cleavage, at least in DNA, which leads to the formation of a-B fragments.35-37 Participation of the nitrogen base in hydrogen bonding and π-stacking interactions could possibly stabilize the N-glycosidic bond, thus preventing the loss that triggers the subsequent chain of events. However, the inhibitory effects are prominent also for RNA analytes, the dissociation of which is decoupled from the loss of nucleobase to produce typical c and y fragments.38-40 It is possible that, in indirect fashion, base pairing may not inhibit regular cleavage processes at all, but may only mask their detection by keeping the ensuing products associated in individual complexes that are observed as whole. The increased stem fragmentation obtained from constructs of lower tm and precursors of higher charge state is consistent with the ability of such species to dissociate during the analysis.
We tested this hypothesis by implementing a modified experimental design in which a supplemental activation step was inserted immediately after the main activation, with the intent of promoting the dissociation of non-covalent interactions that may still hold together the initial cleavage products. For example, the data in Figure 6 were obtained from the 5- charge state of SL3, which was initially activated by IRMPD, then submitted to gentle SORI-CID with no intervening isolation step (see Materials and Methods). Abundant sequence ions were readily recognizable, whereas no significant internal fragments were detected (Table 1). In contrast, no product ions were obtained when IRMPD was turned off to verify whether the selected SORI-CID conditions would lead by themselves to similar fragmentation. As shown by the secondary structure annotation, the cleavage events were not concentrated in a particular region, but were instead distributed over the entire construct to provide complete sequence coverage (Figure 6 inset). In particular, it is important to note the absence of the prominent species corresponding to the loss of sizeable sections of the loop, which were observed instead in the experiments devoid of the additional activation step (Table 1). This absence can be explained with the detection in their place of sequence ions corresponding to the complementary strands that had been held together in annealed products. For example, if the cleaved section that formed [M-GGp]3- by IRMPD (Figure 3) corresponded to guanine 9 and 10 of the construct, then the remaining strands would produce the c8- and y102- fragments upon dissociation of their mutual base pairing (Figure 6 inset). These results indicate that the non-covalent association between cleaved strands can be effectively disrupted by a combination of additional activation and increased Coulombic repulsion.
Figure 6.
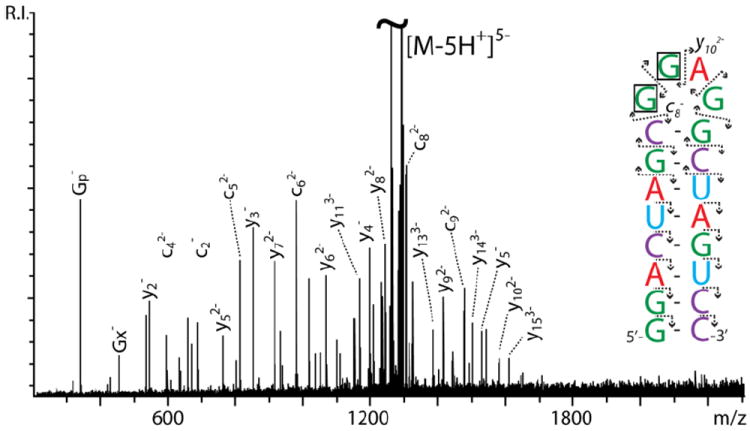
Product ion spectrum obtained from SL3 RNA by IRMPD activation, followed by gentle SORI-CID dissociation. In the inset, the direction of the arrows points toward the end contained by a fragment. The loss of the boxed nucleotides could provide either the c8- and y102- fragments detected here, or the [M-GGp]3- species observed in Figure 2.
The masking effects introduced by base pairing are expected to become more prominent as a function of the complexity of the structures under examination. This prediction is substantiated in the results afforded by the top-down analysis of the ribosomal frameshifting pseudoknot of feline immunodeficiency virus (FIV). Pseudoknots are tertiary structures stabilized by the intramolecular annealing of complementary sequences, which defines at least two distinct paired regions delimited by two or more unpaired stretches (Scheme 1). Submitted to IRMPD, the 6- charge state of FIV pseudoknot produced abundant fragmentation over a broad range (Figure 7). However, with only a few exceptions, the signals could not be readily assigned to sequence ion series that, by definition, must include either the 5’- or the 3’-end of the RNA sequence. Instead, the vast majority corresponded to internal fragments originating from the cleavage of single-stranded loops, somewhat extending into adjacent regions affected by partial “fraying” effects (Figure 7 inset). The fragments detected in the high m/z range (e.g., [M-Gp]5-, [M-GAp]5-, etc.) are consistent with the cleavage of the phosphodiester backbone in at least two points of a loop region, which would leave the resulting products associated through their paired contacts. Based on the apparent conservation of base-paring interactions, these product ions could favorably compare with the type II fragments described by Gabelica and De Pauw for DNA duplexes, which resulted from cleavage of the terminal ends of their partially “unzipped” strands.23
Figure 7.
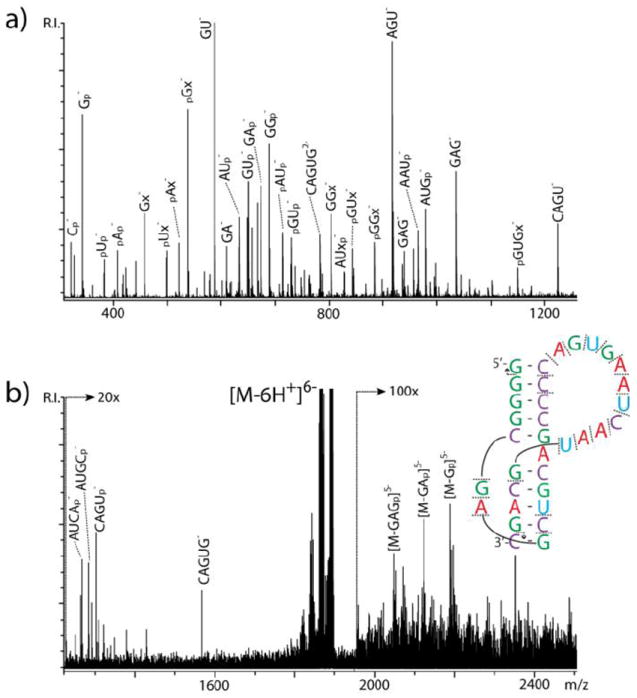
IRMPD product ion spectra obtained from FIV pseudoknot. Panel a) and b) show different regions of the same spectrum with increased magnification. The letter p indicates a phosphate group; x indicates a base-loss product; * indicates noise. In the inset, the direction of the arrows points toward the end contained by a fragment. Absence of arrow indicates internal fragments that do not contain construct ends.
Conclusions
The data presented here clearly support the existence of masking effects induced by base pairing interactions, which may prevent the observation of the full extent of fragmentation produced by complex nucleic acid structures. The fact that qualitatively similar results were obtained from both non-ergodic and ergodic methods indicates that such effects are independent of the type of activation employed, which is expected instead to affect their degree. Under appropriate conditions, the overall outcome can be the preferential observation of fragments originating from the unpaired regions of the substrate of interest. This apparent selectivity is influenced by the stability of the intervening double-stranded regions, which is a function of the number of interstrand hydrogen bonds (greater for GC than for AT/U pairs) and π-stacking interactions (greater for longer uninterrupted helices).
The ability to positively identify single-stranded regions could open the door for the utilization of these approaches to perform gas-phase footprinting of nucleic acids. The limited availability of structural information represents a major barrier to completing the functional annotation of the human genome, which consists mostly of non-protein coding sequences and, thus, cannot be classified directly on the basis of corresponding products. However, complex nucleic acid substrates are characterized by structural motifs involving a variety of interactions that differ substantially from the canonic Watson-Crick pairing considered here.41 The practical application of top-down MS to elucidate higher-order structures will require establishing the rules for the formation of informative internal fragments from such motifs. In order to achieve this goal, further studies will be necessary to reach a greater understanding of the factors that determine the fate of paring interactions during gas-phase activation and fragmentation.
Acknowledgments
Support from The RNA Institute and the College of Arts and Sciences of University at Albany (SUNY) and from the National Institutes of Health (GM064328-11) is gratefully acknowledged.
Abbreviations
- 3D
three dimensional
- MS
mass spectrometry
- ECD
electron capture dissociation
- ETD
electron transfer dissociation
- CID
collision-induced dissociation
- BIRD
blackbody infrared radiative dissociation
- IRMPD
infrared multiphoton dissociation
- DNA
deoxyribonucleic acid
- SORI
sustained off-resonance irradiation
- RNA
ribonucleic acid
- HIV-1
human immunodeficiency virus type 1
- FTICR
Fourier transform ion cyclotron resonance
- FIV
feline immunodeficiency virus
- UV
ultraviolet
- SL3
stemloop 3
Footnotes
Publisher's Disclaimer: This is a PDF file of an unedited manuscript that has been accepted for publication. As a service to our customers we are providing this early version of the manuscript. The manuscript will undergo copyediting, typesetting, and review of the resulting proof before it is published in its final citable form. Please note that during the production process errors may be discovered which could affect the content, and all legal disclaimers that apply to the journal pertain.
References
- 1.Ganem B, Li Y-T, Henion JD. Tetrahedron Lett. 1993;34:1445–1448. [Google Scholar]
- 2.Light-Wahl KJ, Springer DL, Winger BE, Edmonds CG, Camp DG, II, Thrall BD, Smith RD. J Am Chem Soc. 1993;115:803–804. [Google Scholar]
- 3.Fabris D, Wu Z, Fenselau C. J Mass Spectrom. 1995;30:140–143. [Google Scholar]
- 4.Lecchi P, Pannell LK. J Am Soc Mass Spectrom. 1995;6:972–975. doi: 10.1016/1044-0305(95)00524-H. [DOI] [PubMed] [Google Scholar]
- 5.Cerny RL, Tomer KB, Gross ML, Grotjahn L. Anal Biochem. 1987;165:175–182. doi: 10.1016/0003-2697(87)90217-x. [DOI] [PubMed] [Google Scholar]
- 6.McLuckey SA, Habibi-Goudarzi S. J Am Chem Soc. 1993;115:12085–12095. [Google Scholar]
- 7.Nordhoff E, Kirpekar F, Roepstorff P. Mass Spectrom Rev. 1996;15:67–138. doi: 10.1002/(SICI)1098-2787(1996)15:2<67::AID-MAS1>3.0.CO;2-8. [DOI] [PubMed] [Google Scholar]
- 8.Zubarev RA, Kelleher NL, McLafferty FW. J Am Chem Soc. 1998;120:3265–3266. [Google Scholar]
- 9.Horn DM, Breuker K, Frank AJ, McLafferty FW. J Am Chem Soc. 2001;123:9792–9799. doi: 10.1021/ja003143u. [DOI] [PubMed] [Google Scholar]
- 10.Breuker K, McLafferty FW. Angew Chem Int Ed Engl. 2003;42:4900–4904. doi: 10.1002/anie.200351705. [DOI] [PubMed] [Google Scholar]
- 11.Syka JEP, Coon JJ, Schroeder MJ, Shabanowitz J, Hunt DF. Proc Nat Acad Sci USA. 2004;101:9528–9533. doi: 10.1073/pnas.0402700101. [DOI] [PMC free article] [PubMed] [Google Scholar]
- 12.Jackson SN, Dutta S, Woods AS. J Am Soc Mass Spectrom. 2009;20:176–179. doi: 10.1016/j.jasms.2008.08.021. [DOI] [PMC free article] [PubMed] [Google Scholar]
- 13.Yang J, Mo J, Adamson JT, Hakansson K. Anal Chem. 2005;77:1876–1882. doi: 10.1021/ac048415g. [DOI] [PubMed] [Google Scholar]
- 14.Mo J, Hakansson K. Anal Bioanal Chem. 2006;386:675–681. doi: 10.1007/s00216-006-0614-z. [DOI] [PubMed] [Google Scholar]
- 15.Budnik BA, Haselmann KF, Zubarev R. Chem Phys Lett. 2001;342:299–302. [Google Scholar]
- 16.McLuckey SA. J Am Soc Mass Spectrom. 1992;3:599–614. doi: 10.1016/1044-0305(92)85001-Z. [DOI] [PubMed] [Google Scholar]
- 17.Wan KX, Gross ML, Shibue T. J Am Soc Mass Spectrom. 2000;11:450–457. doi: 10.1016/S1044-0305(00)00095-7. [DOI] [PubMed] [Google Scholar]
- 18.Gabelica V, De Pauw E. J Mass Spectrom. 2001;36:397–402. doi: 10.1002/jms.141. [DOI] [PubMed] [Google Scholar]
- 19.Dunbar RC, McMahon TB. Science. 1998;279:194–197. [Google Scholar]
- 20.Schnier PD, Klassen JS, Strittmatter EF, Williams ER. J Am Chem Soc. 1998;120:9605–9613. doi: 10.1021/ja973534h. [DOI] [PMC free article] [PubMed] [Google Scholar]
- 21.Woodin RL, Bomse DS, Beauchamp JL. J Am Chem Soc. 1978;100:3248–3250. [Google Scholar]
- 22.Wilson JJ, Brodbelt JS. Anal Chem. 2007;79:2067–2077. doi: 10.1021/ac061946f. [DOI] [PMC free article] [PubMed] [Google Scholar]
- 23.Gabelica V, De Pauw E. J Am Soc Mass Spectrom. 2002;13:91–98. doi: 10.1016/s1044-0305(01)00335-x. [DOI] [PubMed] [Google Scholar]
- 24.Gauthier JW, Trautman TR, Jacobson DB. Anal Chim Acta. 1991;246:211–225. [Google Scholar]
- 25.Turner KB, Brinson RG, Yi-Brunozzi HY, Rausch JW, Miller JT, Le Grice SFJ, Marino JP, Fabris D. Nucleic Acids Res. 2008;36:2799–2810. doi: 10.1093/nar/gkn129. [DOI] [PMC free article] [PubMed] [Google Scholar]
- 26.Brinson RG, Turner KB, Yi-Brunozzi HY, Le Grice SF, Fabris D, Marino JP. Biochemistry. 2009;48:6988–6997. doi: 10.1021/bi900357j. [DOI] [PMC free article] [PubMed] [Google Scholar]
- 27.Turner KB, Hagan NA, Kohlway A, Fabris D. J Am Soc Mass Spectrom. 2006;17:1401–1411. doi: 10.1016/j.jasms.2006.06.009. [DOI] [PubMed] [Google Scholar]
- 28.Turner KB, Kohlway AS, Hagan NA, Fabris D. Biopolymers. 2009;91:283–296. doi: 10.1002/bip.21107. [DOI] [PMC free article] [PubMed] [Google Scholar]
- 29.Hagan NA, Fabris D. J Mol Biol. 2007;365:396–410. doi: 10.1016/j.jmb.2006.09.081. [DOI] [PMC free article] [PubMed] [Google Scholar]
- 30.Turner KB, Hagan NA, Fabris D. J Mol Biol. 2007;369:812–828. doi: 10.1016/j.jmb.2007.03.065. [DOI] [PMC free article] [PubMed] [Google Scholar]
- 31.Comisarow MB, Marshall AG. Chem Phys Lett. 1974;25:282–283. [Google Scholar]
- 32.Hendrickson CL, Emmett MR, Marshall AG. Annu Rev Phys Chem. 1999;50:517–536. doi: 10.1146/annurev.physchem.50.1.517. [DOI] [PubMed] [Google Scholar]
- 33.Rozenski J. 1999 [Google Scholar]
- 34.Goodner KL, Milgram KE, Williams KR, Watson CH, Eyler JR. J Am Soc Mass Spectrom. 1998;9:1204–1212. doi: 10.1016/1044-0305(96)00025-6. [DOI] [PubMed] [Google Scholar]
- 35.McLuckey SA, Van Berkel GJ, Glish GL. J Am Soc Mass Spectrom. 1992;3:60–70. doi: 10.1016/1044-0305(92)85019-G. [DOI] [PubMed] [Google Scholar]
- 36.Wang Z, Wan KX, Ramanathan R, Taylor JS, Gross ML. J Am Soc Mass Spectrom. 1998;9:683–691. doi: 10.1016/S1044-0305(98)00178-0. [DOI] [PubMed] [Google Scholar]
- 37.Monn ST, Schurch S. J Am Soc Mass Spectrom. 2007;18:984–990. doi: 10.1016/j.jasms.2007.02.006. [DOI] [PubMed] [Google Scholar]
- 38.Kirpekar F, Krogh TN. Rapid Commun Mass Spectrom. 2001;15:8–14. doi: 10.1002/1097-0231(20010115)15:1<8::AID-RCM185>3.0.CO;2-S. [DOI] [PubMed] [Google Scholar]
- 39.Schurch S, Bernal-Mendez E, Leumann CJ. J Am Soc Mass Spectrom. 2002;13:936–945. doi: 10.1016/S1044-0305(02)00413-0. [DOI] [PubMed] [Google Scholar]
- 40.Huang TY, Kharlamova A, Liu J, McLuckey SA. J Am Soc Mass Spectrom. 2008;19:1832–1840. doi: 10.1016/j.jasms.2008.08.009. [DOI] [PubMed] [Google Scholar]
- 41.Leontis NB, Lescoute A, Westhof E. Curr Opin Struct Biol. 2006;16:279–287. doi: 10.1016/j.sbi.2006.05.009. [DOI] [PMC free article] [PubMed] [Google Scholar]


