

Abstract
BACKGROUND AND PURPOSE:
Head and neck cancer can cause substantial morbidity and mortality. Our aim was to evaluate the potential usefulness of a computerized system for segmenting lesions in head and neck CT scans and for estimation of volume change of head and neck malignant tumors in response to treatment.
MATERIALS AND METHODS:
CT scans from a pretreatment examination and a post 1-cycle chemotherapy examination of 34 patients with 34 head and neck primary-site cancers were collected. The computerized system was developed in our laboratory. It performs 3D segmentation on the basis of a level-set model and uses as input an approximate bounding box for the lesion of interest. The 34 tumors included tongue, tonsil, vallecula, supraglottic, epiglottic, and hard palate carcinomas. As a reference standard, 1 radiologist outlined full 3D contours for each of the 34 primary tumors for both the pre- and posttreatment scans and a second radiologist verified the contours.
RESULTS:
The correlation between the automatic and manual estimates for both the pre- to post-treatment volume change and the percentage volume change for the 34 primary-site tumors was 0.95, with an average error of −2.4 ± 8.5% by automatic segmentation. There was no substantial difference and specific trend in the automatic segmentation accuracy for the different types of primary head and neck tumors, indicating that the computerized segmentation performs relatively robustly for this application.
CONCLUSIONS:
The tumor size change in response to treatment can be accurately estimated by the computerized segmentation system relative to radiologists' manual estimations for different types of head and neck tumors.
Head and neck cancer is a relatively common type that can cause substantial morbidity and mortality in both men and women. Every year 48,000 new head and neck cancer cases are diagnosed in the United States.1 Head and neck cancer causes 11,200 deaths per year.1
The treatment of patients with oropharyngeal and laryngeal cancer remains controversial. Treatment options have included surgery with or without RT or various nonsurgical organ-preservation protocols. In the United States, organ-preserving strategies are the treatment of choice for patients with locally advanced tumors. Organ-preservation treatment consists of combined chemotherapy and radiation therapy.2–6 Another treatment approach is the use of neoadjuvant therapy,7–9 which consists of a trial of chemotherapy followed by definitive radiation. Patients with a >50% reduction in the primary tumor determined at endoscopy are considered responders and can be treated with combined chemotherapy and radiation therapy. Patients who have <50% response are treated with surgical resection.
A precise estimation of the response to induction therapy is very important for identifying those patients who would best be treated with nonsurgical organ-preservation therapy. This assessment is usually performed by endoscopic evaluation, which is often subjective. Numerous studies have shown that CT is an effective noninvasive technique for measuring primary-site GTV, which has been identified as an independent variable for predicting local control for a variety of subsites in the head and neck.10–15 Primary-site tumor volume can also be reliably measured across institutions.16 However, CT GTV estimation is often time-consuming because current state-of-the-art imaging requires thin-section acquisition (<2.5 mm) with a 50% overlap by using multidetector CT. The large number of images that must be manually contoured precludes tumor volumes obtained in routine patient care. In addition, there are inter- and intraobserver variabilities in a radiologist's manual segmentation of CT head and neck tumors, which can influence the accuracy of the results.
Currently, clinical estimation of the tumor size is based on the WHO criteria,17 as well as the RECIST criteria.18 In the WHO criteria,17 the longest tumor diameter and its perpendicular diameter are measured. The response to treatment is estimated as the percentage reduction in the product of the longest tumor diameter and its perpendicular diameter between post- and pretreatment measurements. In the RECIST criteria,18 only 1 diameter (the longest tumor diameter) is measured. The response to treatment is estimated as a percentage reduction in the longest tumor diameter between post- and pretreatment measurements. Both methods, however, can be inaccurate and can produce large inter- and intraobserver variations, especially for tumors with irregular shapes. The volumetric information available in CT scans is vastly underused.19
With the increase in radiologists' workloads and the increase in the number of organ preservation procedures by using neoadjuvant therapy, automatic and semiautomatic segmentation tools will likely play an important role in the evaluation of tumor response to treatment. To address this important issue, we are exploring the development of techniques that permit automated and semiautomated GTV segmentation and TV measurements. Previously we performed a pilot study with a limited dataset to evaluate the feasibility of using a computerized system developed in our laboratory to estimate the volume change of head and neck cancer in response to treatment and have obtained promising results.20 The purpose of the current study was to further validate the performance of the system with a larger dataset, to investigate the dependence of the volume estimate on the lesion type and on the variability of the user-selected bounding box for initialization of the segmentation, and to compare the automatic estimations with the results based on the WHO and RECIST criteria.
Materials and Methods
Dataset
The data-collection protocol was approved by our institutional review board and is compliant with the Health Insurance Portability and Accountability Act. Patient informed consent was waived for this retrospective study. Our dataset contained temporal CT volume pairs from 34 patients with head and neck neoplasms who participated in a nonsurgical organ-preservation-therapy clinical trial in our institution. Twenty-two patients were men, and 12 were women. The patients' ages ranged from 37 to 80 years (mean, 57.9 years). The primary tumors were stages III and IV, and their locations are listed in Table 1. For the estimation of the change in tumor volume, a pretreatment contrast-enhanced CT scan followed by a second contrast-enhanced CT scan after 1 cycle of chemotherapy were evaluated. A total of 68 intravenous contrast-enhanced CT scans were, therefore, collected for the 34 patients (collected by L.H., B.S., H.-P.C., F.P.W., J.M., M.I.). The CT studies were acquired in our clinic with a variety of scanners (GE Healthcare, Milwaukee, Wisconsin), including the LightSpeed series scanner models Ultra, Pro 16, and LightSpeed 16. The pixel size ranged from 0.352 to 0.586 mm. The section thicknesses were 1.25 and 2.5 mm. Ten of the 34 primary tumors were necrotic, 12 had spiculated/irregular margins, 10 were heterogeneous, and 3 were in proximity to bone.
Table 1:
The average signed errors and average absolute errors of the automatic estimate of the percentage pre- to posttreatment volume change for the 34 primary tumors based on reading 1 and reading 2 bounding boxes
| Tumor Type | Number of Tumors | Average Difficulty (mean, range) | Reading 1 |
Reading 2 |
||
|---|---|---|---|---|---|---|
| Signed Error (%)a | Absolute Error (%)a | Signed Error (%)a | Absolute Error (%)a | |||
| Tongue | 10 | 3.4, 2–5 | −2.5 ± 6.9 | 5.6 ± 4.4 | 1.8 ± 10.0 | 7.9 ± 6.0 |
| Tonsil | 2 | 4, 3–5 | −0.2 ± 5.5 | 3.9 ± 0.3 | −0.4 ± 14.1 | 10.0 ± 0.6 |
| Vallecular | 2 | 3.5, 2–5 | −5.1 ± 0.2 | 5.1 ± 0.2 | −8.3 ± 0.4 | 8.3 ± 0.4 |
| Supraglottic | 14 | 2, 1–3 | −0.9 ± 8.0 | 5.7 ± 5.5 | −5.4 ± 13.1 | 10.8 ± 8.8 |
| Epiglottic | 5 | 2.2, 1–3 | −2.8 ± 13.6 | 9.2 ± 9.4 | −3.6 ± 8.0 | 7.5 ± 3.1 |
| Hard palate | 1 | 3 | −20.0 ± 0 | 20.0 ± 0 | −18.9 ± 0 | 18.9 ± 0 |
| Total | 34 | −2.4 ± 8.5 | 6.4 ± 5.9 | −3.3 ± 11.3 | 9.5 ± 6.8 | |
Mean.
To obtain a reference standard for comparison with the computer segmentation, 1 radiologist (S.K.G.) with 7 years' experience reading head and neck scans identified and marked 34 primary-site cancers on both the pre- and posttreatment CT scans with bounding boxes by using an in-house-developed GUI. To define the bounding box, we first selected a “best section,” namely, the 2D section in which the lesion was best visualized (with its maximum size), and we drew a rectangle that enclosed the lesion on the best section. The top and bottom of the box were chosen to enclose the top and the bottom part of the lesion with sufficient margins. The sizes of the bounding boxes were variable, to enclose lesions of different sizes. Following WHO and RECIST criteria, the radiologist also measured the longest diameter and its perpendicular diameter on the pre- and posttreatment scans for each tumor by using an electronic caliper provided by the GUI. The size measurements were performed on the best section. The radiologist also provided a subjective rating of the degree of difficulty in visualizing the lesion boundaries on a 5-point scale (1 = very easy, 2 = easy, 3 = intermediate, 4 = hard, 5 = very hard) relative to lesions seen in clinical practice. The average degree of difficulty for the primary tumors at the different locations is also listed in Table 1. A second radiologist (S.K.M.) with 16 years' experience reading head and neck scans inspected and verified the lesion measurements. The average size (the longest diameter) for the 34 tumors was 30.9 mm (range, 14.7–60.6 mm) on the pretreatment CT scans and 24.9 mm (range, 10.5–59.8 mm) on the posttreatment CT scans. For clarity of the presentation, the above estimations are referred to as reading 1.
For all 34 primary tumors, the first radiologist (S.K.G.) also outlined full 3D contours on both the pre- and posttreatment scans by using the GUI. The second radiologist (S.K.M.) inspected and, if necessary, modified the 3D contours.
To study the effect of the interobserver variability of the bounding box marking on the automatic segmentation, a third radiologist (M.I.) with 6 years' experience reading head and neck scans independently identified and marked the 34 primary-site cancers on both the pre- and posttreatment CT scans by using the GUI. This radiologist also measured the longest diameter and its perpendicular diameter on the pre- and posttreatment scans on the best section, following the WHO and the RECIST criteria by using the electronic caliper. The above estimations of this radiologist are referred to as reading 2.
Segmentation of Head and Neck Lesions on MDCT
An initial evaluation of the feasibility of automated segmentation of head and neck lesions on CT scans in a pilot study was reported previously.21 This segmentation method will be summarized briefly as the following: It consists of 3 stages—preprocessing, initial segmentation, and 3D level-set segmentation. The system uses as input an approximate bounding box for the lesion of interest.
In the first stage, a set of smoothed images and a set of gradient images are obtained by applying 3D preprocessing techniques to the original CT images. Smoothing, anisotropic diffusion, gradient filtering, and rank transform of the gradient magnitude are used to obtain an edge image.
In the second stage, based on attenuation, gradient, and location, a subset of pixels is selected, which are relatively close to the center of the lesion and belong to smooth (low gradient) areas.21 The pixels are selected within an ellipsoid with axes one-half of the inscribed ellipsoid within the volume of interest. This subset of pixels is considered to be a statistical sample of the full population of pixels in the lesion. The mean and SD of the intensity values of the pixels belonging to the subset are calculated. The preliminary lesion contour is obtained after thresholding and includes the set of pixels falling within 3.0 SDs of the mean and with values above −400 HU. A morphologic dilation filter, a 3D flood fill algorithm, and a morphologic erosion filter are applied to the contour to connect nearby components and extract an initial segmentation surface.21 The size of the ellipsoid and the remaining parameters are selected experimentally in a way that enables segmentation of a variety of lesions, including necrotic tumors.21
In the third stage, the initial segmentation surface is propagated by using a 3D level-set method.21 Four level sets are applied sequentially to the initial contour. The first 3 level sets are applied in 3D with a predefined schedule of parameters, and the last level set is applied in 2D to every section of the resulting 3D segmentation to obtain the final contour. The first level set slightly expands and smoothes the initial contour. The second level set pulls the contour toward the sharp edges, but at the same time, it expands slightly in regions of low gradient. The third level set further draws the contour toward the sharp edges. The 2D level set performs final refinement of the segmented contour on every section.
Evaluation Methods
The pre- to posttreatment lesion change was defined as the difference between pretreatment and posttreatment estimations, and the percentage pre- to posttreatment change was defined as this difference relative to the pretreatment estimation. The percentage pre- to posttreatment change was calculated for the following: 1) volume (3D), 2) product of longest tumor diameter and its perpendicular (the WHO criteria), and 3) longest tumor diameter (the RECIST criteria).
For all lesions, the ICC22 between the automatic and manual estimation of the pre- to posttreatment volume change was calculated. Bland-Altman plots23,24 were also used to compare the automatic and manual estimations. The pre- to posttreatment volume change and the percentage change were analyzed. The average error for the automatic estimate of the percentage change in volume was computed. The average error is defined as the difference between the automatic 3D estimate and the manual 3D estimate averaged over the 34 lesions. Because the over- and undersegmentation tend to mask the actual deviations from the manual estimates when the average is taken, the average absolute (unsigned) errors of the percentage pre- to posttreatment change in volume were also reported, which averages the absolute difference between the percentage pre- to posttreatment change of the automatic and manual estimates in volumes, respectively. A paired Student t test was used to estimate the statistical significance of the difference between the automatic and manual estimations as well as the difference between the automatic estimations based on reading 1 and reading 2.
Results
Examples of the computerized 3D level-set segmentation of the primary head and neck carcinomas on pre- and post-treatment CT scans are shown in Figs 1 and 2 for a necrotic tonsil carcinoma and a heterogeneous tongue carcinoma, respectively. In both figures, the radiologist's hand-drawn bounding box used for the automatic segmentation is also shown.
Fig 1.

CT sections of a tonsil carcinoma on pre- and posttreatment CT scans. The carcinoma is necrotic on the pretreatment scan. This is also a subtle lesion (difficulty rating = 4 for the posttreatment scan) in the dataset. A and B, An axial section on the pretreatment scan (A), the automatic segmentation (white contour, B), and the reference-standard (hand-drawn) segmentation (black contour, B) superimposed on the pretreatment scan. C and D, An axial section on the posttreatment scan (C), the automatic segmentation (white contour, D), and the reference-standard segmentation (black contour, D) superimposed on the posttreatment scan. The radiologist's hand-drawn bounding box (white rectangle) used for the automatic segmentation is also shown in B and D. The lesion is shown on the best section marked by the radiologist for each scan.
Fig 2.

CT sections of a heterogeneous tongue carcinoma on pre- and posttreatment CT scans. This lesion has a difficulty rating of 2. A and B, An axial section on the pretreatment scan (A), the automatic segmentation (white contour, B), and the reference-standard (hand-drawn) segmentation (black contour, B) superimposed on the pretreatment scan. C and D, An axial section on the posttreatment scan (C), the automatic segmentation (white contour, D), and the reference standard segmentation (black contour, D) superimposed on the posttreatment scan. The radiologist's hand-drawn bounding box (white rectangle) used for the automatic segmentation is also shown in B and D. The lesion is shown on the best section marked by the radiologist for each scan.
Volume Estimates and Volume-Change Estimates
The pre- and posttreatment tumor volumes based on the radiologist-outlined contours and automatic segmentation with the first set of bounding boxes (reading 1) for the 34 tumors are summarized in Table 2. The average pre- and post-treatment tumor volumes were 14.5 and 6.7 cm3, respectively, by radiologists' contours and 15.9 and 7.7 cm3, respectively, by automatic segmentation. The correlations between the automatic and the manual volumes were high (ICC = 0.98) for both the pretreatment (Fig 3) and the posttreatment volume estimates (Fig 4). The average time to perform a level-set segmentation was 42 seconds. The average time to perform a full manual 3D contour was 313 seconds (5.22 minutes).
Table 2:
Pre- and posttreatment volumes for the 34 primary-site tumorsa
| Radiologist |
Automatic |
|||
|---|---|---|---|---|
| Pretreatment | Posttreatment | Pretreatment | Posttreatment | |
| Average | 14.5 | 6.7 | 15.9 | 7.7 |
| Range | 2.1–55.4 | 0.4–42.0 | 2.2–61.3 | 0.6–45.1 |
The estimated volumes (cubic centimeters) are based on the radiologists' outlined contours.
Fig 3.
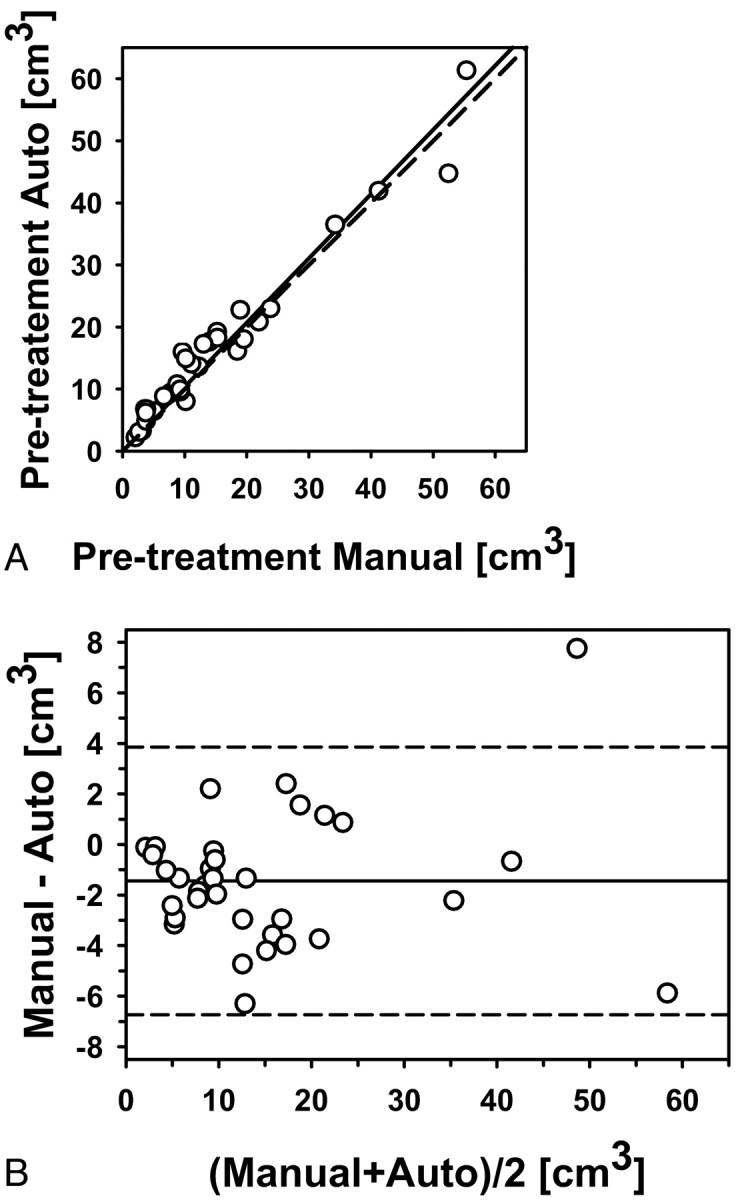
Automatic-versus-manual estimates of the pretreatment volumes for the 34 primary-site tumors (correlation ICC = 0.98). A, Scatterplot. B, Bland-Altman plot. The solid line is the mean; the dashed line is ±2 SDs.
Fig 4.
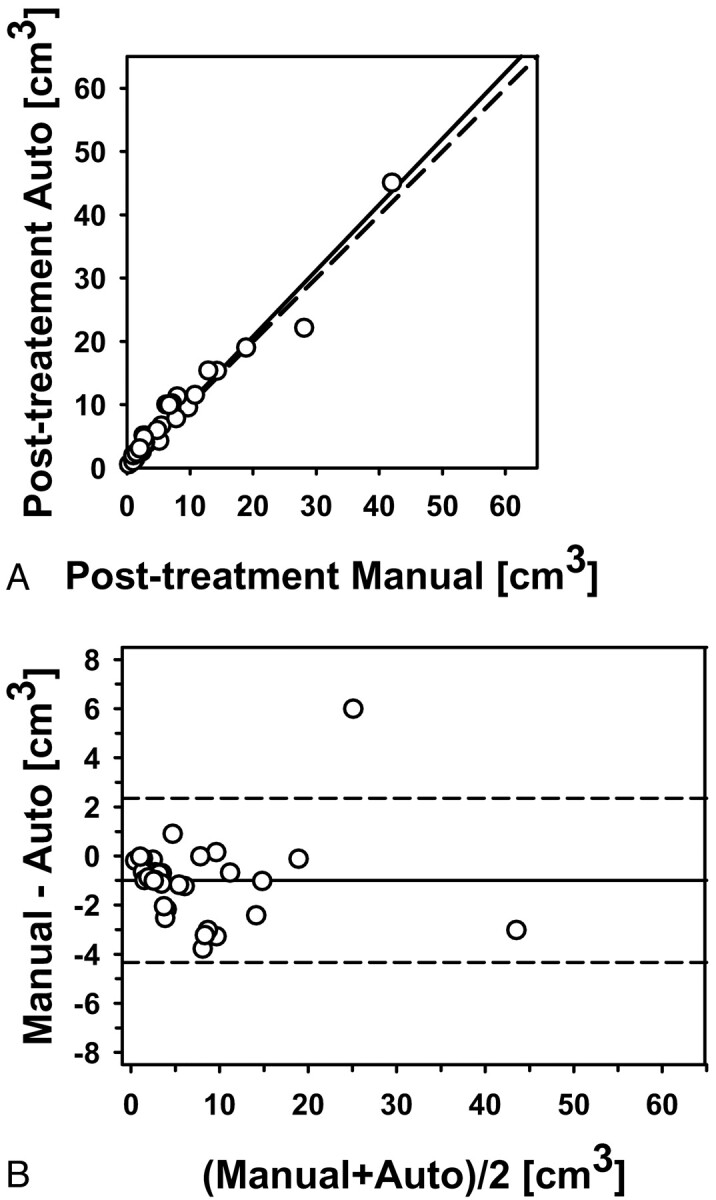
Automatic-versus-manual estimates of the posttreatment volumes for the 34 primary-site tumors (correlation ICC = 0.98). A, Scatterplot. B, Bland-Altman plot. The solid line is the mean; the dashed line is ±2 SDs.
Good agreement was also observed between the automatic and manual estimates for the pre- to posttreatment volume change (Fig 5) and between the automatic and manual estimates for the percentage pre- to posttreatment volume change (Fig 6), both with correlations (ICCs) of 0.95. The difference between the manual and automatic estimates for the pre- to posttreatment volume change and the percentage volume change did not achieve statistical significance (P = .21 and P = .11, respectively).
Fig 5.
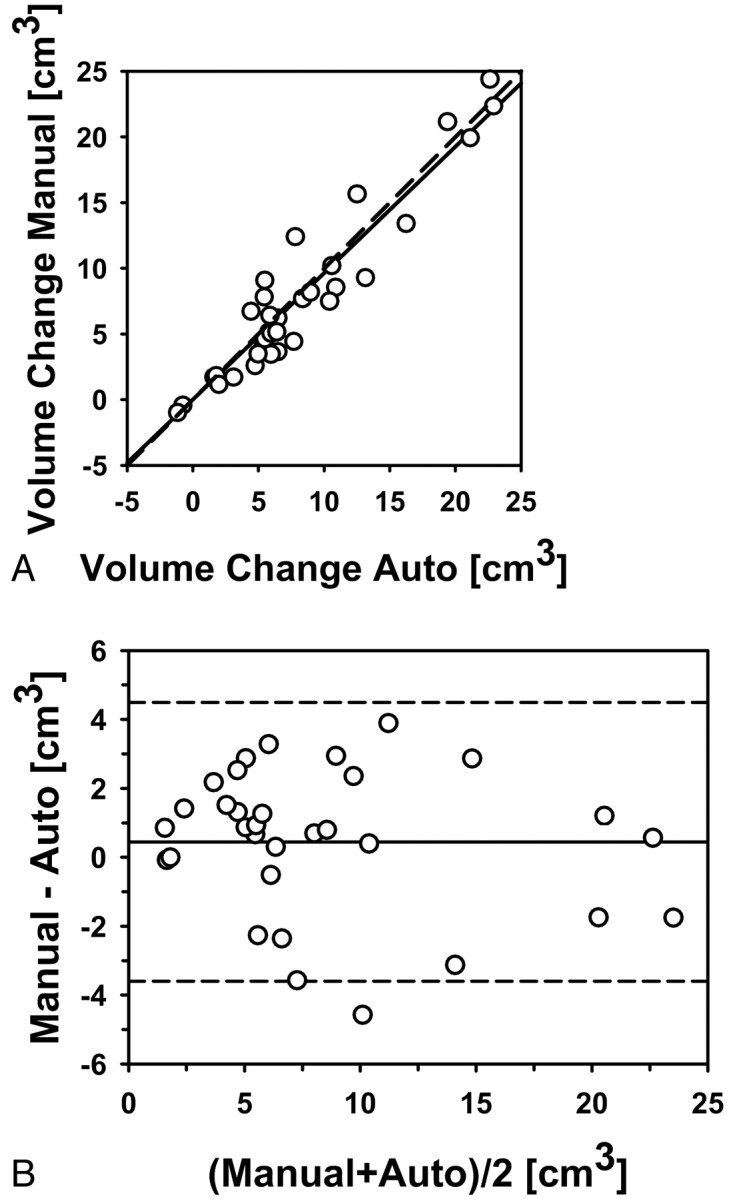
Automatic-versus-manual estimates of the pre- to posttreatment volume change for the 34 primary-site tumors (correlation ICC = 0.95). A, Scatterplot. B, Bland-Altman plot. The solid line is the mean; the dashed line is ±2 SDs.
Fig 6.
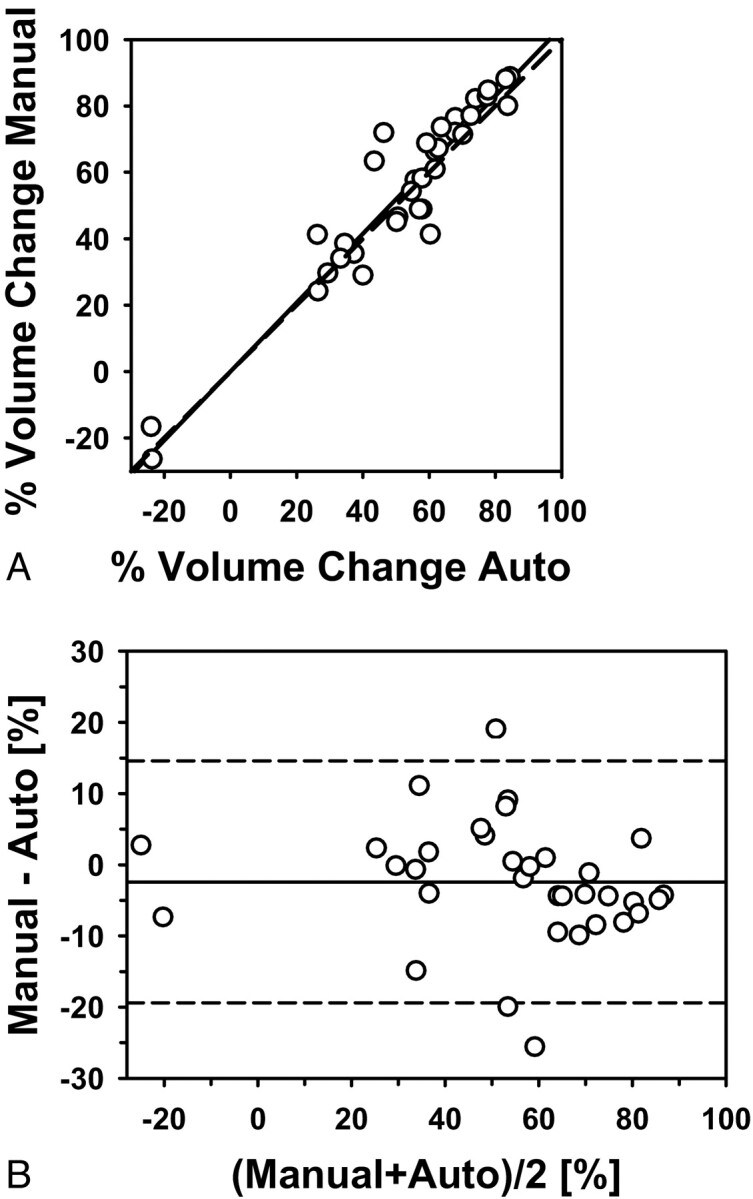
Automatic-versus-manual estimates of the percentage pre- to posttreatment volume change for the 34 primary-site tumors (correlation ICC = 0.95). A, Scatterplot. B, Bland-Altman plot. The solid line is the mean; the dashed line is ±2 SDs.
Table 1 shows the errors of the automatic estimate of the percentage pre- to posttreatment changes of the 34 primary tumor volumes by using the 2 sets of bounding boxes. From reading 1, the average error was −2.4 ± 8.5% and the average absolute error was 6.4 ± 5.9%. The errors for cancers at different locations are also shown.
Automated Volume Estimates by using Reading 2 Bounding Boxes
The segmentation results for the second set of bounding boxes (reading 2) are summarized below. The average pre- and posttreatment primary tumor volumes based on the automatic estimates were 16.4 and 7.6 cm3, respectively. The correlations between the automatic and the manual volumes were ICC = 0.93 for the pretreatment and ICC = 0.89 for the posttreatment volume estimates. Good agreement was also observed between the automatic and manual estimates for the pre- to posttreatment volume change (correlation ICC = 0.89) and between the automatic and manual estimates for the percentage pre- to posttreatment volume change (correlation ICC = 0.91). The difference between the manual and automatic estimates for the pre- to posttreatment volume change and the percentage volume change did not achieve statistical significance (P = .07 and P = .10, respectively). The average error of the automatic estimate of the percentage pre- to posttreatment change was −3.3 ± 11.3%, and the average absolute error was 9.5 ± 6.8%. The errors for the cancers at different locations are also shown in Table 1.
Effects of Bounding Box Variation on Automatic Estimates
The average difference in the size of the bounding boxes between reading 1 and reading 2 was approximately 20% for each of the x-, y-, and z-dimensions (Table 3). The average displacement between the box centers was 4.0 ± 3.0 mm. The average absolute difference of the best-section location in z between reading 1 and reading 2 was 3.9 ± 4.3 mm. The automatic volume estimates and the pre- to postvolume change estimates based on the set of bounding boxes from reading 1 were compared with the corresponding automatic volume estimates and the pre- to postvolume change estimates based on the set of bounding boxes from reading 2. The results are summarized in Table 4. A good agreement was observed for all comparisons (ICC range, 0.88–0.92). The difference between the automatic estimates based on reading 1 and reading 2 bounding boxes did not achieve statistical significance for any of the estimates (P > .29).
Table 3:
The average difference of box size between reading 1 and reading 2 in x-, y-, and z-dimensions
| Difference of the Box Size in Dimension | Signed Difference (%) | Absolute Difference (%) |
|---|---|---|
| X | 0.0 ± 21.2 | 16.0 ± 13.7 |
| Y | −2.1 ± 27.6 | 17.5 ± 21.3 |
| Z | −14.1 ± 26.6 | 20.0 ± 22.4 |
Table 4:
Correlation between the automatic estimates obtained from the reading 1 and reading 2 bounding boxes for the 34 primary site tumors
| ICC | P Valuea | |
|---|---|---|
| Pretreatment volume | 0.92 | .58 |
| Posttreatment volume | 0.88 | .86 |
| Pre- to posttreatment change | 0.89 | .29 |
| % Pre- to posttreatment change | 0.90 | .67 |
Paired Student t test estimation.
Effects of Tumor Characteristics on Automatic Estimates
The average error and the average absolute error of the automatic estimate of the percentage pre- to posttreatment change of the necrotic primary tumor volumes compared with the non-necrotic primary tumor volumes did not show a specific trend (Table 5). The difference between the automatic estimates for necrotic and non-necrotic tumors did not achieve statistical significance for any of the error estimates (P > .40). The additional comparison of the average error and the average absolute error of the automatic estimate of the percentage pre- to posttreatment change of the tumor volumes for different tumor characteristics—heterogeneous versus nonheterogeneous, spiculated/irregular margin versus smooth/lobulated margin, and in proximity to bone versus not in proximity to bone—revealed an average error difference of 2% between the corresponding groups, without showing a specific trend (based on both reading 1 and reading 2 bounding boxes). The error differences between the above corresponding groups did not achieve statistical significance for any of the groups (P > .22). If we grouped the cases with the degree of difficulty 4 and 5 as “difficult” and the cases with degree of difficulty 1, 2, and 3 as “easy,” there was not a specific trend for the average absolute error of the automatic estimate of the percentage pre- to posttreatment change of the tumor volumes between cases of the easy group and the difficult group (based on both reading 1 and reading 2 bounding boxes). The error differences did not achieve statistical significance (P > .19).
Table 5:
The average signed errors and average absolute errors of the automatic estimate of the percentage pre- to posttreatment volume change of the necrotic and non-necrotic primary tumors based on reading 1 and reading 2 bounding boxes
| Tumor Type | No. Tumors | Reading 1 |
Reading 2 |
||
|---|---|---|---|---|---|
| Signed Error (%)a | Absolute Error (%)a | Signed Error (%)a | Absolute Error (%)a | ||
| Necrotic tumors | 10 | −2.5 ± 10.6 | 7.3 ± 9.6 | −0.8 ± 10.1 | 8.3 ± 4.8 |
| Non-necrotic tumors | 24 | −2.4 ± 7.7 | 6.1 ± 5.1 | −4.4 ± 11.1 | 10.0 ± 7.4 |
| P valueb | 0.97 | 0.61 | 0.41 | 0.52 | |
Mean.
Student t test estimation.
Comparison of Volume-Change Estimates with WHO and RECIST Criteria-Based Estimates
The percentage pre- to posttreatment change following the WHO criteria was estimated by using the product of radiologist-measured longest tumor diameter and its perpendicular diameter, and that following the RECIST criteria, by using the longest tumor diameter alone. The ICC between the percentage pre- to posttreatment change by manual volume estimate (3D) and that by the WHO criteria-based estimate was 0.72. The ICC between the percentage pre- to posttreatment change by manual volume estimate (3D) and that by the RECIST criteria-based estimate was 0.55. The WHO and RECIST criteria-based estimates were also obtained by using the longest tumor diameter and its perpendicular measured in reading 2. The ICC between the percentage pre- to posttreatment change by manual volume estimate (3D) and the WHO criteria-based estimate was 0.59. The ICC between the percentage pre- to posttreatment change by manual volume estimate (3D) and that by the RECIST criteria-based estimates was 0.52.
Discussion
Volume Estimates and Volume-Change Estimates
The automatic segmentation showed high correlation with radiologists' manual segmentation for the volume estimates. There was no statistically significant difference between the manual and automatic estimates for the pre- to posttreatment volume change and the percentage volume change for both reading 1 and reading 2 bounding boxes, further confirming the good agreement between the automatic and manual segmentations.
The segmentation system performed well in some of the lesions visually judged to be most difficult by radiologists. Figure 1 shows a subtle necrotic tumor with a difficulty rating of 4, which was accurately segmented by the computer system on both the pre- and the posttreatment scans compared with the manual outlines. Although most of the boundaries between the lesion and the adjacent normal tissues had low contrast, the preprocessing in combination with the level-set method was able to find reasonable boundaries in this case.
Effects of Bounding Box Variation on Automatic Estimates
The automatic estimates based on reading 1 and reading 2 bounding boxes showed good agreement.
Effects of Tumor Characteristics on Automatic Estimates
There were 6 different types of primary tumors in the dataset. Because of the complicated anatomic structures in the head and neck regions, the tumor shapes vary greatly depending on the locations. For a given set of bounding boxes (reading 1 or reading 2), the difference in the average absolute errors for the automatic estimates of the percentage pre- to posttreatment volume change between any 2 types of tumors was within 3.3%, indicating the adaptability of the level-set segmentation to the different tumor shapes. The absolute errors for the automatic estimates of the hard palate cancer were higher for both reading 1 and reading 2 estimations, probably reflecting the more complex shape of the cancer in this case. Note that there was only 1 hard palate cancer in this preliminary dataset, so no general observation can be made.
The comparison of the average error and the average absolute error of the automatic estimate of the percentage pre- to posttreatment change of the tumor volumes for tumors of different characteristics (necrotic versus non-necrotic, heterogeneous versus nonheterogeneous, spiculated/irregular margin versus smooth/lobulated margin, in proximity to bone versus not in proximity to bone, difficult versus easy) did not show a specific trend (based on both reading 1 and reading 2 bounding boxes) or significant difference for any of the groups. This further indicates that the level-set segmentation performs relatively robustly for the different types of head and neck tumors.
Comparison of Automatic Volume-Change Estimates with WHO and RECIST Criteria-Based Estimates
The comparisons between the percentage pre- to posttreatment volume change by manual segmentation and the percentage volume change by the automatic segmentation, the estimate by the WHO criteria, and the estimate by the RECIST criteria revealed that the 3D automatic segmentation was closest to the manual segmentation. The estimates by the WHO criteria, though closer than the estimates by the RECIST criteria, were still far from the manual segmentation. One reason is that head and neck tumors have complicated shapes and the 1-dimensional measurement cannot represent adequately the 3D pre- and posttreatment tumor shapes. The 2D measurement improves over the 1-dimensional measurement, but the change in tumor size in the direction perpendicular to the axial plane is still obscured. The 3D pre- and posttreatment volume estimates obtained by computer segmentation provide the best description of the 3D tumor shape and the tumor-volume changes.
Limitations of the Study
There are limitations in this preliminary study. The dataset is relatively small. This may potentially introduce some bias. Although the relatively robust performance of the automatic segmentation for the different types of primary tumors is an indication that the effect of such a bias may not be substantial, a larger dataset with different types of lesions is necessary to further confirm its generalizability. In a future study, the dataset will be further enlarged and the potential bias will be studied. A larger dataset will also be important to study the accuracy of and the correlation among the WHO criteria, the RECIST criteria, and the automatic volume estimates for monitoring of the pre- to posttreatment changes in head and neck tumors. In this study, the reference standards were obtained by 2 radiologists. One radiologist provided initial manual outlines of the lesions and a second radiologist confirmed the outlines by modifying them when necessary.
To study the inter- and intraobserver variabilities in manual segmentation of head and neck tumors, several radiologists must obtain independent segmentations and individual radiologists must also obtain repeated segmentations. As a step in this direction, we have performed a pilot study20 for estimation of the interobserver variability, in which a third radiologist independently provided 3D contours for a subset of 13 cases (26 primary tumors). The estimates based on the 3D contours by radiologist 3 were compared with the reference manual estimates. The difference between the estimates of radiologist 3 and the reference manual estimates for the percentage change in pre- to posttreatment volume was comparable with the difference between the automatic estimates and the reference manual estimates, indicating that the disagreement between the automatic and manual estimates is comparable with interobserver variability in the radiologists' estimates.
We will investigate the effects of these variabilities on the validation of our computer segmentation and the assessment of volume change and treatment response in future studies. The correlation results of the automated estimates based on the reading 2 bounding boxes were slightly lower than the correlation results of the automated estimates based on the reading 1 bounding boxes. This difference may be partly attributed to the fact that the reading 2 bounding boxes were obtained independently by a third radiologist, while the reading 1 bounding boxes were obtained by a radiologist involved with providing the initial manual outlines of the lesions, which might introduce some bias. However, there was good agreement between the automatic estimates based on the reading 1 and reading 2 bounding boxes (ICC range, 0.88–0.92), and the difference did not achieve statistical significance for any of the estimates (P > .29), which implies that if such a bias exists, it has a small effect.
Conclusions
Our results indicate that the tumor size change in response to nonsurgical organ-preservation therapy can be accurately estimated for different types of head and neck tumors by the 3D computerized-segmentation system relative to radiologists' manual segmentations. The automatic and manual estimates for the pre- to posttreatment tumor-volume change showed good agreement for a variety of tumor morphologies, attenuations, and internal architectures. This study suggests that the estimation of the tumor size change in response to nonsurgical organ-preservation therapy may be assisted by a computerized segmentation system.
Abbreviations
- Auto
automatic
- GTV
gross tumor volume
- GUI
graphic user interface
- ICC
intra-class correlation
- MDCT
multidetector row CT
- RECIST
Response Evaluation Criteria In Solid Tumors
- RT
radiation therapy
- TV
tumor volume
- WHO
World Health Organization
Footnotes
This work was supported in part by U.S. Public Health Service grant CA093517.
References
- 1.. Cancer Facts & Figures 2009. American Cancer Society; 2009. http://www.cancer.org/downloads/STT/500809web.pdf. Accessed December 2, 2009 [Google Scholar]
- 2. Pignon JP, Bourhis J, Domenge C, et al. Chemotherapy added to locoregional treatment for head and neck squamous-cell carcinoma: three meta-analyses of updated individual data. Lancet 2000; 355: 949– 55 [PubMed] [Google Scholar]
- 3. Bourhis J, Le Maitre A, Baujat B, et al. Individual patients' data meta-analyses in head and neck cancer. Curr Opin Oncol 2007; 19: 188– 94 [DOI] [PubMed] [Google Scholar]
- 4. Jeremic B, Shibamoto Y, Milicic B, et al. Hyperfractionated radiation therapy with or without concurrent low-dose daily cisplatin in locally advanced squamous cell carcinoma of the head and neck: a prospective randomized trial. J Clin Oncol 2000; 18: 1458– 64 [DOI] [PubMed] [Google Scholar]
- 5. Adelstein DJ, Li Y, Adams GL, et al. Intergroup phase III comparison of standard radiation therapy and two schedules of concurrent chemoradiotherapy in patients with unresectable squamous cell head and neck cancer. J Clin Oncol 2003; 21: 92– 98 [DOI] [PubMed] [Google Scholar]
- 6. Urba SG, Moon J, Giri PG, et al. Organ preservation for advanced resectable cancer of the base of tongue and hypopharynx: a Southwest Oncology Group trial. J Clin Oncol 2005; 23: 88– 95 [DOI] [PubMed] [Google Scholar]
- 7. Induction chemotherapy plus radiation compared with surgery plus radiation in patients with advanced laryngeal cancer: the Department of Veterans Affairs Laryngeal Cancer Study Group. N Engl J Med 1991; 324: 1685– 90 [DOI] [PubMed] [Google Scholar]
- 8. Lefebvre JL, Chevalier D, Luboinski B, et al. Larynx preservation in pyriform sinus cancer: preliminary results of a European Organization for Research and Treatment of Cancer phase III trial—EORTC Head and Neck Cancer Cooperative Group. J Natl Cancer Inst 1996; 88: 890– 99 [DOI] [PubMed] [Google Scholar]
- 9. Forastiere AA, Goepfert H, Maor M, et al. Concurrent chemotherapy and radiotherapy for organ preservation in advanced laryngeal cancer. N Engl J Med 2003; 349: 2091– 98 [DOI] [PubMed] [Google Scholar]
- 10. Mancuso AA, Mukherji SK, Schmalfuss I, et al. Preradiotherapy computed tomography as a predictor of local control in supraglottic carcinoma. J Clin Oncol 1999; 17: 631– 37 [DOI] [PubMed] [Google Scholar]
- 11. Hermans R, Van den Bogaert W, Rijnders A, et al. Value of computed tomography as outcome predictor of supraglottic squamous cell carcinoma treated by definitive radiation therapy. Int J Radiat Oncol Biol Phys 1999; 44: 755– 65 [DOI] [PubMed] [Google Scholar]
- 12. Chua DT, Sham JS, Kwong DL, et al. Volumetric analysis of tumor extent in nasopharyngeal carcinoma and correlation with treatment outcome. Int J Radiat Oncol Biol Phys 1997; 39: 711– 19 [DOI] [PubMed] [Google Scholar]
- 13. Johnson CR, Thames HD, Huang DT, et al. The tumor volume and clonogen number relationship: tumor-control predictions based upon tumor volume estimates derived from computed-tomography. Int J Radiat Oncol Biol Phys 1995; 33: 281– 87 [DOI] [PubMed] [Google Scholar]
- 14. Freeman DE, Mancuso AA, Parsons JT, et al. Irradiation alone for supraglottic larynx-carcinoma: can CT findings predict treatment results? Int J Radiat Oncol Biol Phys 1990; 19: 485– 90 [DOI] [PubMed] [Google Scholar]
- 15. Pameijer FA, Mancuso AA, Mendenhall WM, et al. Can pretreatment computed tomography predict local control in T3 squamous cell carcinoma of the glottic larynx treated with definitive radiotherapy? Int J Radiat Oncol Biol Phys 1997; 37: 1011– 21 [DOI] [PubMed] [Google Scholar]
- 16. Mukherji SK, Toledano AY, Beldon C, et al. Interobserver reliability of computed tomography-derived primary tumor volume measurement in patients with supraglottic carcinoma. Cancer 2005; 103: 2616– 22 [DOI] [PubMed] [Google Scholar]
- 17. World Health Organization. WHO Handbook for Reporting Results of Cancer Treatment. Geneva, Switzerland: WHO Publications Centre; 1979: Publication No. 48 [Google Scholar]
- 18. Therasse P, Arbuck SG, Eisenhauer EA, et al. New guidelines to evaluate the response to treatment in solid tumors. J Natl Cancer Inst 2000; 92: 205– 16 [DOI] [PubMed] [Google Scholar]
- 19. Husband JE, Schwartz LH, Spencer J, et al. Evaluation of the response to treatment of solid tumours: a consensus statement of the International Cancer Imaging Society. Br J Cancer 2004; 90: 2256– 60 [DOI] [PMC free article] [PubMed] [Google Scholar]
- 20. Hadjiiski L, Mukherji SK, Ibrahim M, et al. Head and neck cancers on CT: preliminary study of treatment response assessment based on computerized volume analysis. AJR Am J Roentgenol. 2010; 194: 1083– 89 [DOI] [PMC free article] [PubMed] [Google Scholar]
- 21. Street E, Hadjiiski L, Sahiner B, et al. Automated volume analysis of head and neck lesions on CT scans using 3D level set segmentation. Med Phys 2007; 34: 4399– 408 [DOI] [PMC free article] [PubMed] [Google Scholar]
- 22. Shrout P, Fleiss J.. Intraclass correlations: uses in assessing rater reliability. Psychol Bull 1979; 86: 4202– 08 [DOI] [PubMed] [Google Scholar]
- 23. Bland J, Altman DG. Statistical methods for assessing agreement between 2 methods of clinical measurement. Lancet 1986; 1: 307– 10 [PubMed] [Google Scholar]
- 24. Altman DG, Bland J. Measurement in medicine: the analysis of method comparison studies. Statistician 1983; 32: 307– 17 [Google Scholar]