Abstract.
The number of molecular species suitable for multispectral fluorescence imaging is limited due to the overlap of the emission spectra of indicator fluorophores, e.g., dyes and nanoparticles. To remove fluorophore emission cross-talk in wide-field multispectral fluorescence molecular imaging, we evaluate three different solutions: (1) image stitching, (2) concurrent imaging with cross-talk ratio subtraction algorithm, and (3) frame-sequential imaging. A phantom with fluorophore emission cross-talk is fabricated, and a 1.2-mm ultrathin scanning fiber endoscope (SFE) is used to test and compare these approaches. Results show that fluorophore emission cross-talk could be successfully avoided or significantly reduced. Near term, the concurrent imaging method of wide-field multispectral fluorescence SFE is viable for early stage cancer detection and localization in vivo. Furthermore, a means to enhance exogenous fluorescence target-to-background ratio by the reduction of tissue autofluorescence background is demonstrated.
Keywords: fluorescence, molecular imaging, fluorophore cross-talk, spectral overlap, wide-field endoscopy, scanning fiber endoscope, multimodal imaging, autofluorescence, collagen, target-to-background ratio
1. Introduction
It is now widely accepted that optically active fluorophores, conjugated to targeted disease probes, are effective for image-guided diagnosis and surgical procedures.1–7 Fluorophore conjugates are routinely used to identify specific DNA components in flow cytometry systems, DNA microarrays, and microscopic histology examinations [e.g., fluorescence in situ hybridization (FISH)]. Over the past two decades, fluorophore optical probes have been evaluated for in vivo clinical imaging applications and to identify pre- or early stage cancerous conditions such as neoplastic lesions in human oral tissue,8 dysplasia in colon,9 high-grade dysplasia (HGD) in Barrett’s esophagus (BE),10 as well as screening and early detection for breast cancer,11 bladder cancer,5 and lung small cell carcinoma.12 Meanwhile, in vivo molecular optical imaging has also been used in ovarian cancer surgery guidance4 as well as for visualization and delineation of tumor margins.6,13 It has also been shown that optical contrast agents can aid in guiding the diagnosis of difficult cancers such as ovarian cancer,14 acute leukemia, and pediatric cancer.1
Many tumors express multiple cell surface and proteomic markers. Therefore, simultaneous multi-fluorophore imaging of numerous molecular targets is important for cancer diagnosis and therapy.3,8,15–19 Currently, multispectra fluorescence imaging techniques are employed in microscopic analysis in vitro such as conventional immunohistology and fluorescence-assisted cell sorter. These microscopic imaging approaches are time consuming and have a small field of view, which means they are not applicable for in vivo cancer detection and localization. Therefore, multi-fluorophore molecular imaging techniques for clinical endoscopic imaging are needed.
One of the remaining obstacles for full implementation of multi-fluorophore imaging is the spectral width of the emission spectra, as laser sources can help to reduce the overlap in excitation. Although quantum dot fluorophores have narrow bandwidths [full width at half maximum (FWHM) ), unresolved toxicity questions limit their application in human clinical studies.20 A small number of organic fluorophores, for example, FITC and ICG, have been approved by the FDA. In addition, most organic fluorescent dyes tend to have an asymmetric spectral profile that typically extends from the peak emission to well over 100 nm in the long wavelength tail. Overlapping emission spectra are present among the most common organic dyes, for example 7-diethylaminocoumarin-3-carboxylic acid (DEAC), fluorescein isothiocyanate (FITC), carboxytetramethylrhodamine (TAMARA), and cyanine (Cy5.5), that have been developed for fluorescence labeling. Therefore, incorporating two or more fluorophore targeting agents may be problematic as a result of overlapping emission spectra. Confusion over the correct spectral intensities of multi-fluorophore labels could lead to misdiagnosis of overexpressed cell surface protein markers.
Although isolation filters can be used to separate the emission spectra, significant signal loss can occur. The fluorescence emission cross-talk problem is typically encountered in multicolor fluorescence microscopic imaging. In such diagnostic optical systems, sequential21–24 or synchronous25,26 excitation techniques can be used to separate overlapping emissions from each individual fluorophore. However, in a real time and wide-field image visualization system, such as an endoscope, sequential image capture may introduce unacceptable image rendering lag times in a busy clinical workflow scenario. Therefore, we have evaluated three different options including concurrent and sequential excitation/emission image capture for distinguishing emissions from two spectrally intersecting fluorescent dye targets using a wide-field scanning fiber endoscope (SFE).
The first real-time in vivo imaging of a multispectral target with the SFE was demonstrated with the identification of dysplastic “hot-spots” in a murine model of colorectal cancer.9 It was also shown that topically administered fluorescent molecular probes combined with endoscopic imaging can readily identify cancerous lesions.8–10,27,28 In the diagnosis of HGD and early cancerous lesions in BE, multiple overexpressed cell surface targets, such as epidermal growth-factor receptor (EGFR and ErbB2), hepatocyte growth-factor receptor gene (MET), vascular endothelial growth-factor receptor 2 (VEGFR2), have been reported.29,30 As a result, the coincident emission signature from multiple fluorescent-labeled probes is expected to provide a more sensitive and a specific disease state diagnosis than a single molecular target for HGD and early cancer detection in BE.
In a previous study, we developed a color-matched, fluorescence-labeled esophagus phantom for dual-mode fluorescence-reflectance imaging with a single-fluorescent molecular probe.31 Other applications for fluorescence molecular imaging were also demonstrated using the phantom, for example fluorescence distance compensation31 and image stitching.32
In the current study, a second fluorescent dye was added to the phantom to construct a two-dye fluorescence model that represents imaging with emission cross-talk. Three approaches: (1) image stitching; (2) concurrent imaging with Cross-talk Ratio Subtraction (CRS) algorithm; and (3) frame-sequential imaging were evaluated for the removal/reduction of fluorescence emission cross-talk in a wide-field multispectral fluorescence endoscopic system. For each approach, we describe the concept, outline the method of execution, and present the evaluation test results. Finally, the strengths and limitations of each approach are compared and discussed. Each of the three proposed methodologies shows promise for wide-field multispectral fluorescence endoscopic imaging with mitigated dye emission cross-talk. Furthermore, they are also applicable to the reduction of autofluorescence, and thus enhance the target-to-background ratio during in vivo molecular imaging.
2. Materials and Methods
2.1. Phantom Model
2.1.1. Two-dye fluorescence targets fabrication and calibration
Fluorescent dye-in-polymer targets were fabricated to represent the molecular probe-targeted tissue biomarker. Details of the dye-in-polymer fabrication process were described in a previous study.31 Briefly, two dyes, chemical name Fluorol 555 (Exciton Inc., Dayton, Ohio) and Pyrromethene 597-8C9 (Exciton Inc., Dayton, Ohio), were dissolved in a clear polyurethane resin using a master-batch dilution protocol described in Ref. 31.
The fluorol (FL) and pyrromethene (PM) dyes were chosen because they are well characterized as soluble and stable in polymer resins.33–37 Moreover, their emission spectral features are close to coumarin (DEAC), fluorescein (FITC), 5-carboxytetramethylrhodamine (5-TAMRA), cyanine (Cy5.5), 5-aminolevulinic acid hydrochloride (5-ALA), and indocyanine green (ICG) dyes, which will be used for the in vivo human subject studies. The FDA-approved dyes were not selected for this study because they lack long-term photostability, while the currently selected FL and PM dyes have been used in dye laser research, where photostability is required.
The liquid resin dye-in-polymer material was poured in a 2.5-cm diameter cylindrical mold, and the solid material was then sliced into thin disks using a Saw Microtome. The final fluorescence targets were die-cut into distinctive star shapes with an outside dimension of . The molar concentration of the fluorescent targets was in the range of 1 to to match the molecular probe concentrations which are topically applied for in vivo human subject studies.
In the current study, three types of dye-in-polymer targets were fabricated: the FL-only, the PM-only, and the FL-PM mix. The FL-PM mix targets represented the spatial co-location of molecular probes at the biomarker hot-spots. The FL and PM dye-in-polymers’ quantitative capability was then tested using a calibrated spectrophotometer following the same experimental setup as previously described in Ref. 31. A 442-nm laser (Blue Sky Research, Milpitas, California) was used as the excitation for the FL target, a 532-nm laser (Blue Sky Research) was used for the excitation of the PM target, and accordingly, a 450-nm in-line long-pass filter (NT62-982, Edmund Optics Inc. Barrington, New Jersey) or a 532-nm in-line rejection filter (NT63-346, Edmund Optics Inc.) was used individually for each excitation wavelength to attenuate excitation laser light. The fluorescence emission spectra of the two dye targets, measured from a spectrometer (USB2000+, Ocean Optics, Inc., Dunedin, FL), were plotted and overlaid to represent the dye cross-talk issue.
2.1.2. Barrett’s esophagus phantom
In the current study, a color-matched Barrett’s esophagus phantom was used. Design and fabrication details of this phantom were described in a previous publication.31 The fluorescent dye-in-polymer targets were attached with transparent adhesive tape to the simulated Barrett’s esophagus regions to resemble molecular probe-labeled high-grade dysplasia and early cancerous hot-spots of the mucosal surface.
2.2. Imaging Platform
A 1.2-mm outer diameter (OD) scanning fiber endoscope (SFE) was used in the current study. The laser-based SFE technology was developed in our laboratory for the purpose of performing high-quality, wide-field (FOV up to 100 deg) video imaging via an ultrathin and flexible endoscope.38 Unlike a conventional passive imaging system that uses diffuse light illumination, the SFE incorporates low-power blue (442 nm), green (532 nm), and red (635 nm) laser illumination. The lasers can be collectively or selectively launched at the base station, and sent to the distal end of the SFE scope via a single-mode optical fiber. The resulting laser beam is focused by a lens assembly and scanned in a spiral pattern by a tube piezoelectric actuator across the field of view. Both reflected and fluorescence light are collected by a concentric ring of high-numeric aperture multimode optical fibers surrounding the central fiber scanner and lens assembly. The collected light is focused onto the two dichroic beam splitters, and then separated into three (red, green, and blue, respectively) detection channels. Prior to impinging on the photomultiplier tube (PMT) detection channel, the color separated light beam passes through a high-optical density band-pass filter. The SFE system software then maps the synchronized PMT detection signals as points in the spiral scan pattern to the two-dimensional pixel position of the RGB digital display. At a standard setting, the SFE outputs 500-line images at a frame rate of 30 Hz.
2.3. SFE Imaging Solutions for Dye Cross-Talk
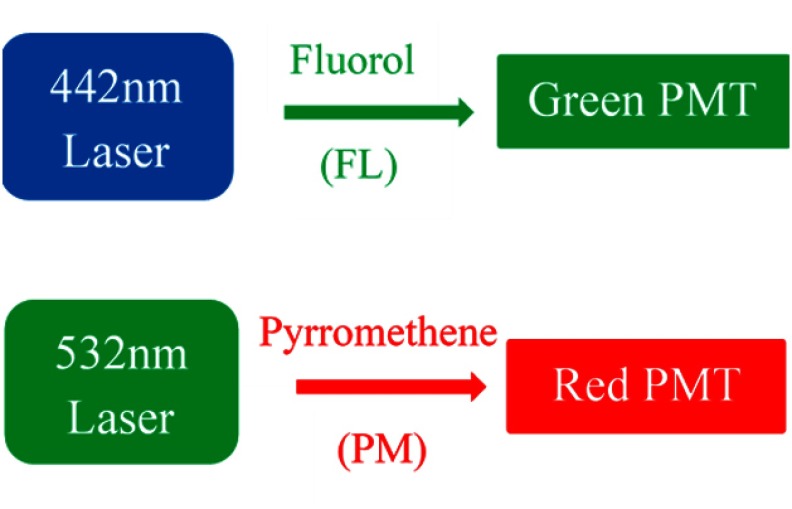
In the present study, the 442-nm laser was used as excitation for the FL dye-in-polymer targets, and the green detection channel was used to detect its fluorescence emission, whereas the 532-nm laser was used for the excitation of the PM dye-in-polymer targets, and the red detection channel was used to detect its fluorescence emission, as illustrated in Fig. 1.
Fig. 1.
SFE excitation lasers and output channels for two-dye fluorescence imaging. The 442-nm laser was used as excitation for the FL dye targets, and the green detection channel was used to detect its fluorescence emission, whereas the 532-nm laser was used for the excitation of the PM dye targets, and the red detection channel was used to detect its fluorescence emission.
The SFE’s ability to perform fluorescence image quantification was tested and verified previously.29 For quantitative two-dye imaging, the automatic gain control in the SFE system was turned off. The gain and offset on the PMTs as well as the electronic digital display were also calibrated and maintained at a constant value. SFE images and video frames were captured and saved through the system software and analyzed off-line. In the current study, a color-matched Barrett’s esophagus phantom was used. Three types of aforementioned fluorescence targets, FL dye only, PM dye only, and FL-PM mix, were all placed in the phantom mucosal surface for the dual-fluorescence imaging.
To mitigate the fluorescence dye emission cross-talk, three approaches were implemented and evaluated.
2.3.1. Merging multispectral fluorescence scans using image stitching
Key concept
In separate image capture scans, alternating once between excitation lasers, a continuous series of images were captured as the SFE scope was moved along the central axis of the phantom. All the fluorescent targets were distributed on the phantom surface, but only a single-fluorescent species was excited in each scan. An image stitching algorithm32 was applied to 40 to 50 video frames of each scan and generated a 2-D anatomical map containing the fluorescent hot-spots. Finally, these individual 2-D maps were spatially registered and combined using shared anatomical features. This wavelength-separated image collection approach has minimal dye emission cross-talk, as the dyes are excited at separate wavelengths.
SFE dual-fluorescence imaging
A simplified flowchart containing the key steps of the image stitching approach is shown in Fig. 2. First, FL target fluorescence and reflectance images were recorded. To concurrently obtain the fluorescence and reflectance images, the 442-nm laser was turned on as illumination source and the 532 and 635-nm lasers were disabled. The reflectance image was captured in the blue channel, and the fluorescence was captured in the green channel.
Fig. 2.

Flowchart for the concept of two-dye imaging using image stitching. In the first scan, concurrent FL target fluorescence and reflectance images were recorded, and then imported into the image stitching software to generate a two-dimensional (2-D) FL dye fluorescence hot-spot map. In the second scan, concurrent PM target fluorescence and reflectance images were recorded, and a 2-D PM dye fluorescence hot-spot map was then generated. The software then spatially registered and merged the individual FL and PM map into a combined map with FL-only, PM-only, and FL-PM mix targets.
Once the first scan was finished, the recorded images were imported into the image stitching software to generate a 2-D unwrapped map of the lower esophagus with FL fluorescence hot-spots. The second scan for the PM target followed the same procedure, except that in this case, the 532-nm laser was turned on as illumination source and the other two lasers were disabled. The reflectance image of the lower esophagus phantom and the targets were captured in the green channel, and the PM fluorescence was captured in the red channel. A 2-D unwrapped map of the lower esophagus with PM fluorescence hotspots was then generated. The 2-D FL and PM fluorescence stitched maps were then spatially registered and merged into a map showing all three types of fluorescence targets: PM, FL, and PM-FL mix.
Image stitching algorithm and software design
As described in the previous section, image stitching is used to combine multiple frames from the endoscopic scan into a single 2-D map. This section will further describe the approach and process involved.
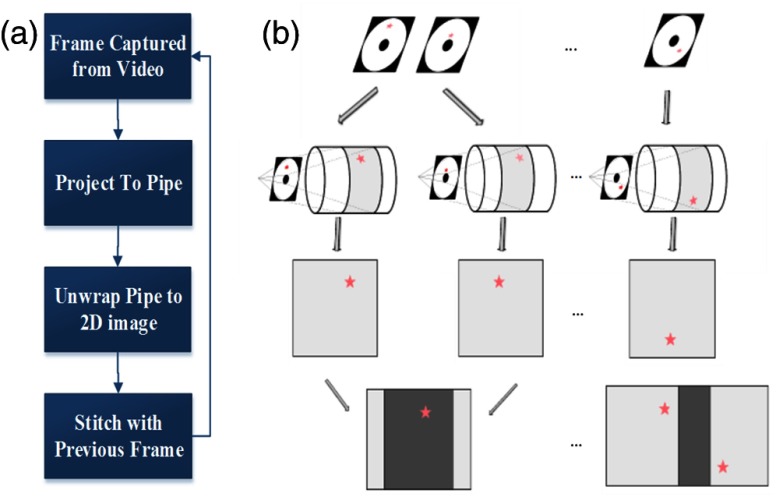
As illustrated in Fig. 3, the image stitching software operates by first capturing images or frames from the video stream, and then the endoscopy image frame is projected onto a three-dimensional (3-D) surface model. A virtual pipe/cylinder surface model is used as it represents the general shape of an esophagus.39,40 After the pipe projection, the texturized surface map of the cylinder is unwrapped and shown in 2-D. Next, the 2-D unwrapped individual frame is stitched together with the previous frame. This process is achieved by leveraging the SFE’s unique feature, where reflectance and fluorescence images are acquired simultaneously. Reflectance images are used to calculate the required transformation between frames due to the camera motion. For this step, a normalized cross-correlation method is first applied to calculate the initial transformation and align the frames together at pixel level, and then optical flow (Lucase-Kanade) algorithm is used to reach a higher-accuracy image alignment at a subpixel level.41–43 The calculated transformation is then applied to both current reflectance and fluorescence images to form a combined image with the previous frame. By stitching successive frames together, a dual-mode reflectance-fluorescence 2-D mosaic map of the lower esophagus is formed. The 2-D mosaic map for individual fluorescence scan can then be registered together to form a final composite mosaic map with multispectral fluorescence hot-spots. The mosaicking software was originally created to assist biopsies and document findings during fluorescence endoscopy for HDG and early cancerous lesions in BE. This approach also demonstrated enhanced signal-to-noise ratio (SNR) fluorescence imaging by using co-acquired high SNR reflectance imaging.32
Fig. 3.
(a) A flowchart shows the pipeline of image stitching software. (b) Graphical illustration of the pipeline.
2.3.2. Concurrent multispectral fluorescence imaging
Key concept
In this approach, all fluorescent species are illuminated concurrently with both the lasers and have their emissions collected simultaneously. The dye emission cross-talk is mitigated by applying a FL Cross-talk ratio subtraction (CRS) algorithm:*
| (1) |
| (2) |
; ; ; Note: Equation (2) only applies if green channel has contribution from a single dye.
In step 1, a constant:FL dye Cross-talk Ratio (CR) is calculated from Eq. (1) by experimentally imaging FL dye targets alone at various intensities and distances in the phantom. In step 2, concurrent laser wavelength excitation is enabled. The FL dye cross-talk signal [calculated as Measured in Eq. (2)] is subtracted from the red detection channel, and the corrected PM dye red signal intensity is therefore obtained.
Concurrent SFE dual-fluorescence imaging
A series of SFE calibration experiments were performed with the dye-in-polymer materials. First, a test was carried out to verify that the laser excitation wavelengths exclusively excited one of the two dye targets, for example, the 442-nm laser alone does not cause PM fluorescence emission and the 532-nm laser alone does not cause FL fluorescence emission. Next, the linearity of the fluorescence detection channels ( and ) was tested by plotting the fluorescence images’ pixel intensity versus the dye molar concentration of the targets, as previously described.31 Then, the aforementioned Cross-talk Ratio (CR) was calculated from images with 442 nm excitation only. The fluorescence intensity was obtained by selecting a target region in the resultant images and by calculating an average intensity for all pixels enclosed in this target region. Also, the consistency of the CR was tested by plotting it against the distance of the SFE to the fluorescence targets. This CR is then applied to the concurrent red detection channel based on Eq. (1) to subtract out the FL dye emission cross-talk. Concurrent images and videos are then acquired.
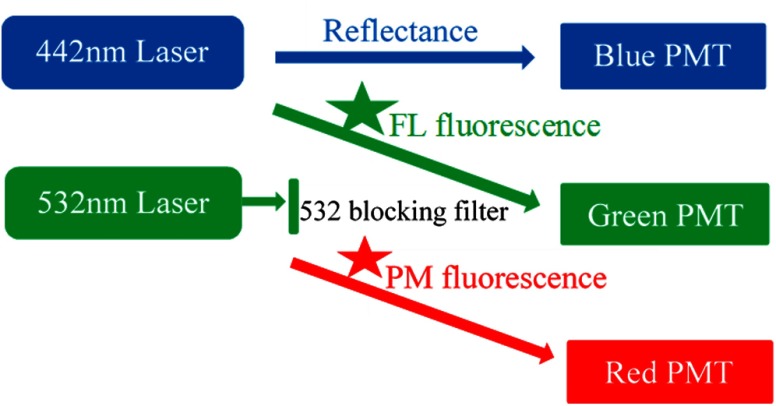
The SFE setup is illustrated in Fig. 4. The 442- and 532-nm lasers were turned on for the simultaneous illumination of FL and PM fluorescence targets, respectively. The green detection channel was used to receive the FL emission signal, whereas the red detection channel was for the PM emission. A short-wave pass filter (SP01-532RU, Semrock, Rochester, New York) was used in the green detection channel to block the 532-nm excitation laser.
Fig. 4.
Dual-mode fluorescence-reflectance two-fluorophore imaging. The 632-nm laser is powered off. The 532-nm laser is blocked in front of the green detection channel, only allowing fluorescence signal to pass through. Therefore, the green and red detection channels are configured for fluorescence imaging, whereas the blue detection channel is for reflectance imaging.
2.3.3. Sequential multispectral fluorescence imaging
Key concept
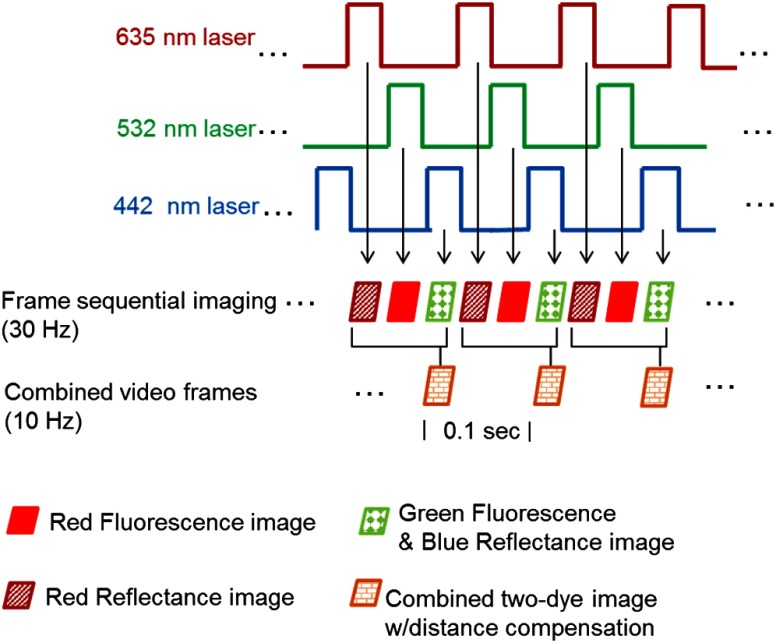
This method addresses the dye emission cross-talk problem through excitation and collection of one fluorescence species at a time. However, instead of using image stitching to post-process and composite the multiple fluorescence target images, this sequential imaging approach works by sequentially activating the excitation lasers in an interleaved-pulsed mode, as illustrated in Fig. 5. As a result, the fluorescence signals are individually acquired in an interleaved mode, and then composed at near real time.
Fig. 5.
Graphic illustration of the frame sequential multispectral fluorescence imaging technique. Each of the red, green, and blue lasers was turned on individually and sequentially. Meanwhile, red reflectance, PM red fluorescence, and FL green fluorescence were received in the detection channels sequentially at 10 (30/3) Hz. The red reflectance frames were acquired to enable the Distance Compensation (DC) algorithm for quantitative fluorescence imaging. When the DC algorithm is not needed for the application, only PM red and FL green fluorescence are acquired at 15 (30/2) Hz. In normal operation, red, green, and blue reflectance are used for conventional “white light” color imaging.
SFE dual-fluorescence imaging
A new SFE system feature was implemented to enable the excitation lasers to be sequentially activated, so that the red, green, and blue lasers were turned on one at a time. In the detection channels, red reflectance, PM red fluorescence, and FL green fluorescence were received sequentially at 30 Hz (10 Hz for each). The red reflectance images were acquired to enable the application of the Distance Compensation algorithm.31 This quantification uses an empirically optimized nonlinear ratiometric method to compensate for the difference in relative distance and orientation between the fluorescence targets and the distal end of the SFE probe. The composite rendering was formed from sequential red fluorescence, green fluorescence, and blue reflectance images merged together into full RGB images.
3. Results
3.1. Characterization of Fluorescence Dye Emission Cross-Talk
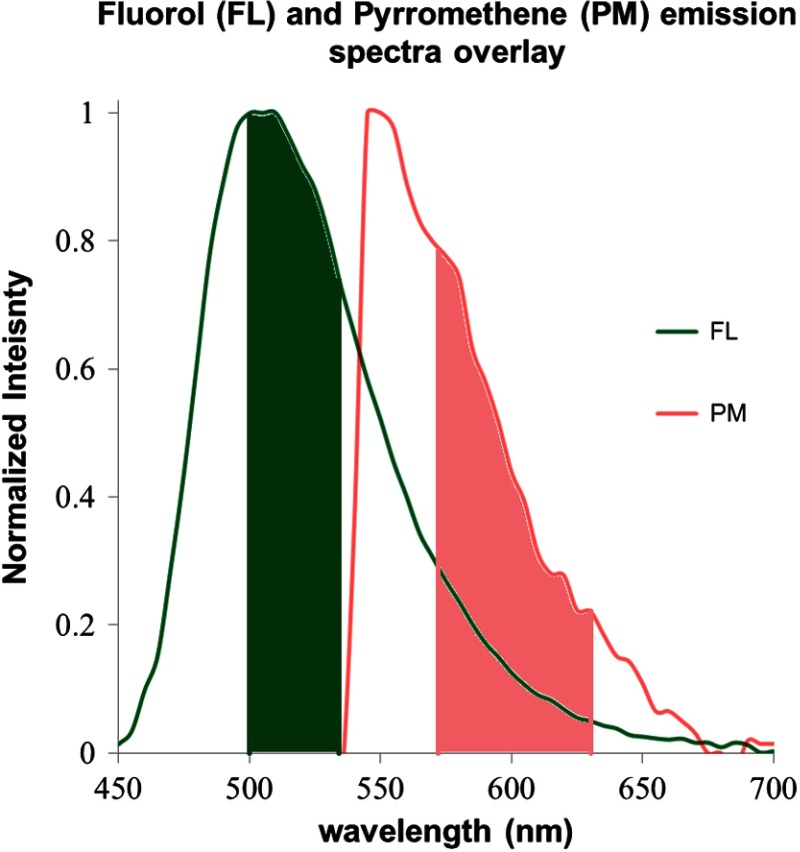
The FL dye-in-polymer targets produced an emission that peaked at 500 nm under 442-nm laser excitation, and the PM dye-in-polymer targets produced an emission that peaked at 550 nm under 532-nm laser excitation (Fig. 6). The observed emission spectra closely matched the published fluorescent dye profile.34–37 Figure 6 shows that the emission spectra of the two dyes exhibit cross-talk, and the long-wavelength tail portion of the FL dye emission spectrum overlaps the PM dye emission from to . The band pass ranges of the SFE green and red channels, which are situated at 500 to 540 nm and 570 to 640 nm, respectively, are also plotted and are highlighted as solid green and red colors in Fig. 6.
Fig. 6.
FL and PM dye-in-polymer fluorescence emission spectra superimposed over the SFE green and red channel detection ranges. The FL targets were excited with a 442-nm laser and produced an emission (shown in green) that peaked at 500 nm. The PM targets were excited with a 532-nm laser and produced an emission (shown in red) that peaked at 550 nm. The band pass ranges of the SFE green (500 to 540 nm) and red (570 to 640 nm) channels are also plotted and highlighted as solid green and red colors. The emission spectra of the two dyes exhibits cross-talk, specifically, the long wavelength tail portion of the FL dye emission spectrum overlaps the PM dye emission from to .
3.2. SFE Imaging Solutions for Dye Cross-Talk
3.2.1. Merging two-dye fluorescence hotspots using image stitching
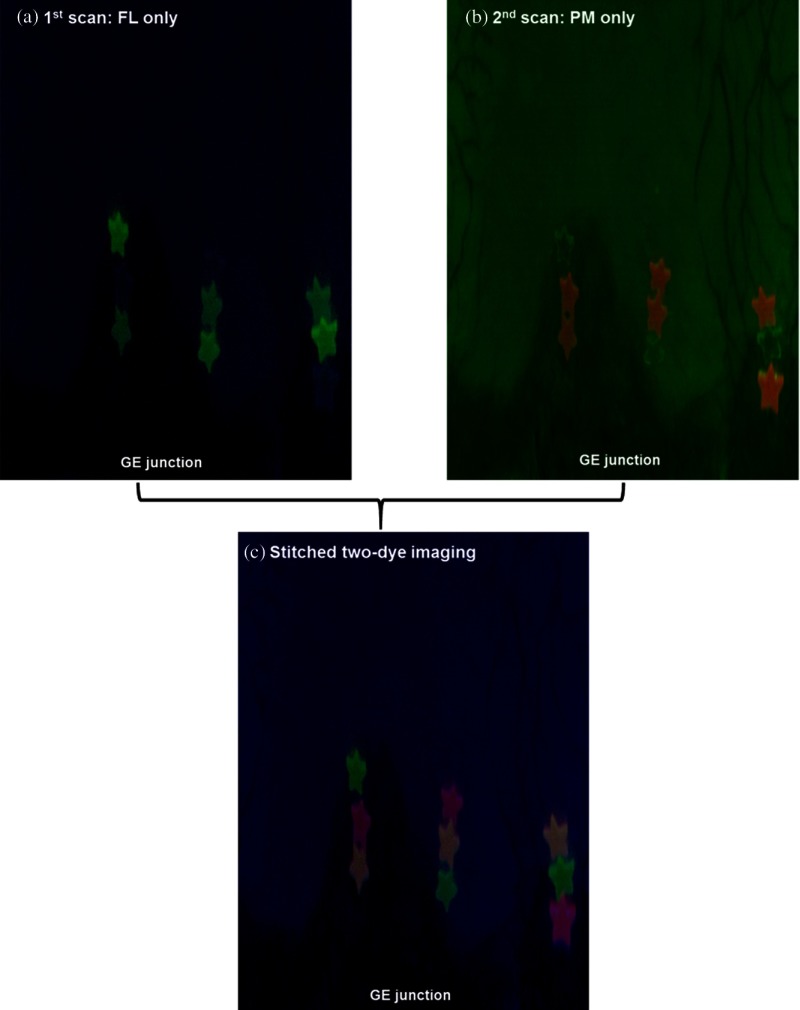
Two sets of SFE dual-mode reflectance-fluorescence images were collected, as described in Fig. 2. The first image consists of the FL dye target emission and the second consists of the PM dye emission. All the other experimental factors (laser power, gain and offset, etc.) were held constant during the image acquisition. The stitched and unwrapped 2-D map for the FL imaging [Fig. 7(a)] comprised the blue reflectance images shown as the background with the FL green fluorescent hot-spots. Meanwhile, the 2-D stitched map for the PM imaging [Fig. 7(b)] comprised the green reflectance image of the same background scene as in Fig. 7(a) with the PM red fluorescent hotspots. The red fluorescence appeared as an orange color in Fig. 7(b). This was due to the overlap of the red PM targets’ color with the green background reflectance.
Fig. 7.
(a) The stitched and unwrapped 2-D map for the FL imaging. It comprised the blue reflectance images shown as the background with the FL green fluorescent hotspots. (b) The 2-D stitched map for the PM imaging. It is comprised of the green reflectance image in the background with the PM red fluorescent hotspots. (c) The combined stitched map is shown. Only the FL fluorescence is shown in the green display channel and the PM fluorescence in the red display channel. The FL-PM two-dye targets are shown as orange.
The two separate stitched 2-D maps were then combined and spatially registered using shared information from the blue and green reflectance channels. In the combined stitched map shown in Fig. 7(c), only the FL fluorescence is shown in the green display channel and the PM fluorescence is in the red display channel. The FL-PM two-dye targets are shown as orange. No dye cross-talk was observed.
3.2.2. Concurrent multispectral fluorescence imaging
Experiments were conducted to verify that the 442-nm laser exclusively excites FL emission, while the 532-nm laser exclusively excites PM emission. The results were in agreement with the previous publications on FL and PM dye absorption profiles.33,34,36,37 Therefore, cross-talk between the green and red SFE detection channels arises only from the overlapping fluorescence from the two dyes, as illustrated in Fig. 6. For the micromolar dye concentrations used in this study, dye-to-dye energy transfer was not observed.
A linearity test of the fluorescence output channels was conducted, and the results are plotted in Figs. 8(a) and 8(b). The response of the SFE green and red detection channels were measured by imaging FL and PM targets containing precise dye concentrations. Linear relationships were measured for the dye-in-polymer concentrations, as shown in Fig. 8.
Fig. 8.

Fluorescence dye-in-polymer concentrations were plotted against the detected fluorescence signals in the SFE images. Specifically, (a) shows the dependence for the SFE green detection channel and (b) shows the dependence for the SFE red detection channel. The data shows that a linear relationship exists for both (a) and (b) cases.
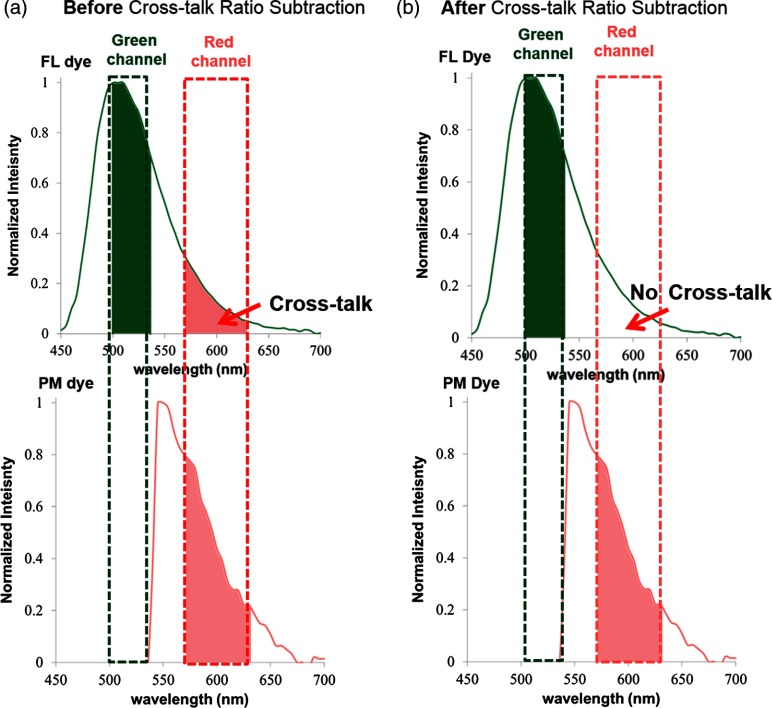
By applying the cross-talk ratio subtraction (CRS) algorithm presented in Eqs. (1) and (2), the FL dye cross-talk ratio (CR) was calculated, and concurrent SFE dual-fluorescence imaging with corrected PM dye signal from the red detection channel was obtained. This process is graphically illustrated in Fig. 9.
Fig. 9.
Graphic illustration of concurrent multispectral imaging before (a) and after (b) applying the CRS method. (a) Before the CRS algorithm, PM dye signal and a confounding FL dye cross-talk signal were detected in the concurrent red channel. (b) After the CRS algorithm, the FL cross-talk was mitigated and only the true PM dye signal was detected in the red channel.
The consistency of the CR was tested, and the concurrent imaging with CRS algorithm was qualitatively and quantitatively demonstrated.
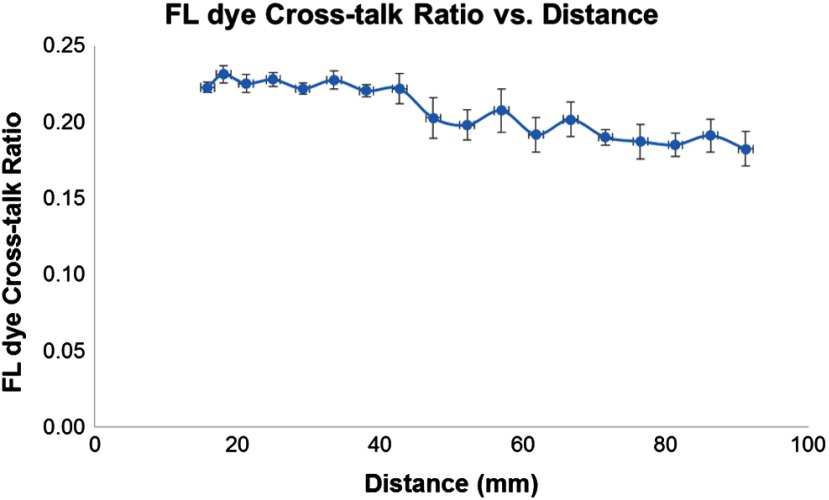
First, the consistency of the FL dye CR was tested by imaging the same FL target in the phantom over a range of distances between the SFE scope and the target. The CR was calculated and plotted as a function of the distance. The results, as shown in Fig. 10, demonstrated that the CR remained constant () within 15 to 40 mm range and was relatively consistent () across 15 to 95 mm distance range. Distances less than 15 mm were not included as the PMT detector was saturated, whereas at distances more than 95 mm, the signal intensity was too low to be measured.
Fig. 10.
The FL cross-talk ratio was plotted as a function of the distance between the distal end of the SFE endoscope and the fluorescence target. The ratio remained constant () over a distance range of 15 to 40 mm and remained relatively consistent () across a distance of 15 to 95 mm.
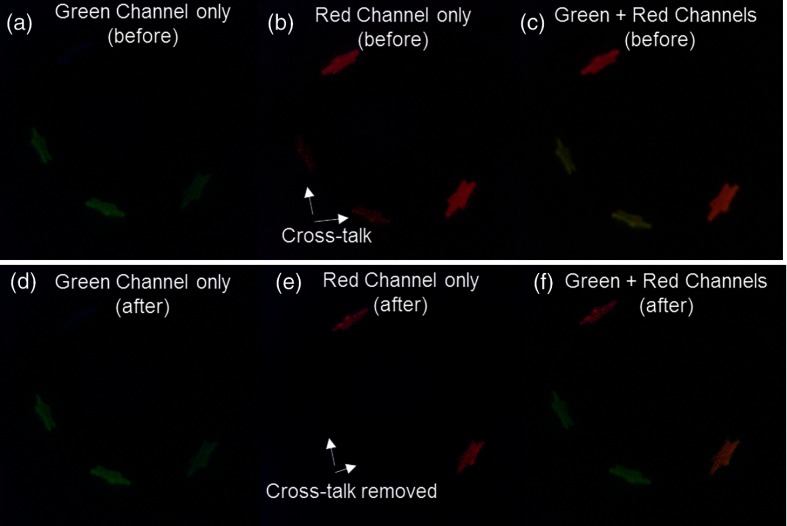
During concurrent SFE dual-fluorescence imaging of FL and PM targets, before applying the FL CRS algorithm, the FL-only targets exhibited erroneous fluorescence signal in the red channel [Fig. 11(b)]. Once the CRS algorithm was applied, the confounding FL red channel signal was strongly attenuated, and the erroneous FL image was removed [Fig. 11(e)].
Fig. 11.
Concurrent multispectral fluorescence SFE imaging of the BE phantom at 30-Hz frame rate. (a–c) Green, red, and combined display channels before applying CRS algorithm. (b) The FL-only targets exhibited erroneous fluorescence signal in the red channel. (c) Green FL appeared with a subtle yellow shade by the addition of red channel bias, due to FL emission cross-talk with the red dye channel. (d–f) Green, red, and combined display channels after CRS algorithm was applied. (e) The confounding FL red channel signal was strongly attenuated after CRS. (f) The combined image after CRS showed correctly rendered green FL, red PM, and orange two-dye images. All images were single-frame raw video outputs from SFE imaging (80-deg field of view, 500-line resolution).
This cross-talk also acted as a confounder and interfered with the green FL dye fluorescence display, causing it to appear with a subtle yellow shade, as in Fig. 11(c), by the addition of red channel bias to the green channel. The FL-only targets were, therefore, misrepresented in the display as two-dye targets, since they had fluorescence signals from both the green and red detection channels. After applying the CRS algorithm, the confounding FL red channel contribution was removed, and the green FL targets appeared in the correct green color [Fig. 11(f)]. The concurrent two-dye target imaging after applying the CRS algorithm in Fig. 11(f) showed correctly rendered green FL, red PM, and orange two-dye display images.
Furthermore, quantitative measurements of fluorescence intensity dependence on dye concentration were conducted, and the results were shown in Fig. 12. In this series of experiments, the PM dye with a range of concentrations (25, 50, and , respectively) were mixed with a constant concentration () of FL dye. A target with no dye-in-polymer was also used to obtain the system noise floor. The “true” PM signal was obtained by activating only the 532-nm laser and recording the red channel signal from the PM target. Initially using concurrent laser excitation, the red channel detector signal from the PM fluorescence was contaminated by the FL cross-talk signal [Fig. 12(a)]. Therefore, in Fig. 12(a), before the CRS algorithm, the fluorescence signal from the red detector channel deviated from the true PM curve. However, after applying the CRS algorithm [Fig. 12(b)], the red fluorescence signal closely matched the true PM fluorescence curve, and the cross-talk signal was reduced by over 90%.
Fig. 12.
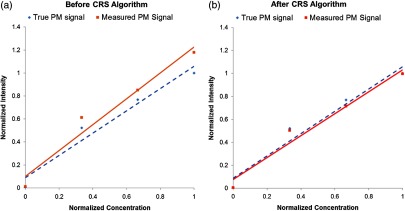
Comparison of the signal from the red output channel to the true PM targets signal during concurrent multispectral fluorescence imaging. (a) Before applying the CRS algorithm, the red fluorescence signal from the red detection channel (solid line) deviated from the true PM curve (dashed line). (b) After applying the CRS algorithm, the red fluorescence signal (solid line) closely matched the true PM fluorescence curve (dashed line).
3.2.3. Sequential multispectral fluorescence imaging
The sequential excitation of the (635 nm), (532 nm), and (442 nm) lasers were successfully implemented in the SFE system. As described in Fig. 5, for the output, a red reflectance image, a PM red fluorescence + green reflectance image, and a FL green fluorescence + blue reflectance image were sequentially received at a 30-Hz frame rate resulting in a 10-Hz frame rate for the combined two-dye fluorescence imaging.
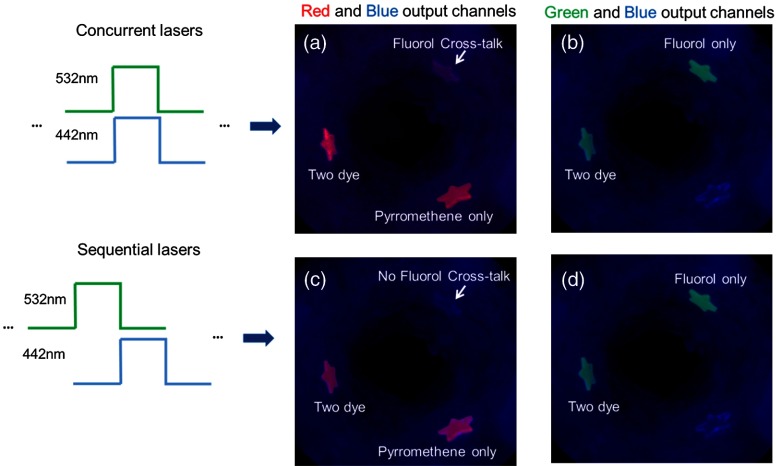
In Fig. 13, the combined two-dye images contained fluorescence signals from the red and green detection channels with the reflectance signal from the blue detection channel. In concurrent laser excitation [Fig. 13(a)], the FL cross-talk signal in the red output channel was present. However, under sequential laser excitation imaging [Fig. 13(c)], temporal separation of the excitation produces uncontaminated images of the PM and the FL dye emissions. As presented earlier, it is known that the FL and PM dyes do not have overlapping blue (442 nm) and green (532 nm) excitation, and therefore sequential excitation is sufficient to separate the overlapping dye emissions.
Fig. 13.
Concurrent laser excitation compared with sequential laser excitation results. In concurrent laser excitation, the FL cross-talk signal was observed in the red output channel in (a), whereas in sequential laser excitation, only PM fluorescence signal was received in the red output channel, and no FL cross-talk was observed (c). The green output channel remained the same under both concurrent (b) and sequential (d) laser excitation, as there was no cross-talk in the green output channel.
In the current study, the red reflectance image was also received at every cycle and can be used as an option for distance compensation, a pixel-by-pixel intensity computation using a nonlinear ratio of the fluorescence and red channel reflectance .31
4. Discussion
Cross-talk is a confounding factor when two or more spectrally intersecting fluorescent dyes are used in endoscopic diagnostic imaging. Approaches to mitigate the fluorescence cross-talk were proposed and tested in this study using a 1.2-mm diameter wide field-of-view endoscope (SFE). The solutions evaluated in the current study were: (1) image stitching, (2) cross-talk ratio subtraction (CRS) algorithm, and (3) frame-sequential imaging.
In the first approach of stitching to merge multiple fluorescence video frames into a panoramic image, cross-talk was avoided, because each fluorescent target was illuminated with one-laser excitation wavelength and the corresponding emission was captured in the appropriate detection channel. The resultant mosaic map display of the lower esophagus [Fig. 9(c)] showed distinguishable green FL-only, red PM-only, and orange two-dye targets with no observed emission cross-talk.
Meanwhile, the stitched multispectral fluorescence mosaic encompassed a much wider view of the observation area than that captured from a single endoscopic frame and could be used for intraoperative navigation for hotspots biopsy or could be saved as the patient electronic medical record for longitudinal surveillance. Moreover, the stitched mosaic map can also be used for extended review by the physicians, without fluorescence photobleaching decreasing the diagnostic signal. The current stitching software generates results within 1 min with good spatial registration score,32 and its performance can be improved using higher processing speed.
However, there are drawbacks in implementing the stitching approach. First, it does not offer true concurrent imaging and visualization of multispectral fluorescence targets; instead, it requires the running of multiple individual scans, which can be slow for clinical practice. This delay can also complicate the image stitching processing, where the stitching algorithm uses shared anatomical features from the reflectance images and assumes that these features remain static between different scans; however, in a typical in vivo setting, unpredictable motions, specular reflections from saline solutions or mucous, and other factors could cause feature shifts to appear in each scan, and therefore, a more robust algorithm for this approach would be needed and will need to be explored for in vivo implementation.
The second approach, concurrent imaging with CRS algorithm, performs simultaneous imaging where all fluorescence species are illuminated, and their fluorescence emissions are collected at the same time. In this case, the cross-talk signal was successfully attenuated in real time by applying the CRS algorithm [as described in Eqs. (1) and 2 and in Fig. 9). The algorithm was applied to the SFE red detection channel during a prescan calibration. The FL dye CR remained consistent over a range of imaging distances (Fig. 12). Specifically, the ratio remained constant () within a distance of 15 to 40 mm and remained relatively consistent () across a distance of 15 to 95 mm. For in vivo clinical practice in the luminal esophagus, a distance under 40 mm is a realistic working distance between the endoscope and region of interest under scrutiny by the clinician. The results also showed that the confounding FL dye cross-talk signal was strongly () reduced (Fig. 11), and quantitative analysis showed that the fluorescence signal closely matched the “true” PM dye fluorescence intensity (Fig. 12).
Compared with the image stitching approach, the concurrent imaging approach provides visualization of multispectral fluorescent targets/hotspots simultaneously and in real time. This concurrent method is beneficial for wide-field endoscopic imaging and image-guided biopsies. Viewing coincident emission signatures from multiple dyes will provide a more accurate molecular diagnosis than a single fluorescent marker.3,30,44,45 Moreover, the concurrent imaging approach is more robust and accurate than the image stitching approach for in vivo settings, since the removal of dye cross-talk is not affected by unpredictable motion or specular reflections that complicate image indexing.
However, there are some drawbacks to the concurrent imaging approach in a clinical setting. First, a prescan calibration is needed to calculate the cross-talk ratio by imaging a fluorescent standard. Additionally, the gain and offsets on the light detection PMTs and digital outputs must be maintained at a constant level between calibration and measurement scans. This is an extra step that must be automated in a clinical or in vivo study. Meanwhile, as shown in Fig. 12, the FL CR remained constant within the distance range of 15 to 40 mm, but this ratio fluctuated slightly and decreased when extended to a 95-mm distance. This irregularity could be a drawback, if the distance accuracy of the fluorescence intensity must be maintained over a very wide range.
The third approach, frame-sequential imaging, was carried out by timed excitation and light collection from only one fluorophore species at a time. This temporal separation of laser illumination and light collection minimizes cross-talk in a manner similar to the image stitching approach; however, instead of collecting the emission signal separately and processing groups of image frames, the frame-sequential imaging method cycles through all the laser excitation and dye emission combinations at 30 Hz. Therefore, the relatively stationary position of organs and tissue during the fast-frame rate imaging process removes the need for image registration. Meanwhile, visualization of multispectral fluorescence hotspots can be achieved by combining each cycle of image outputs: red PM dye fluorescence, green FL dye fluorescence, and blue reflectance into combined RGB image frames, which can be displayed in real time during the endoscopy procedure.
In standard RGB operation, the SFE refresh rate is 30 Hz, since the image is a composite of all three concurrent colors. However, in the sequential imaging mode, the SFE system runs at a 10-Hz frame rate (or 15 Hz if distance compensation algorithm is not applied) for each of the individual fluorescence and reflectance frames. Therefore, when the number of fluorophores increases, the frame rate for the sequential images must increase by a factor somewhat larger than the number of fluorophores, in order to display a real-time view that adapts to body and endoscope movements. Imaging with a low-frame rate will be limited to viewing objects that undergo very slow motions, which may not be adequate for clinical endoscopy. Upgrading the present SFE endoscope system to a higher-frame rate is feasible with faster modulation laser components.
The summary of the three proposed approaches are listed in Table 1.
Table 1.
Strengths and limitations for the three solutions.
| Solutions | Strengths | Limitations | Comments |
|---|---|---|---|
| Image stitching | Avoids dye cross-talk. Can be used for extended review and less susceptible to fluorescence photobleaching. Can be saved as patient record. | Data processing is intensive and slow. Algorithms may not be robust enough to compensate for unpredictable motion and other factors for in vivo imaging. | Software and algorithm improvements are needed for real-time implementation. |
| Concurrent imaging using CRS algorithm | Reduces dye cross-talk. Real time Compatible with in vivo clinical scenario. | Prescan calibration is needed, and device settings must be maintained. | Best solution for the short term. |
| Frame sequential imaging | Avoids dye cross-talk. No prescan calibration is required. Near real-time multispectral fluorescence imaging. Compatible with in vivo scenario. |
Achieving a high target-to-background ratio () is a driving factor in the clinical realization of optical molecular imaging.1 For in vivo optical imaging using exogenous-targeted contrast agents, the nonspecific binding and material accumulation (pooling) of contrast agent46,47 and tissue autofluorescence (AF) can cause a significant decrease in the . AF is the major contributor to the background signal in topical application of fluorescence probes to epithelial tissue, since nonspecific accumulation is minimized in this situation.7
The proposed approaches can also reduce the background tissue autofluorescence signals that degrade . It has been reported that tissue AF signals can mask exogenous molecular probe fluorescence, which can limit the in vivo .1,2 In the esophagus, stromal collagen is believed to be primarily responsible for the AF signal, especially when excited in the near-UV to blue spectral range.2,48–50 Therefore, collagen AF could be a major confounder for commonly used fluorophores such as coumarin, DEAC, and FITC. Molecular imaging studies27 of mouse colon cancer using a FITC-conjugated peptide marker produced a of only 2 to 3, as a result of AF.10,27 Reducing the AF background signal can increase this ratio. Eliminating the AF background using chemical agents, such as Sudan black, has been reported in confocal laser scanning microscopy, but is not applicable for in vivo clinical endoscopy.51 On the endoscopic imaging device, if a detection channel was designated for autofluorescence, the AF image could be subtracted out from the fluorescent marker channel using either concurrent or frame sequential imaging methods. These improvements could lead to an enhanced ratio.
To test this concept, an AF feature was added to a color-matched BE phantom (Fig. 14). The autofluorescence background feature was added to the Barrett’s esophagus (BE) phantom.52 In summary, collagen fibers (collagen type I, insoluble from bovine, Sigma-Aldrich, St. Louis, Missouri) were converted to powder through heating, drying, and mechanical processing. De-ionized water () was added, and the resulting paste was evenly applied over the phantom subsurface to simulate the stromal collagen layer. After drying, a paint simulated healthy and BE mucosal layer and was applied evenly over the collagen layer and allowed to dry.
Fig. 14.
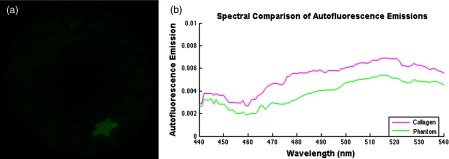
(a) Normalized fluorescence emissions captured by the SFE between 500 and 540 nm after excitation at 442 nm. The star shape is a FL-in-polymer dye target with a concentration of 1 μM, whereas the background fluorescence is due to the embedded collagen AF. Image analysis shows the target-to-background signal ratio was 4:1. (b) Comparison of AF emissions shows that the phantom fluorescence emission is similar to that of pure collagen. A spectrometer was used to test the excitation fiber to address concerns that it may exhibit autoflouresence (USB2000+, Ocean Optics, Inc.). No autofluorescence signal was detected with the laser excitation power used in the current study.
Autofluorescence background subtraction was shown to enhance image contrast for tumor detection,53 and it is an embedded software technology in the commercially available IVIS benchtop system.54 An estimate of the proposed signal improvement was obtained by subtracting the AF background in Fig. 14, and the increased from 4 to . This enhancement elevates the performance of UV-blue excited fluorophores (e.g., FITC) to the level achieved with red and NIR dyes,16,28 which are excited and fluorescence in spectral regions considered more immune from AF.6 Indocyanine green, the only FDA-approved NIR fluorescent dye, 55,56 has a hydrophobic, large heptamethine interior that is surrounded by a negatively charged surface shell.57 This molecular arrangement will result in comparatively high nonspecific binding and may degrade the advantage of ICG especially in systemic applications.57,58 On the other hand, this charge distribution pattern is not present in the FDA-approved FITC dye that has a peak excitation wavelength at 488 nm.55 Less nonspecific binding of FITC combined with mitigation of its AF signal makes this dye a more viable choice for molecular imaging. Gaining FDA approval for any new dye is a very costly and time consuming endeavor, and to date no other fluorescent dyes have received clearance for use in routine human clinical procedures. Therefore, any measure that enhances the performance of existing FDA-approved dyes has significant translational impact for molecular imaging technology.
Situations where cross-talk occurs for both dye excitation and emission or cases with “extreme” cross-talk, where the two dyes’ emissions completely intertwine, were not studied, as these situations can be avoided by selecting alternate dye labels. The probes which are likely to be used with the SFE for in vivo study in the near future are coumarin (DEAC), fluorescein (FITC), 5-carboxytetramethylrhodamine (5-TAMRA), cyanine (Cy5.5), 5-aminolevulinic acid hydrochloride (5-ALA), and indocyanine green (ICG) dyes. These dyes exhibit moderate levels of intersection compatible with the three proposed spectral overlap solutions. In addition, since the SFE excitation light source is laser based, the excitation bandwidth is , and therefore, in most cases, the excitation overlap can be circumvented. These dyes exhibit moderate levels of intersection compatible with the three-proposed spectral overlap solutions. For cases with extreme emission spectrum overlap, sophisticated algorithms, such as linear unmixing for laser scanning microscopy, have been proposed and applied.15,21,59 However, due to the additional data collection and processing time required, the linear-unmixing approach might not be suitable for real-time wide-field fluorescence endoscopic imaging. In the current study, the image stitching approach and the frame-sequential imaging approach could be applied to solve cross-talk, where the emission spectrum suffers from extreme overlap by separately illuminating each fluorophore, which receive and composite near real-time multispectral fluorescence imaging. Fluorescence life-time imaging is another feasible approach to delineate highly overlapped fluorescence. Recently, fluorescence life-time imaging was applied to delineate fluorescent species60 and detection of early cancer lesions.61 Combining SFE imaging with time-resolved fluorescence spectroscopy was recently reported for biomedical assessment of the bile duct,62 and fluorescence life-time imaging holds potential for the delineation of overlapped multispectral fluorophores.
Studies using quantum dots (QDs) for multispectral fluorescence imaging have also been reported.63,64 Due to the uncertain toxicity and unknown side-effects, QDs are currently not FDA approved and are less likely to be used in human trials than organic dyes. QDs have a symmetric and Gaussian-like emission spectral profile, and therefore have less cross-talk than organic dyes.20 However, in applications where multiple QDs are imaged simultaneously, emission cross-talk can still occur,65,66 and the proposed solutions are applicable to spectral overlap of multispectral fluorescence nanoparticle imaging as well.
In conclusion, we proposed and evaluated three different approaches for the removal of fluorophore emission cross-talk in wide-field multi-fluorophore molecular imaging: image stitching, CRS algorithm, and frame-sequential imaging. To evaluate these solutions, an in vitro phantom with fluorophore emission cross-talk was constructed. The results showed that fluorophore emission cross-talk could be significantly reduced or successfully avoided. At present, the concurrent imaging method is viable for early stage cancer detection in vivo with the wide-field multi-fluorophore SFE imaging device in addition to an initialization step not unlike the white-balancing step for commercial endoscopes. Furthermore, a means to enhance fluorescence ratio that is directly applicable to FITC (FDA-approved dye) by the reduction of autofluorescence background signal was demonstrated.
Acknowledgments
The study was funded by the National Institutes of Health (NCI Grant U54CA163059, PI: T. D. Wang, D. Beer, and E. J. Seibel; NIH R01 EB016457, PI: E. J. Seibel). We would like to thank the reviewers for their constructive comments and suggestions. The authors appreciate Richard Johnston and David Melville at the Human Photonics Lab, University of Washington, for their technical support. Finally, we would also like to acknowledge discussions with Dr. Thomas D. Wang and his research group at the University of Michigan.
References
- 1.Frangioni J. V., “New technologies for human cancer imaging,” J. Clin. Oncol. 26(24), 4012–4021 (2008). 10.1200/JCO.2007.14.3065 [DOI] [PMC free article] [PubMed] [Google Scholar]
- 2.Pierce M. C., Javier D. J., Richards-Kortum R., “Optical contrast agents and imaging systems for detection and diagnosis of cancer,” Int. J. Cancer 123(9), 1979–1990 (2008). 10.1002/ijc.v123:9 [DOI] [PMC free article] [PubMed] [Google Scholar]
- 3.Goetz M., Wang T. D., “Molecular imaging in gastrointestinal endoscopy,” Gastroenterology 138(3), 828–833 (2010). 10.1053/j.gastro.2010.01.009 [DOI] [PMC free article] [PubMed] [Google Scholar]
- 4.van Dam G. M., et al. , “Intraoperative tumor-specific fluorescence imaging in ovarian cancer by folate receptor-α targeting: first in-human results,” Nat. Med. 17(10), 1315–1319 (2011). 10.1038/nm.2472 [DOI] [PubMed] [Google Scholar]
- 5.Kriegmair M., et al. , “Detection of early bladder cancer by 5-aminolevulnic acid induced porphyrin fluorescence,” J. Urol. 155(1), 105–109 (1996). 10.1016/S0022-5347(01)66559-5 [DOI] [PubMed] [Google Scholar]
- 6.Stroud M. R., Hansen S. J., Olson J. M., “In vivo bio-imaging using chlorotoxin-based conjugates,” Curr. Pharm. Des. 17(38), 4362–4371 (2011). 10.2174/138161211798999375 [DOI] [PMC free article] [PubMed] [Google Scholar]
- 7.Hellebust A., Richards-Kortum R., “Advances in molecular imaging: targeted optical contrast agents for cancer diagnostics,” Nanomedicine 7(3), 429–445 (2012). 10.2217/nnm.12.12 [DOI] [PMC free article] [PubMed] [Google Scholar]
- 8.Rosbach K. J., et al. , “Optical molecular imaging of multiple biomarkers of epithelial neoplasia: epidermal growth factor receptor expression and metabolic activity in oral mucosa,” Transl. Oncol. 5(3), 160–171 (2012). [DOI] [PMC free article] [PubMed] [Google Scholar]
- 9.Miller S. J., et al. , “Targeted detection of murine colonic dysplasia in vivo with flexible multispectral scanning fiber endoscopy,” J. Biomed. Opt. 17(2), 021103 (2012). 10.1117/1.JBO.17.2.021103 [DOI] [PMC free article] [PubMed] [Google Scholar]
- 10.Li M., et al. , “Affinity peptide for targeted detection of dysplasia in Barrett’s esophagus,” Gastroenterology 139(5), 1472–1480 (2010). 10.1053/j.gastro.2010.07.007 [DOI] [PMC free article] [PubMed] [Google Scholar]
- 11.Langsner R. J., et al. , “Wide-field imaging of fluorescent deoxy-glucose in ex vivo malignant and normal breast tissue,” Biomed. Opt. Express 2(6), 1514–1523 (2011). 10.1364/BOE.2.001514 [DOI] [PMC free article] [PubMed] [Google Scholar]
- 12.Weissleder R., et al. , “In vivo imaging of tumors with protease-activated near-infrared fluorescent probes,” Nat. Biotechnol. 17(4), 375–378 (1999). 10.1038/7933 [DOI] [PubMed] [Google Scholar]
- 13.Nguyen Q. T., et al. , “Surgery with molecular fluorescence imaging using activatable cell-penetrating peptides decreases residual cancer and improves survival,” Proc. Natl. Acad. Sci. U.S.A. 107(9), 4317–4322 (2010). 10.1073/pnas.0910261107 [DOI] [PMC free article] [PubMed] [Google Scholar]
- 14.Anil R., Sheth, et al. , “Improved detection of ovarian cancer metastases by intraoperative quantitative fluorescence protease imaging in a pre-clinical model,” Gynecol. Oncol. 112(3), 616–622 (2009). 10.1016/j.ygyno.2008.11.018 [DOI] [PMC free article] [PubMed] [Google Scholar]
- 15.Kobayashi H., et al. , “Multimodal nanoprobes for radionuclide and five-color near-infrared optical lymphatic imaging,” ACS Nano 1(4), 258–264 (2007). 10.1021/nn700062z [DOI] [PMC free article] [PubMed] [Google Scholar]
- 16.Kobayashi H., et al. , “New strategies for fluorescent probe design in medical diagnostic imaging,” Chem. Rev. 110(5), 2620–2640 (2010). 10.1021/cr900263j [DOI] [PMC free article] [PubMed] [Google Scholar]
- 17.Mitsunaga M., et al. , “In vivo longitudinal imaging of experimental human papillomavirus infection in mice with a multicolor fluorescence mini-endoscopy system,” Cancer Prev. Res. 4(5), 767–773 (2011). 10.1158/1940-6207.CAPR-10-0334 [DOI] [PMC free article] [PubMed] [Google Scholar]
- 18.Elahi S. F., Wang T. D., “Future and advances in endoscopy,” J. Biophotonics 4(7–8), 471–481 (2011). 10.1002/jbio.v4.7/8 [DOI] [PMC free article] [PubMed] [Google Scholar]
- 19.Longmire M., et al. , “Multi-color in vivo targeted imaging to guide real-time surgery of HER2-positive micrometastases in a two tumor coincident model of ovarian cancer,” Cancer Sci. 100(6), 1099–1104 (2009). 10.1111/cas.2009.100.issue-6 [DOI] [PMC free article] [PubMed] [Google Scholar]
- 20.Resch-Genger U., et al. , “Quantum dots versus organic dyes as fluorescent labels,” Nat. Methods 5(9), 763–775 (2008). 10.1038/nmeth.1248 [DOI] [PubMed] [Google Scholar]
- 21.Dickinson M. E., et al. , “Multi-spectral imaging and linear unmixing add a whole new dimension to laser scanning fluorescence microscopy,” Biotechniques 31(6), 1272–1278 (2001). [DOI] [PubMed] [Google Scholar]
- 22.Zimmermann T., Rietdorf J., Pepperkok R., “Spectral imaging and its applications in live cell microscopy,” FEBS Lett. 546(1), 87–92 (2003). 10.1016/S0014-5793(03)00521-0 [DOI] [PubMed] [Google Scholar]
- 23.Zimmermann T., “Spectral imaging and linear unmixing in light microscopy,” Adv. Biochem. Eng. Biotechnol. 95, 245–265 (2005). 10.1007/b14097 [DOI] [PubMed] [Google Scholar]
- 24.Ohn J., et al. , “High-speed multi-color microscopy of repeating dynamic processes,” Genesis 49(7), 514–521 (2011). 10.1002/dvg.20774 [DOI] [PMC free article] [PubMed] [Google Scholar]
- 25.Fu D., Ma J., Chen J., “Dual-wavelength microarray fluorescence detection system using volume holographic filter,” J. Biomed. Opt. 12(1), 014040 (2007). 10.1117/1.2435174 [DOI] [PubMed] [Google Scholar]
- 26.Muller B. K., et al. , “Pulsed interleaved excitation,” Biophys. J. 89, 3508–3522 (2005). 10.1529/biophysj.105.064766 [DOI] [PMC free article] [PubMed] [Google Scholar]
- 27.Miller S. J., et al. , “In vivo fluorescence-based endoscopic detection of colon dysplasia in the mouse using a novel peptide probe,” PLoS One 6(3), e17384 (2011). 10.1371/journal.pone.0017384 [DOI] [PMC free article] [PubMed] [Google Scholar]
- 28.Liu Z., et al. , “In vivo targeting of colonic dysplasia on fluorescence endoscopy with near-infrared octapeptide,” Gut 62(3), 395–403 (2013). 10.1136/gutjnl-2011-301913 [DOI] [PMC free article] [PubMed] [Google Scholar]
- 29.Al-Kasspooles M., et al. , “Amplification and overexpression of the EGFR and erbB2 genes in human esophageal adenocarcinomas,” Int. J. Cancer 54, 213–219 (1993). 10.1002/(ISSN)1097-0215 [DOI] [PubMed] [Google Scholar]
- 30.Joshi B. P., Wang T. D., “Exogenous molecular probes for targeted imaging in cancer: focus on multi-modal imaging,” Cancers 2(2), 1251–1287 (2010). 10.3390/cancers2021251 [DOI] [PMC free article] [PubMed] [Google Scholar]
- 31.Yang C., et al. , “Color-matched and fluorescence-labeled esophagus phantom and its applications,” J. Biomed. Opt. 18(2), 026020 (2013). 10.1117/1.JBO.18.2.026020 [DOI] [PMC free article] [PubMed] [Google Scholar]
- 32.Yang C., Soper T. D., Seibel E. J., “Detecting fluorescence hot-spots using mosaic maps generated from multimodal endoscope imaging,” Proc. SPIE 8575, 857508 (2013). 10.1117/12.2002219 [DOI] [Google Scholar]
- 33.Lambropoulos M., “Fluorol 7GA: an efficient yellow-green dye for flashlamp-pumped lasers,” Opt. Commun. 15(1), 35–37 (1975). 10.1016/0030-4018(75)90177-7 [DOI] [Google Scholar]
- 34.Lesiecki M. L., Drake J. M., “Use of the thermal lens technique to measure the luminescent quantum yields of dyes in PMMA for luminescent solar concentrators,” Appl. Opt. 21(3), 557–560 (1982). 10.1364/AO.21.000557 [DOI] [PubMed] [Google Scholar]
- 35.Davydov D. R., Davydova N. Y., Halpert J. R., “Allosteric transitions in cytochrome P450eryF explored with pressure-perturbation spectroscopy, lifetime FRET, and a novel fluorescent substrate, fluorol-7GA,” Biochemistry 47(43), 11348–11359 (2008). 10.1021/bi8011803 [DOI] [PMC free article] [PubMed] [Google Scholar]
- 36.Prieto J. B., et al. , “Photophysical properties of the pyrromethene 597 dye: solvent effect,” J. Phys. Chem. 108(26), 5503–5508 (2004). 10.1021/jp0373898 [DOI] [Google Scholar]
- 37.Susdorf T., et al. , “Photophysical characterization of pyrromethene 597 laser dye in silicon-containing organic matrices,” Appl. Phys. B86(3), 537–545 (2007). 10.1007/s00340-006-2439-z [DOI] [Google Scholar]
- 38.Lee C. M., et al. , “Scanning fiber endoscopy with highly flexible, 1 mm catheterscopes for wide-field, full-color imaging,” J. Biophotonics 3(5–6), 385–407 (2010). 10.1002/jbio.v3:5/6 [DOI] [PMC free article] [PubMed] [Google Scholar]
- 39.Rousso B., et al. , “Universal mosaicing using pipe projection,” in Sixth International Conference on Computer Vision, Bombay, pp. 945–952 (1998). [Google Scholar]
- 40.Seibel E. J., et al. , “Tethered capsule endoscopy, a low-cost and high-performance alternative technology for the screening of esophageal cancer,” IEEE Trans. Biomed. Eng. 55(3), 1032–1042 (2008). 10.1109/TBME.2008.915680 [DOI] [PubMed] [Google Scholar]
- 41.Szeliski R., “Image alignment and stitching: a tutorial,” Found. Trends Comput. Graph. Vis. 2(1), 1–104 (2006). 10.1561/0600000009 [DOI] [Google Scholar]
- 42.Szeliski R., Computer Vision: Algorithms and Applications, pp. 430–463, Springer, New York, NY: (2010). [Google Scholar]
- 43.Baker S., Matthews I., “Lucas-Kanade 20 years on: a unifying framework,” Int. J. Comput. Vis. 56(3), 221–255 (2004). 10.1023/B:VISI.0000011205.11775.fd [DOI] [Google Scholar]
- 44.Reid B. J., et al. , “Predictors of progression to cancer in Barrett’s esophagus: baseline histology and flow cytometry identify low- and high-risk patient subsets,” Am. J. Gastroenterol. 95(7), 1669–1676 (2000). 10.1016/S0002-9270(00)00988-6 [DOI] [PMC free article] [PubMed] [Google Scholar]
- 45.Prasad G. A., et al. , “Predictors of progression in barrett’s esophagus: current knowledge and future directions,” Am. J. Gastroenterol. 105(7), 1490–1502 (2010). 10.1038/ajg.2010.2 [DOI] [PMC free article] [PubMed] [Google Scholar]
- 46.Liu J. T. C., et al. , “Quantifying cell-surface biomarker expression in thick tissues with ratiometric three-dimensional microscopy,” Biophys. J. 96(6), 2405–2414 (2009). 10.1016/j.bpj.2008.12.3908 [DOI] [PMC free article] [PubMed] [Google Scholar]
- 47.Wang D., et al. , “Microscopic delineation of medulloblastoma margins in a transgenic mouse model using a topically applied VEGFR-1 probe,” Transl. Oncol. 5(6), 408–414 (2012). [DOI] [PMC free article] [PubMed] [Google Scholar]
- 48.Kara M., et al. , “Autofluorescence-based detection of early neoplasia in patients with Barrett’s esophagus,” Diges. Dis. 22, 134–141 (2004). 10.1159/000080312 [DOI] [PubMed] [Google Scholar]
- 49.Lin B., et al. , “Characterizing the origin of autofluorescence in human esophageal epithelium under ultraviolet excitation,” Opt. Express 18(20), 21074–21082 (2010). 10.1364/OE.18.021074 [DOI] [PubMed] [Google Scholar]
- 50.Banerjee B., et al. , “Tryptophan autofluorescence imaging of neoplasms of the human colon,” J. Biomed. Opt. 17(1), 016003 (2012). 10.1117/1.JBO.17.1.016003 [DOI] [PubMed] [Google Scholar]
- 51.Sun Y., et al. , “Sudan black B reduces autofluorescence in murine renal tissue,” Arch. Pathol. Lab. Med. 135(10), 1335–1342 (2011). 10.5858/arpa.2010-0549-OA [DOI] [PubMed] [Google Scholar]
- 52.Hou V. W., et al. , “Development of a color-matched esophagus phantom featuring autofluorescence,” in Biomedical Engineering Society Annual Meeting, Seattle, WA (2013). [Google Scholar]
- 53.Profio A. E., Balchum O. J., Carstens F., “Digital background subtraction for fluorescence imaging,” Med. Phys. 13(5), 717–721 (1986). 10.1118/1.595836 [DOI] [PubMed] [Google Scholar]
- 54.P. E. I., “IVIS 200 Pre-clinical In Vivo Imaging System | Perkin Elmer,” 1998–2003, http://www.perkinelmer.com/Catalog/Product/ID/IVIS200 (July 2013).
- 55.Alford R., et al. , “Toxicity of organic fluorophores used in molecular imaging: literature review,” Mol. Imag. 8(6), 341–354 (2009). [PubMed] [Google Scholar]
- 56.Pansare V. J., et al. , “Review of long-wavelength optical and NIR imaging materials: contrast agents, fluorophores, and multifunctional nano carriers,” Chem. Mater. 24(5), 812–827 (2012). 10.1021/cm2028367 [DOI] [PMC free article] [PubMed] [Google Scholar]
- 57.Choi H. S., et al. , “Targeted zwitterionic near-infrared fluorophores for improved optical imaging,” Nat. Biotechnol. 31(2), 148–153 (2013). 10.1038/nbt.2468 [DOI] [PMC free article] [PubMed] [Google Scholar]
- 58.Rodriguez V. B., et al. , “Encapsulation and stabilization of indocyanine green within poly(styrene-alt-maleic anhydride) blockpoly(styrene) micelles for near-infrared imaging,” J. Biomed. Opt. 13(1), 014025 (2008). 10.1117/1.2834296 [DOI] [PubMed] [Google Scholar]
- 59.Zacharakis G., et al. , “Spectroscopic detection improves multi-color quantification in fluorescence tomography,” Biomed. Opt. Express 2(3), 431–439 (2011). 10.1364/BOE.2.000431 [DOI] [PMC free article] [PubMed] [Google Scholar]
- 60.Pepperkok R., et al. , “Simultaneous detection of multiple green fluorescent proteins in live cells by fluorescence lifetime imaging microscopy,” Curr. Biol. 9(5), 269–272 (1999). 10.1016/S0960-9822(99)80117-1 [DOI] [PubMed] [Google Scholar]
- 61.Marcu L., “Fluorescence lifetime techniques in medical applications,” Ann. Biomed. Eng. 40(2), 304–331 (2012). 10.1007/s10439-011-0495-y [DOI] [PMC free article] [PubMed] [Google Scholar]
- 62.Seibel E. J., et al. , “Image-guided intervention in the human bile duct using scanning fiber endoscope system,” Proc. SPIE 8218, 82180B (2012). 10.1117/12.910070 [DOI] [Google Scholar]
- 63.Roy M., et al. , “Effect of tissue optics on wavelength optimization for quantum dot-based surface and subsurface fluorescence imaging,” J. Biomed. Opt. 17(2), 026002 (2012). 10.1117/1.JBO.17.2.026002 [DOI] [PubMed] [Google Scholar]
- 64.Kosaka N., et al. , “In vivo real-time, multicolor, quantum dot lymphatic imaging,” J. Investi. Dermatol. 129(12), 2818–2822 (2009). 10.1038/jid.2009.161 [DOI] [PMC free article] [PubMed] [Google Scholar]
- 65.Smith A. M., et al. , “Multicolor quantum dots for molecular diagnostics of cancer,” Expert Rev. Mol. Diagn. 6(2), 231–244 (2006). 10.1586/14737159.6.2.231 [DOI] [PubMed] [Google Scholar]
- 66.Goldman E. R., et al. , “Multiplexed toxin analysis using four colors of quantum dot fluororeagents,” Anal. Chem. 76(3), 684–688 (2004). 10.1021/ac035083r [DOI] [PubMed] [Google Scholar]


