

Significance
Broadly expressed enzymes commonly change chromatin structure and function. How ubiquitous chromatin regulators establish specialized patterns of gene activity is not understood. We identified an important link between a histone methyltransferase and a transcription factor (GATA-1) that controls red blood cell development. We found that distinct combinations of this enzyme and additional chromatin regulators are required for GATA-1 to control transcription at different genetic loci. The resulting regulatory “matrix” provides a conceptual framework for understanding how cell-restricted factors use broadly expressed chromatin regulators to confer specialized gene-expression patterns that control important biological processes.
Keywords: GATA, epigenetics, genomics, erythroid
Abstract
The establishment and maintenance of cell type-specific transcriptional programs require an ensemble of broadly expressed chromatin remodeling and modifying enzymes. Many questions remain unanswered regarding the contributions of these enzymes to specialized genetic networks that control critical processes, such as lineage commitment and cellular differentiation. We have been addressing this problem in the context of erythrocyte development driven by the transcription factor GATA-1 and its coregulator Friend of GATA-1 (FOG-1). As certain GATA-1 target genes have little to no FOG-1 requirement for expression, presumably additional coregulators can mediate GATA-1 function. Using a genetic complementation assay and RNA interference in GATA-1–null cells, we demonstrate a vital link between GATA-1 and the histone H4 lysine 20 methyltransferase PR-Set7/SetD8 (SetD8). GATA-1 selectively induced H4 monomethylated lysine 20 at repressed, but not activated, loci, and endogenous SetD8 mediated GATA-1–dependent repression of a cohort of its target genes. GATA-1 used different combinations of SetD8, FOG-1, and the FOG-1–interacting nucleosome remodeling and deacetylase complex component Mi2β to repress distinct target genes. Implicating SetD8 as a context-dependent GATA-1 corepressor expands the repertoire of coregulators mediating establishment/maintenance of the erythroid cell genetic network, and provides a biological framework for dissecting the cell type-specific functions of this important coregulator. We propose a coregulator matrix model in which distinct combinations of chromatin regulators are required at different GATA-1 target genes, and the unique attributes of the target loci mandate these combinations.
The precise regulation of complex transcriptional networks ensures the fidelity of critical developmental processes. A fundamental component of this regulation involves epigenetic mechanisms that impose stringent constraints to restrict cis-element occupancy by trans-acting factors and postchromatin occupancy mechanisms involving the recruitment of broadly expressed chromatin modifying and remodeling enzymes that chemically alter or reposition nucleosomes. Histone modifications, such as acetylation and methylation, confer transcriptional repression or activation in a context-dependent manner. Although numerous enzymes modify and remodel chromatin, and knowledge on their biochemical mechanisms has advanced tremendously, many questions remain regarding how they establish and maintain genetic networks that control essential processes, including stem cell self-renewal, lineage commitment, and cellular differentiation.
Given the crucial red blood cell functions and common therapeutic scenarios demanding modulation of erythropoiesis (1), it is instructive to consider how epigenetic mechanisms control hematopoietic stem cell (HSC) differentiation into multipotent progenitors, lineage-committed progenitors, and ultimately erythrocytes. The transcription factor GATA-2 (2, 3) is required for the genesis and maintenance of HSCs (4), whereas GATA-1 (5, 6) is crucial for erythrocyte, megakaryocyte, mast cell, and eosinophil development (7, 8). During erythropoiesis, GATA-1 replaces GATA-2 at Gata2 chromatin sites, thus conferring repression (9–11). GATA switches occur at numerous loci and are frequently associated with altered transcriptional output. The GATA-1–interacting coregulator Friend of GATA-1 (FOG-1) mediates GATA-1–dependent activation and repression in a context-dependent manner (12, 13). FOG-1 facilitates GATA-1 chromatin occupancy (14, 15) and interacts with the nucleosome remodeling and deacetylase (NuRD) chromatin remodeling complex (16) containing the ATPase CHD4 (Mi2β), which is required for development of erythroid and other hematopoietic lineages (17, 18). GATA-1 also recruits the chromatin remodeler BRG1 (19, 20), the histone acetyltransferase CBP/p300 (21), and the mediator complex component Med1 (22, 23). BRG1 promotes expression of adult α- and β-like globin genes in erythroid cells (19, 24), CBP/p300 mediates GATA-1 function in at least certain contexts (21), and Med1 amplifies GATA-1 activity at select target genes (22). Given the crucial developmental functions of GATA factors, it is reasonable to assume that the requisite coregulator machinery is complex and involves considerable functional redundancy to ensure developmental fidelity. Because GATA-1 target genes differ in their requirements for FOG-1 (11, 12) and GATA-1 K137 sumoylation, a modification that enhances GATA-1 activity at loci requiring FOG-1 (25), the ensemble of coregulators mediating GATA factor function appears to be locus-specific.
Unraveling mechanisms underlying locus-specific GATA factor actions will provide key insights into how GATA factors function uniquely in distinct cell types and developmental stages. To address this problem, we conducted in silico data mining of the BioGPS database (http://biogps.gnf.org) (26) to identify chromatin regulators enriched in erythroid cells, which may imply an important erythroid function and identify novel GATA-1 coregulators. This analysis revealed SetD8, the sole methyltransferase that catalyzes H4K20 monomethylation (H4K20me1) (27). Although the SetD8 catalytic mechanism has been elucidated (28), many questions remain regarding its cell type-specific functions. SetD8 and H4K20me1 are dynamically regulated throughout the cell cycle, and SetD8 degradation promotes cell cycle progression (29). Targeted deletion of SetD8 blocks embryogenesis at the four- and eight-cell stages and impairs chromatin compaction (30). H4K20me1 has been correlated with transcriptional activation and repression (27). H4K20me1 localizes predominantly to nontranscribed chromatin regions on Drosophila polytene chromosomes (31) and to E2F-repressed genes in HeLa cells (32). Functional studies in Drosophila provide evidence for SetD8-dependent repression mechanisms (33). In contrast, analyses in HeLa cells and T lymphocytes revealed that H4K20me1 resides at actively transcribed chromatin (34, 35). We demonstrate that SetD8 is a context-dependent GATA-1 corepressor and provide evidence for locus-specific mechanisms that integrate ensembles of chromatin regulators, which we term a coregulator matrix model of GATA factor function.
Results
SetD8-Dependent Target Gene Ensemble in Erythroid Cells.
Given the crucial SetD8 activity for early development, and the common H4K20me1 mark in diverse systems, presumably SetD8 controls a broad spectrum of biological processes. As cell type-specific SetD8 mechanisms and SetD8 function/regulation in the hematopoietic system are largely unexplored, we conducted siRNA-based loss-of-function and genetic complementation analysis to evaluate its function in a physiologically relevant model of erythroid cell maturation, G1E-ER-GATA-1 cells (36) (Fig. 1A). G1E-ER-GATA-1 cells were derived from GATA-1–nullizygous ES cells, resemble normal proerythroblasts, and stably express a conditionally active allele of GATA-1 (ER-GATA-1) (37). β-Estradiol–mediated activation of ER-GATA-1 induces a GATA-1–dependent genetic network and morphological changes, recapitulating a normal window of adult erythroid maturation (38).
Fig. 1.

Highly selective SetD8 functions in erythroid cells. (A) G1E-ER-GATA-1 cells were transfected with nontargeting or SetD8-specific siRNA at t = 0 h. At t = 24 h, cells were transfected with the identical siRNA again, and were treated with β-estradiol for 24 or 48 h. At t = 48 h, RNA and protein was isolated, and flow cytometry was conducted at 72 h. Control cells were not treated with β-estradiol. (B) SetD8 mRNA levels were quantitated by RT-PCR (n = 7, mean ± SE). **P < 0.001. (C) SetD8 protein levels were measured by semiquantitative Western blotting. (D) G1E-ER-GATA-1 cell maturation was quantitated by flow cytometry. (Left) Representative contour plot of G1E-ER-GATA-1 cell maturation 48 h after β-estradiol treatment. (Right) Averages of the percent Ter119-high population, live cells, and early apoptotic cells (n = 2, mean ± SD). (E) GATA-1-activated and -repressed target genes, globin genes, and genes implicated in regulating hemoglobin switching (Bcl11a and Klf1) mRNA levels were quantitated by RT-PCR (n = 7, mean ± SE).
siRNA-mediated knockdown of SetD8 mRNA (75% reduction) (Fig. 1B) and protein (Fig. 1C) in β-estradiol–treated and untreated cells did not induce gross changes in cell morphology and viability. To test whether SetD8 contributes to G1E-ER-GATA-1 cell maturation, we quantitated expression of erythroid cell-surface markers (CD71 and Ter119) that delineate the maturation status (39). As expected, β-estradiol treatment for 48 h greatly increased Ter119 staining. The SetD8 knockdown did not significantly influence Ter119 induction (Fig. 1D). Flow cytometric analysis of cell viability and apoptosis revealed no difference between control- and SetD8 siRNA-transfected cells (Fig. 1D). Thus, G1E-ER-GATA-1 maturation, which recapitulates a component of the process that yields erythrocytes, is insensitive to lowering SetD8 levels.
GATA-1 activates and represses target gene transcription, thereby establishing a complex genetic network that orchestrates erythropoiesis and erythroid cell function (11, 40–42). To determine if SetD8 contributes to the establishment and maintenance of this genetic network, we asked whether the SetD8 knockdown altered the capacity of GATA-1 to regulate target genes in the genetic complementation assay. The knockdown did not influence GATA-1–mediated activation of prototypical target genes Alas2, Epb4.9, and Ahsp, although it modestly suppressed Slc4a1 activation (Fig. 1E). We also tested whether the knockdown influenced expression of Hbb-y and Hbb-bh1, which encode embryonic/fetal β-like globin proteins and are expressed at low levels in the adult or definitive G1E-ER-GATA-1 cells. The SetD8 knockdown activated Hbb-bh1 and Hbb-y expression 14- and 3.8-fold, respectively (Fig. 1E). This SetD8 repressive function was selective for Hbb-bh1 and Hbb-y, as the SetD8 knockdown did not affect ER-GATA-1–mediated activation of adult Hbb-b1 and Hba-a1 expression (Fig. 1E). SetD8 knockdown did not alter expression of the established repressor of embryonic/fetal β-like globin genes Bcl11a, or Klf1, which can induce BCL11A expression (43) (Fig. 1E). The SetD8 knockdown did not affect basal expression or GATA-1–mediated repression of the prototypical GATA-1–repressed genes, Gata2, Lyl1, and c-Kit, although Rgs18 basal activity was up-regulated and GATA-1–mediated Rgs18 repression was reduced (Fig. 1E). siRNA-mediated knockdown of SetD8 mRNA by 80% in murine erythroleukemia cells did not alter Gata1 expression (Fig. S1).
Because the gene-expression analysis suggested that SetD8 represses a restricted cohort of GATA-1–regulated genes, we conducted transcriptional profiling to rigorously establish the SetD8-sensitive target gene ensemble. We compared the transcriptional profiles of β-estradiol–induced G1E-ER-GATA-1 cells, each transfected with control or SetD8 siRNA. This analysis revealed only 97 significantly up-regulated genes upon SetD8 knockdown (Fig. 2A). Hbb-bh1 was among the top 10 highest up-regulated genes (Fig. 2A). Only 11 genes were significantly down-regulated, with SetD8 expression declining to the greatest extent (Fig. 2B). Real-time RT-PCR analysis with up-regulated genes (Kank3, Ak1, Scamp5, Tnfrsf18, Rec8, and Dxcr) validated the microarray results (Fig. 2C). Gene Ontology (GO) analysis revealed that these SetD8-regulated genes were associated with a wide spectrum of biological processes (Fig. 2D). The majority of SetD8-regulated genes differed from erythroid genes that endow cells with the characteristic erythroid phenotype. In principle, the biologically and mechanistically disparate SetD8-regulated genes might share a common chromosomal environment, such as chromosomal location. However, evaluation of the chromosomal distribution of the top 20 SetD8-repressed genes residing on different chromosomes revealed no enrichments at gross chromosomal features (e.g., telomeres or centromeres) (Fig. 2E).
Fig. 2.

SetD8-dependent target gene ensemble. Microarray analysis was performed using RNA from three independent SetD8 knockdown experiments. We compared RNA from β-estradiol–treated (24 h) cells receiving nontargeting or SetD8 siRNA. (A) Genes significantly up-regulated more than twofold upon SetD8 knockdown. (B) Genes significantly down-regulated more than twofold upon SetD8 knockdown. (C) Validation of array results by RT-PCR (n = 3, mean ± SE). *P < 0.05. (D) GO analysis of genes up-regulated by the SetD8 knockdown. (E) Murine chromosomal distribution of the top 20 up-regulated genes from the microarray analysis (chromosome profiles adapted from the Integrated Genome Browser). Chromosomes are oriented with the centromere on the left.
SetD8 as a Context-Dependent GATA-1 Corepressor.
Comparison of GATA-1– and SetD8-regulated gene cohorts by real-time RT-PCR revealed two modes by which SetD8 mediates GATA-1 function. First, SetD8 was required for GATA-1 to repress Kank3 expression (Fig. 2C) and knocking-down SetD8 abrogated the repression. Second, SetD8 repressed expression of certain GATA-1–activated genes. GATA-1 activated Scamp5 (Fig. 2C), and knocking-down SetD8 yielded Scamp5 hyperactivation. A distinct gene cohort, exemplified by Ak1, was SetD8-, but not GATA-1–, regulated (Fig. 2C).
To more rigorously establish interrelationships between GATA-1– and SetD8-regulated genes, we generated a new GATA-1–regulated gene dataset, because prior GATA-1 datasets were obtained with a different microarray platform and different cultures of G1E-ER-GATA-1 cells (38, 40). We conducted transcriptional profiling in nonspecific siRNA-transfected, uninduced, and β-estradiol-induced G1E-ER-GATA-1 cells to control for potential influences of nucleofection on ER-GATA-1 activity. Because GATA-1–regulated and SetD8-activated genes did not overlap, we focused only on SetD8-repressed genes. A total of 47 genes were coregulated by SetD8 and GATA-1 (2% of all GATA-1 targets). The SetD8-repressed genes segregated based on ER-GATA-1–responsiveness: GATA-1–activated, GATA-1–repressed, and GATA-1–insensitive (Fig. 3 A and B). Although the majority (52%) of SetD8-regulated genes were GATA-1–insensitive, 32% were GATA-1–repressed (Fig. 3 A and B), and 16% were GATA-1-activated (Fig. 3 A and B). GO analysis of the SetD8/GATA-1–corepressed cohort revealed some of these genes function in “B-cell proliferation,” including Cd81 and Tnfrsf13b. (Fig. 3 A and B). Two SetD8-repressed/GATA-1–activated genes were involved in “protein amino acid ADP-ribosylation (Fig. 3 A and B). SetD8-regulated, GATA-1–insensitive genes were linked to diverse cellular processes, including response to wounding, stress, and apoptosis, (Fig. 3 A and B). Thus, expression profiling demonstrated that SetD8 is a GATA-1 corepressor at a restricted cohort of GATA-1 target genes, and its quantitative contribution to GATA-1 function can be considerable. Because our analysis revealed genes that have not been studied in erythroid cells, we mined expression data obtained from murine primary adult erythroblasts of differing maturation stage (44), focusing on SetD8/GATA-1–corepressed genes that will be the focus of subsequent mechanistic analyses. The expression of Vim, Clec10a, Rgs19, and Limd2 resembled Gata2 and c-Kit, direct GATA-1 target genes whose expression declines upon transition from proerythroblasts to reticulocytes (Fig. 3C). SetD8 was highly expressed at all maturation stages.
Fig. 3.

SetD8 as a context-dependent GATA-1 corepressor. The set of genes up-regulated by SetD8 knockdown was subjected to sorting into one of three categories based on their response to GATA-1 activation: GATA-1–activated, GATA-1–repressed, or GATA-1–insensitive. GATA-1–sensitivity values are based on microarray analysis comparing cells receiving control siRNA, and either no treatment or β-estradiol (n = 3 individual experiments). (A) Pie chart displays the percentage of SetD8 regulated genes that fall into each of the three categories. GO analysis was conducted with all gene categories (David Bioinformatics, sorted by P value). (B) Genes falling into each category are listed. (C) mRNA levels of GATA-1–repressed genes mined from the murine ErythronDB database (www.cbil.upenn.edu/ErythronDB/). The direct target genes Gata2 and c-Kit are shown as controls, and Vim, Clec10a, and Rgs19 represent SetD8/GATA-1–corepressed genes.
Although GATA-1–mediated repression can involve FOG-1 (12), GATA switches (10), and reduced occupancy of the hematopoietic transcription factor Scl/TAL1 (11), many questions remain unanswered regarding the underlying mechanisms. In addition, we are unaware of reports in which SetD8 functions as a corepressor for any cell type-specific activator. To ask whether GATA-1 directly controls the SetD8-regulated gene cohort, we tested whether endogenous GATA-1 occupies the respective loci. Analysis of an endogenous GATA-1 ChIP-seq dataset from mouse erythroleukemia cells generated with our anti–GATA-1 antibody revealed GATA-1 occupancy at, or in the vicinity of, the SetD8/GATA-1–corepressed genes (Fig. 4A). GATA-1 occupied Myo1g and Rgs19 intronic sites, Limd2, Vim, and Kank3 distal sites, and Vim, Kank3, and Clec10a promoter sites (Fig. 4A). Analysis of histone modifications that demarcate enhancers (H3 acetylation at K27 and H3 monomethylation at K4) and promoters (H3 trimethylation at K4) from a mouse erythroleukemia cell ChIP-seq dataset revealed patterns largely predictable from the genomic location of GATA-1 occupancy (Fig. 4A). Of the 31 SetD8/GATA-1-corepressed genes, GATA-1 peaks were detected at or in the vicinity of 24 genes (77%) (Fig. S2). Of these 24 genes, GATA-1 occupied the promoter or gene body of 14 genes (promoter occupancy, 9 genes; gene body, 11 genes).
Fig. 4.

Evidence that GATA-1 directly regulates SetD8 target genes. (A) Endogenous GATA-1 ChIP-seq profiles from mouse erythroleukemia cells at SetD8/GATA-1–corepressed loci. GATA-1 ChIP-seq profiles are aligned with H3K4me1, H3K27ac, and H3K4me3 profiles, all from mouse erythroleukemia cells. (B) Kinetics of repression of SetD8/GATA-1-coregulated genes. Primary transcript levels were measured at 0, 1, 2, 4, 8, 12, 24, and 48 h after β-estradiol treatment (n = 6 ± SE). The dashed vertical line in each panel in B represents the first time point at which repression was statistically significant compared with t = 0.
To further assess whether the SetD8/GATA-1–corepressed genes occupied by endogenous GATA-1 are direct GATA-1 targets, we analyzed the kinetics of GATA-1–mediated repression of these genes. β-Estradiol treatment of G1E-ER-GATA-1 cells rapidly reduced primary transcript levels for the previously established direct GATA-1 targets Gata2 (9) and Lyl1 (45) by 70% after 12 h (Fig. 4B). Myo1g, Vim, and Clec10a primary transcript levels were reduced rapidly by 1–2 h, and to a similar extent 12-h postestradiol treatment, consistent with these genes being direct GATA-1 targets (Fig. 4B). Kank3 and Rgs19 repression was slightly slower (Fig. 4B). However, significant repression was apparent at these loci by 1 and 2 h for Kank3 and Rgs19, respectively.
Considering the SetD8 catalytic mechanism, presumably SetD8 mediates repression of the GATA-1 targets by catalyzing H4K20me1. We tested whether GATA-1 induces H4K20me1 at SetD8/GATA-1-corepressed genes. To address this theory, we conducted quantitative ChIP analysis with untreated or β-estradiol–treated G1E-ER-GATA-1 cells using an anti-H4K20me1 antibody. At the SetD8-sensitive, GATA-1–repressed genes Vim, Clec10a, Kank3, and Rgs19, β-estradiol induced promoter-associated H4K20me1 (Fig. 5A). At GATA-1–activated promoters, H4K20me1 levels were reduced or unaffected by ER-GATA-1 activation. ER-GATA-1 significantly reduced H4K20me1 at the Alas2 promoter by 3.4-fold. H4K20me1 declined at the Slc4a1 promoter, but not significantly (P = 0.058). Low-level H4K20me1 resided at the Hbb-b1 and Hba-a1 promoters, which was unaffected by β-estradiol treatment. ER-GATA-1 did not regulate H4K20me1 at the constitutively repressed Necdin promoter, which is insensitive to β-estradiol and SetD8 knockdown.
Fig. 5.

Selective GATA-1-mediated H4K20me1 induction at SetD8-repressed loci. (A) Quantitative ChIP analysis of promoter-associated H4K20me1 levels at GATA-1 target genes (n = 3, ± SE). *P < 0.05. (B and C) Quantitative ChIP analysis of ER-GATA-1, SetD8, and H4K20me1 as a function of distance from the (B) Vim TSS and (C) Clec10a TSS (n = 4, ± SE) An astersisk indicates a significant difference (P < 0.05) between the untreated and β-estradiol–treated value for each amplified site. The TSS is depicted as a vertical dashed line. Rabbit preimmune serum (for GATA-1 and H4K20me1) and purified mouse IgG (for SetD8) are graphed as a horizontal dashed line, which represents the average value from all sites at each respective locus. Vim and Clec10a loci are depicted at the top of B and C, respectively, with marks indicating the position of each amplicon.
To assess the mechanism by which ER-GATA-1 activation induces H4K20me1 at SetD8/GATA-1–regulated genes, we determined the relationship between GATA-1, SetD8, and H4K20me1 occupancy. Quantitative ChIP analysis was conducted in β-estradiol–treated and untreated G1E-ER-GATA-1 cells using anti–GATA-1, anti-H4K20me1, and anti-SetD8 antibodies. At the Vim locus, β-estradiol-induced GATA-1 occupancy at sites −0.6 kb and +1.2 kb from the Vim transcription start site (TSS) (Fig. 5B). SetD8 occupancy was also detected at the Vim locus, and was maximal at the +1.2-kb GATA-1 binding site (Fig. 5B). This finding indicates that SetD8 and GATA-1 can be cross-linked to overlapping chromatin regions. Although β-estradiol treatment did not affect SetD8 occupancy, H4K20me1 levels increased across a ∼7-kb region around the TSS (Fig. 5B). GATA-1 occupied a site −0.4 kb from the Clec10a TSS (Fig. 5C), and similar to Vim, SetD8 and GATA-1 occupancy overlapped (Fig. 5C). Also similar to Vim, β-estradiol treatment yielded a broad zone of H4K20me1 enrichment, whereas SetD8 occupancy was unaffected (Fig. 5C). These data indicate that SetD8 precedes GATA-1 occupancy at these target genes, and are consistent with a model in which GATA-1 occupancy stimulates SetD8 activity to induce H4K20me1 at the respective loci in a manner that is not restricted to the GATA-1 occupancy site.
Locus-Specific Integration of Chromatin Regulators: Evidence for a Coregulator Matrix Model of GATA Factor Function.
The activation or repression of GATA-1 target genes can be FOG-1–sensitive or –insensitive (11, 12). Thus, GATA-1–mediated repression of SetD8 target genes might be FOG-1–sensitive, FOG-1–insensitive, or both at distinct loci. We knocked-down FOG-1 in G1E-ER-GATA1 cells to assess FOG-1–sensitivity of SetD8/GATA-1–corepressed genes (Fig. 6A). Whereas ER-GATA-1–mediated repression of Clec10a, Myo1g, and Lyl1 was mildly sensitive to the knockdown, Kank3, Rgs19, Gata2, and c-Kit repression was abrogated (Fig. 6A). As an alternative approach, we evaluated FOG-1 sensitivity by stably expressing ER-GATA-1 or a mutant (ER-GATA-1-V205G) defective in FOG-1 binding (12) in G1E cells. Four clones of ER-GATA-1(V205G) –expressing cells were compared with an ER-GATA-1–expressing clone. Because clonal lines typically express ER-GATA-1(V205G) at levels lower than our conventional G1E-ER-GATA-1 line (46), we used a clonal line expressing lower levels of ER-GATA-1 to ensure that ER-GATA-1 did not exceed expression levels of the mutants. Semiquantitative Western blotting demonstrated that ER-GATA-1(V205G) protein was expressed at least as high as ER-GATA-1 (Fig. 6B). Because of the low-level ER-GATA-1 expression, however, the magnitude of ER-GATA-1 responses at certain loci is less than with our typical G1E-ER-GATA-1 line. Whereas ER-GATA-1 repressed Gata2, Kank3, and Rgs19, repression was lower in all of the ER-GATA-1(V205G) clones (Fig. 6B). In contrast, ER-GATA-1(V205G) repressed Lyl1, Rgs18, Myo1g, Clec10a, and Vim to an equal or greater extent than ER-GATA-1, indicating that disrupting the ER-GATA-1-FOG-1 interaction did not affect repression of these genes (Fig. 6B). In aggregate, these results demonstrate that SetD8/GATA-1–corepressed genes are not dedicated to a single transcriptional mode involving FOG-1, but rather are FOG-1–sensitive or –insensitive.
Fig. 6.
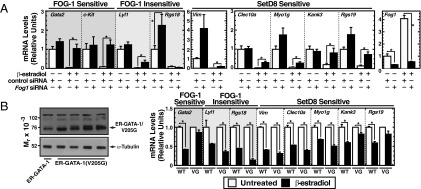
SetD8/GATA-1-corepressed genes differentially require FOG-1. (A) FOG-1 knockdown in G1E-ER-GATA-1 cells. Real-time RT-PCR quantitation of mRNA levels of FOG-1–sensitive and –insensitive genes, as well as SetD8/GATA-1–corepressed genes (n = 5 ± SE). (B) Gene expression analysis of GATA-1 target genes in G1E-ER-GATA-1 or G1E-ER-GATA-1(V205G) mutant cells matched for ER-GATA-1 expression. White bars, untreated; black bars, β-estradiol–treated. One ER-GATA-1 and four ER-GATA-1(V205G) clonal lines. Each untreated sample was normalized to a value of 1. For G1E-ER-GATA-1 samples, error bars represent SD from two technical replicates. For G1E-ER-GATA-1(V205G) samples, error bars represent SE from four biological replicates. *P < 0.05.
The NuRD complex associates with FOG-1 (16) and is an important determinant of GATA-1–mediated regulation of transcription and hematopoiesis (17, 18). We predicted that FOG-1–regulated, SetD8/GATA-1–corepressed genes would also require Mi2β, a key ATPase subunit of the NuRD complex (47, 48). siRNA-mediated knockdown of Mi2β mRNA nearly ablated Mi2β protein (Fig. 7A, Left) and abolished GATA-1–mediated repression of the FOG-1–insensitive SetD8/GATA-1–corepressed gene Clec10a (Fig. 7A, Right). Repression of the FOG-1–sensitive genes Gata2, c-Kit, and Rgs19 was significantly, but modestly, reduced (Fig. 7A, Right). The FOG-1–sensitive gene Kank3 was Mi2β-insensitive (Fig. 7A, Right). These results indicate that SetD8/GATA-1–corepressed genes are Mi2β-sensitive or -insensitive.
Fig. 7.
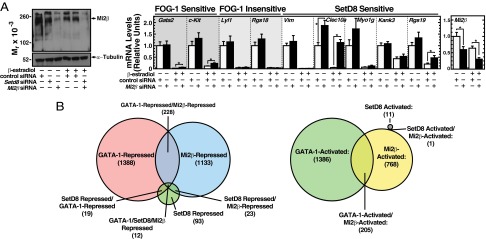
SetD8/GATA-1-corepressed genes differentially require the NuRD component, Mi2β. (A) Mi2β knockdown in G1E-ER-GATA-1 cells. (Left) Western blot to detect Mi2β protein levels. (Right) Real-time RT-PCR quantitation of mRNA of GATA-1 target genes that are FOG-1–sensitive, FOG-1–insensitive, and SetD8-sensitive (n = 5 ± SE) *P < 0.05. (B, Left) Venn diagram depicting the extent of overlap between GATA-1–repressed, Mi2β-repressed, and SetD8-repressed genes. (Right) Venn diagram depicting overlap of GATA-1-activated, Mi2β-activated, and SetD8-activated genes.
To determine the extent to which GATA-1 requires combinations of SetD8 and Mi2β to mediate transcriptional repression, we conducted transcriptional profiling of β-estradiol–induced G1E-ER-GATA-1 cells treated with Mi2β siRNA or nontargeting control siRNA. Knocking down Mi2β up-regulated 1,133 genes and down-regulated 768 genes. Seventeen percent of GATA-1–repressed genes (240) were also repressed by Mi2β (Fig. 7B). Fifteen percent of GATA-1–activated genes (205) were also activated by Mi2β. Additionally, 37% of SetD8-repressed genes (35) were also repressed by Mi2β, including Hbb-bh1 and Clec10a (Fig. 7B). Only 12 genes were repressed by GATA-1, Mi2β, and SetD8. No SetD8-activated genes were also activated by GATA-1, and only one gene was activated by SetD8 and Mi2β (Fig. 7B). These data suggest that although Mi2β can positively and negatively coregulate genes with GATA-1, SetD8 is exclusively involved in GATA-1–mediated repression. The differential coregulator requirements for GATA-1–mediated repression constitute a matrix (Fig. 8A), supporting a model in which GATA factor function requires different coregulator combinations at distinct endogenous loci (Fig. 8B).
Fig. 8.

(A) Matrix depicting GATA-1 coregulator requirement at distinct loci. (B) Models depicting GATA-1 utilization of different combinations of corepressors at distinct loci. Although the model depicts factors implicated to function nonredundantly at the specific target genes, it does not imply whether additional factors are present or absent at the respective regulatory elements.
Discussion
We describe evidence that the H4K20me1 methyltransferase SetD8 is a context-dependent GATA-1 corepressor. A prior analysis had implicated SetD8 as a coactivator for the Wnt pathway factor LEF1/TCF4 (49). SetD8 overexpression and knockdown in 3T3 cells increased and decreased Axin2 expression, respectively (49). SetD8 knockdown in HEK293 cells reduced expression of several Wnt target genes, and SetD8 regulated Wnt target genes in zebrafish (49). However, it was unknown whether SetD8 mediates transcriptional control by a large or highly restricted cohort of trans-acting factors, whether other developmental regulators use SetD8 to instigate cell type-specific transcriptional programs, and whether SetD8 commonly functions as a coactivator (34, 35, 49) or a corepressor (31, 33).
Our results demonstrate that endogenous SetD8 functions predominantly as a corepressor in G1E-ER-GATA-1 cells. Intriguingly, GATA-1 target genes differ in their requirements for SetD8 and other coregulators. Reducing the level of endogenous SetD8 up-regulated mouse fetal and embryonic globin genes. Factors that selectively repress the embryonic/fetal β-like globin genes are of great interest, as increasing embryonic/fetal β-like globin gene expression in human hemoglobinopathies involving mutated or reduced levels of adult β-globin is efficacious (43); existing clinical strategies are relatively nonspecific. Genome-wide expression analysis revealed that SetD8 repressed a restricted cohort of genes in erythroid cells, some of which are GATA-1–regulated (e.g., murine embryonic/fetal β-like globin genes). SetD8 also repressed genes that were not GATA-1–regulated, including genes implicated in B-cell biology. The majority of SetD8-repressed genes in erythroid cells were nonerythroid genes. GATA-1 occupied SetD8/GATA-1–corepressed genes, and kinetic studies imply direct GATA-1 regulation. GATA-1 used SetD8 at genes that are FOG-1–sensitive or –insensitive and those that are Mi2β-sensitive or -insensitive.
Our loss-of-function studies with SetD8 and other coregulators provide evidence for a coregulator matrix model of GATA factor function. This model assumes that distinct combinations of coregulators confer target-gene regulation in a locus-specific manner. Conceptually, this model differs from the paradigm in which an activator or repressor function via a common mechanism in diverse contexts. It is attractive to propose that the local chromatin environment, higher-order chromatin structure, or subnuclear neighborhood mandate the locus-specific mechanistic requirements for transcriptional control. At a rudimentary level involving a single coregulator, FOG-1, FOG-1–sensitive GATA-1 target genes are expelled from the nuclear periphery upon activation, whereas FOG-1–insensitive GATA-1 target genes constitutively reside at the periphery (25, 50). Our coregulator matrix constitutes a unique foundation that can be extended to yield a genome-wide perspective of the complex relationships between GATA-1 and requisite coregulators at target genes with unique attributes, including local chromatin environment, higher-order chromatin structure, and subnuclear neighborhood. This matrix will be an exceptionally powerful tool to dissect parameters dictating context-dependent GATA factor functions and will permit sophisticated modeling to evaluate how alterations in the regulatory parameters influence GATA factor-dependent genetic networks and downstream physiological and pathophysiological outputs.
Erythrocyte development requires cell-intrinsic and -extrinsic mechanisms that control commitment of multipotent hematopoietic precursors, massive gene-expression changes, and sequential maturation steps, including gross organelle remodeling, that prepare for enucleation (1, 44, 51). Analogous to GATA-1, FOG-1 is a master regulator of erythropoiesis with broad roles to establish the erythroid cell phenotype. We predict that select GATA-1 coregulators have more specialized functions to confer specific components of the GATA-1–dependent genetic network, such as components dedicated to controlling the induction of autophagy (52), which is required for organelle remodeling (53, 54), or enucleation (55, 56). The G1E-ER-GATA-1 system recapitulates a normal window of maturation (38), but ER-GATA-1 activation in this system does not drive efficient enucleation. Furthermore, regulatory events underlying the genesis of proerythroblasts cannot be studied in this system. Although SetD8 was not required for Ter119 induction in G1E-ER-GATA-1 cells grown under conventional conditions in a 2-d maturation assay, it repressed embryonic/fetal β-like globin genes and additional genes expected to have important roles in cellular physiology. Our results establish the molecular underpinnings of a pivotal biological mechanism in which Vim (encoding Vimentin) is down-regulated during erythropoiesis as a key step in maturation-associated cytoskeletal remodeling (57). The loss of Vimentin-containing intermediate filaments has been proposed to be a prerequisite for enucleation (58). Extending our studies to interrogate coregulator requirements for specific components of the GATA-1–dependent genetic network in more complex systems will almost certainly reveal additional SetD8/GATA-1–coregulated biological processes, and the work described herein provides foundational insights to guide such studies.
Beyond GATA-1 mechanisms, we expect that the coregulator matrix model can be extrapolated to the actions of trans-acting factors functioning at endogenous loci in diverse biological contexts. However, further studies on endogenous coregulator actions at endogenous loci are required. Comparative analyses of other factor-specific or tissue-specific matrices will almost certainly uncover broadly important principles.
Materials and Methods
Cell Culture.
G1E-ER-GATA-1 and G1E-ER-GATA-1(V205G) cells were cultured in Iscove’s modified Dulbecco’s medium (IMDM; Gibco) containing 15% (vol/vol) FBS (Gemini), 1% penicillin-streptomycin (Gemini), 2 U/mL erythropoietin, 120 nM monothioglycerol (Sigma), 0.6% conditioned medium from a Kit ligand-producing CHO cell line, and 1 μg/mL puromycin (Gemini). ER-GATA-1 activity was induced by treating cells with 1μM β-estradiol (Steraloids). FOG-1–null hematopoietic precursor cells were maintained in IMDM (Gibco) containing 15% FBS (Gemini), 1% antibiotic/antimycotic (Gemini), and 10 ng/mL IL-3 (R&D Systems). Mouse erythroleukemia cells were cultured in DMEM (Gibco) supplemented with 5% (vol/vol) FBS (Gemini).
RNA Interference.
Dharmacon siGenome SmartPool siRNAs targeting mouse SetD8, Fog1, and Mi2β were electroporated into 3 × 10⁶ G1E-ER-GATA-1 cells using an Amaxa Nucleofector (Lonza) coupled with Nucleofection Kit R (Lonza), as described previously (22, 50). Nontargeting siRNA (Dharmacon) served as a control. siRNA transfections were conducted twice (at 0 h and at 24 h). For mRNA and protein analysis, transfected cells were treated with β-estradiol at 24 h and harvested at 48 h. For flow cytometric analysis, cells were treated with β-estradiol at 24 h and harvested at 72 h.
Real-Time RT-PCR.
Total RNA was purified with TRIzol (Invitrogen). To prepare cDNA, 1 μg RNA was annealed with 250 ng of a 5:1 mixture of random hexamer and oligo(dT) primers by heating to 68 °C for 10 min. The annealed RNA/primers were incubated with murine Moloney leukemia virus reverse-transcriptase (Invitrogen), 10 mM DTT (Invitrogen), RNAsin (Promega), and 0.5 mM deoxynucleoside triphosphates (dNTPs) at 42 °C for 1 h in a total reaction volume of 20 μL. This mixture was heat-inactivated at 95 °C for 5 min, and then diluted to a final volume of 100 μL. RT-PCR reactions contained 1.5 μL cDNA, 10 μL Power SYBR Green Master Mix (Applied Biosystems), appropriate primers, and water to a total volume of 20 μL. PCR product accumulation was monitored by SYBR green fluorescence. Relative expression was determined from a standard curve of serial dilutions of cDNA sample. As an internal control, all RNA measurements were normalized to 18S RNA levels.
Transcriptional Profiling.
RNA samples from three independent SetD8-knockdown and Mi2β-knockdown experiments in G1E-ER-GATA-1 cells were used for microarray analysis. mRNA was isolated and used to synthesize Amino Allyl RNA (aRNA). aRNA was labeled and hybridized to 8 × 60k Mouse Whole Genome arrays (Agilent), and read using a G-2505C DNA Microarray Scanner with Surescan High Resolution (Agilent). Data were analyzed using EDGE3, a Web-based two-color mircroarray analysis software, coupled with Microsoft Excel. Heat maps were generated using Java TreeView software.
Quantitative ChIP.
ChIP analysis in G1E-ER-GATA-1 cells was conducted as described previously (59). Briefly, samples containing 5 × 10⁶ cells were crosslinked in 1% formaldehyde for 10 min. H4K20me1 was immunoprecipitated using rabbit polyclonal anti-H4K20me1 antibody (Millipore). SetD8 was immunoprecipitated using a mouse monoclonal antibody (Abcam ab3798) and GATA-1 was immunoprecipitated using a rabbit polyclonal antibody developed by the Bresnick Lab. Rabbit preimmune serum (Covance) was used as a control. Samples were quantitated using RT-PCR (Applied Biosystems Viia 7). Quantity of DNA was determined by SYBR green fluorescence, and the amount of product was determined relative to a standard curve created from serial dilution of input chromatin.
Protein Analysis.
Protein samples were isolated by centrifugation of 1 × 10⁶ cells from each condition, washing with cold PBS, and lysing in 1× SDS sample buffer (25 mM Tris, pH 6.8, 2% β-mercaptoethanol, 3% SDS, 0.005% bromophenol blue, 5% glycerol). Samples were boiled for 10 min and stored at −80 °C. Samples were resolved by SDS/PAGE, and proteins were detected by semiquantitative Western blotting with ECL Plus (GE Healthcare). Antibodies used were anti-SetD8 (Millipore 07–316), anti–GATA-1 (Santa Cruz Biotechnology; sc-265), anti–α-tubulin (Millipore; clone DM1A, 05–829). Secondary antibodies included goat anti-mouse-IgG-HRP, goat anti-rabbit-IgG-HRP, or goat anti-rat-IgG-HRP (Santa Cruz Biotechnology; sc-2005, sc-2030, sc-2032).
Flow Cytometry.
For flow cytometry, 1 × 10⁵ cells were isolated by centrifugation (6 min, 168 × g), washed with ice-cold PBS, and resuspended in 100 μL Annexin V Binding Buffer (Invitrogen). Cells were incubated with 5 μL Alexa Fluor 350-conjugated Annexin V (Invitrogen A23202) at room temperature for 15 min in the dark. Ice-cold Annexin V binding buffer was added (400 μL), followed by 30 μL of 150 μg/mL propidium iodide solution in PBS. Samples were maintained on ice and were analyzed using a BD LSR II Flow Cytometer. Annexin V Alexa Fluor 350 was detected with the UV laser (detector at 355 nm, filter at 450/50 nm), and propidium iodide was detected with the green laser (detector at 561 nm, filter at 450/50 nm). Data were analyzed using FlowJo 9.5.2 software.
Statistical Analysis.
Statistical significance was determined by Paired Student’s t test using web-based GraphPad software (www.graphpad.com). Statistical analysis of genome-wide expression data were conducted using EDGE3 software (60). Statistical significance of GO terms was conducted with the Web-based National Institutes of Health DAVID tool (http://david.abcc.ncifcrf.gov/).
ChIP-Seq.
ChIP-seq profiles for GATA-1, H3K4me1, H3K27ac, and H3K4me1 in mouse erythroleukemia cells were generated using the University of California at Santa Cruz Genome Browser (http://genome.ucsc.edu/). Endogenous GATA-1 ChIP-seq data were generated by Sherman Weissman (Yale University, New Haven, CT) with an anti–GATA-1 antibody developed by the Bresnick laboratory (GEO accession GSM912907). Data for H3K4me1 (Abcam ab8895, GEO accession GSM1000073), H3K4me3 (Millipore 07–473 GEO accession GSM1000087), and H3K27ac (Abcam ab4729, GEO accession GSM1000142) were generated by Bing Ren (University of California, San Diego, La Jolla, CA).
Supplementary Material
Acknowledgments
We thank members of the E.H.B. group for critical comments. This study was funded in part by National Institutes of Health Grant DK50107, and National Institutes of Health Grant T32 GM081061 (to A.W.D.), and a University of Wisconsin Comprehensive Cancer Center Support Grant P30 CA014520.
Footnotes
The authors declare no conflict of interest.
This article is a PNAS Direct Submission.
Data deposition: The data reported in this paper have been deposited in the Gene Expression Omnibus (GEO) database, www.ncbi.nlm.nih.gov/geo (accession nos. GSE49174 and GSE48188).
This article contains supporting information online at www.pnas.org/lookup/suppl/doi:10.1073/pnas.1302771110/-/DCSupplemental.
References
- 1.Hattangadi SM, Wong P, Zhang L, Flygare J, Lodish HF. From stem cell to red cell: Regulation of erythropoiesis at multiple levels by multiple proteins, RNAs, and chromatin modifications. Blood. 2011;118(24):6258–6268. doi: 10.1182/blood-2011-07-356006. [DOI] [PMC free article] [PubMed] [Google Scholar]
- 2.Zon LI, et al. Expression of GATA-binding proteins during embryonic development in Xenopus laevis. Proc Natl Acad Sci USA. 1991;88(23):10642–10646. doi: 10.1073/pnas.88.23.10642. [DOI] [PMC free article] [PubMed] [Google Scholar]
- 3.Yamamoto M, et al. Activity and tissue-specific expression of the transcription factor NF-E1 multigene family. Genes Dev. 1990;4(10):1650–1662. doi: 10.1101/gad.4.10.1650. [DOI] [PubMed] [Google Scholar]
- 4.Tsai FY, et al. An early haematopoietic defect in mice lacking the transcription factor GATA-2. Nature. 1994;371(6494):221–226. doi: 10.1038/371221a0. [DOI] [PubMed] [Google Scholar]
- 5.Evans T, Felsenfeld G. The erythroid-specific transcription factor Eryf1: A new finger protein. Cell. 1989;58(5):877–885. doi: 10.1016/0092-8674(89)90940-9. [DOI] [PubMed] [Google Scholar]
- 6.Tsai SF, et al. Cloning of cDNA for the major DNA-binding protein of the erythroid lineage through expression in mammalian cells. Nature. 1989;339(6224):446–451. doi: 10.1038/339446a0. [DOI] [PubMed] [Google Scholar]
- 7.Pevny L, et al. Erythroid differentiation in chimaeric mice blocked by a targeted mutation in the gene for transcription factor GATA-1. Nature. 1991;349(6306):257–260. doi: 10.1038/349257a0. [DOI] [PubMed] [Google Scholar]
- 8.Fujiwara Y, Browne CP, Cunniff K, Goff SC, Orkin SH. Arrested development of embryonic red cell precursors in mouse embryos lacking transcription factor GATA-1. Proc Natl Acad Sci USA. 1996;93(22):12355–12358. doi: 10.1073/pnas.93.22.12355. [DOI] [PMC free article] [PubMed] [Google Scholar]
- 9.Grass JA, et al. GATA-1-dependent transcriptional repression of GATA-2 via disruption of positive autoregulation and domain-wide chromatin remodeling. Proc Natl Acad Sci USA. 2003;100(15):8811–8816. doi: 10.1073/pnas.1432147100. [DOI] [PMC free article] [PubMed] [Google Scholar]
- 10.Bresnick EH, Lee HY, Fujiwara T, Johnson KD, Keles S. GATA switches as developmental drivers. J Biol Chem. 2010;285(41):31087–31093. doi: 10.1074/jbc.R110.159079. [DOI] [PMC free article] [PubMed] [Google Scholar]
- 11.Bresnick EH, Katsumura KR, Lee HY, Johnson KD, Perkins AS. Master regulatory GATA transcription factors: Mechanistic principles and emerging links to hematologic malignancies. Nucleic Acids Res. 2012;40(13):5819–5831. doi: 10.1093/nar/gks281. [DOI] [PMC free article] [PubMed] [Google Scholar]
- 12.Crispino JD, Lodish MB, MacKay JP, Orkin SH. Use of altered specificity mutants to probe a specific protein-protein interaction in differentiation: the GATA-1:FOG complex. Mol Cell. 1999;3(2):219–228. doi: 10.1016/s1097-2765(00)80312-3. [DOI] [PubMed] [Google Scholar]
- 13.Tsang AP, et al. FOG, a multitype zinc finger protein, acts as a cofactor for transcription factor GATA-1 in erythroid and megakaryocytic differentiation. Cell. 1997;90(1):109–119. doi: 10.1016/s0092-8674(00)80318-9. [DOI] [PubMed] [Google Scholar]
- 14.Pal S, et al. Coregulator-dependent facilitation of chromatin occupancy by GATA-1. Proc Natl Acad Sci USA. 2004;101(4):980–985. doi: 10.1073/pnas.0307612100. [DOI] [PMC free article] [PubMed] [Google Scholar]
- 15.Letting DL, Chen YY, Rakowski C, Reedy S, Blobel GA. Context-dependent regulation of GATA-1 by friend of GATA-1. Proc Natl Acad Sci USA. 2004;101(2):476–481. doi: 10.1073/pnas.0306315101. [DOI] [PMC free article] [PubMed] [Google Scholar]
- 16.Hong W, et al. FOG-1 recruits the NuRD repressor complex to mediate transcriptional repression by GATA-1. EMBO J. 2005;24(13):2367–2378. doi: 10.1038/sj.emboj.7600703. [DOI] [PMC free article] [PubMed] [Google Scholar]
- 17.Gao Z, et al. FOG-1-mediated recruitment of NuRD is required for cell lineage re-enforcement during haematopoiesis. EMBO J. 2010;29(2):457–468. doi: 10.1038/emboj.2009.368. [DOI] [PMC free article] [PubMed] [Google Scholar]
- 18.Miccio A, et al. NuRD mediates activating and repressive functions of GATA-1 and FOG-1 during blood development. EMBO J. 2010;29(2):442–456. doi: 10.1038/emboj.2009.336. [DOI] [PMC free article] [PubMed] [Google Scholar]
- 19.Kim SI, Bultman SJ, Kiefer CM, Dean A, Bresnick EH. BRG1 requirement for long-range interaction of a locus control region with a downstream promoter. Proc Natl Acad Sci USA. 2009;106(7):2259–2264. doi: 10.1073/pnas.0806420106. [DOI] [PMC free article] [PubMed] [Google Scholar]
- 20.Kim SI, Bultman SJ, Jing H, Blobel GA, Bresnick EH. Dissecting molecular steps in chromatin domain activation during hematopoietic differentiation. Mol Cell Biol. 2007;27(12):4551–4565. doi: 10.1128/MCB.00235-07. [DOI] [PMC free article] [PubMed] [Google Scholar]
- 21.Blobel GA, Nakajima T, Eckner R, Montminy M, Orkin SH. CREB-binding protein cooperates with transcription factor GATA-1 and is required for erythroid differentiation. Proc Natl Acad Sci USA. 1998;95(5):2061–2066. doi: 10.1073/pnas.95.5.2061. [DOI] [PMC free article] [PubMed] [Google Scholar]
- 22.Pope NJ, Bresnick EH. Differential coregulator requirements for function of the hematopoietic transcription factor GATA-1 at endogenous loci. Nucleic Acids Res. 2010;38(7):2190–2200. doi: 10.1093/nar/gkp1159. [DOI] [PMC free article] [PubMed] [Google Scholar]
- 23.Stumpf M, et al. The mediator complex functions as a coactivator for GATA-1 in erythropoiesis via subunit Med1/TRAP220. Proc Natl Acad Sci USA. 2006;103(49):18504–18509. doi: 10.1073/pnas.0604494103. [DOI] [PMC free article] [PubMed] [Google Scholar]
- 24.Kim SI, Bresnick EH, Bultman SJ. BRG1 directly regulates nucleosome structure and chromatin looping of the alpha globin locus to activate transcription. Nucleic Acids Res. 2009;37(18):6019–6027. doi: 10.1093/nar/gkp677. [DOI] [PMC free article] [PubMed] [Google Scholar]
- 25.Lee HY, et al. Controlling hematopoiesis through sumoylation-dependent regulation of a GATA factor. Mol Cell. 2009;36(6):984–995. doi: 10.1016/j.molcel.2009.11.005. [DOI] [PMC free article] [PubMed] [Google Scholar]
- 26.Wu C, et al. BioGPS: An extensible and customizable portal for querying and organizing gene annotation resources. Genome Biol. 2009;10(11):R130. doi: 10.1186/gb-2009-10-11-r130. [DOI] [PMC free article] [PubMed] [Google Scholar]
- 27.Beck DB, Oda H, Shen SS, Reinberg D. PR-Set7 and H4K20me1: At the crossroads of genome integrity, cell cycle, chromosome condensation, and transcription. Genes Dev. 2012;26(4):325–337. doi: 10.1101/gad.177444.111. [DOI] [PMC free article] [PubMed] [Google Scholar]
- 28.Couture JF, Dirk LM, Brunzelle JS, Houtz RL, Trievel RC. Structural origins for the product specificity of SET domain protein methyltransferases. Proc Natl Acad Sci USA. 2008;105(52):20659–20664. doi: 10.1073/pnas.0806712105. [DOI] [PMC free article] [PubMed] [Google Scholar]
- 29.Oda H, et al. Regulation of the histone H4 monomethylase PR-Set7 by CRL4(Cdt2)-mediated PCNA-dependent degradation during DNA damage. Mol Cell. 2010;40(3):364–376. doi: 10.1016/j.molcel.2010.10.011. [DOI] [PMC free article] [PubMed] [Google Scholar]
- 30.Oda H, et al. Monomethylation of histone H4-lysine 20 is involved in chromosome structure and stability and is essential for mouse development. Mol Cell Biol. 2009;29(8):2278–2295. doi: 10.1128/MCB.01768-08. [DOI] [PMC free article] [PubMed] [Google Scholar]
- 31.Nishioka K, et al. PR-Set7 is a nucleosome-specific methyltransferase that modifies lysine 20 of histone H4 and is associated with silent chromatin. Mol Cell. 2002;9(6):1201–1213. doi: 10.1016/s1097-2765(02)00548-8. [DOI] [PubMed] [Google Scholar]
- 32.Abbas T, et al. CRL4(Cdt2) regulates cell proliferation and histone gene expression by targeting PR-Set7/Set8 for degradation. Mol Cell. 2010;40(1):9–21. doi: 10.1016/j.molcel.2010.09.014. [DOI] [PMC free article] [PubMed] [Google Scholar]
- 33.Karachentsev D, Sarma K, Reinberg D, Steward R. PR-Set7-dependent methylation of histone H4 Lys 20 functions in repression of gene expression and is essential for mitosis. Genes Dev. 2005;19(4):431–435. doi: 10.1101/gad.1263005. [DOI] [PMC free article] [PubMed] [Google Scholar]
- 34.Barski A, et al. High-resolution profiling of histone methylations in the human genome. Cell. 2007;129(4):823–837. doi: 10.1016/j.cell.2007.05.009. [DOI] [PubMed] [Google Scholar]
- 35.Cui K, et al. Chromatin signatures in multipotent human hematopoietic stem cells indicate the fate of bivalent genes during differentiation. Cell Stem Cell. 2009;4(1):80–93. doi: 10.1016/j.stem.2008.11.011. [DOI] [PMC free article] [PubMed] [Google Scholar]
- 36.Weiss MJ, Yu C, Orkin SH. Erythroid-cell-specific properties of transcription factor GATA-1 revealed by phenotypic rescue of a gene-targeted cell line. Mol Cell Biol. 1997;17(3):1642–1651. doi: 10.1128/mcb.17.3.1642. [DOI] [PMC free article] [PubMed] [Google Scholar]
- 37.Gregory T, et al. GATA-1 and erythropoietin cooperate to promote erythroid cell survival by regulating bcl-xL expression. Blood. 1999;94(1):87–96. [PubMed] [Google Scholar]
- 38.Welch JJ, et al. Global regulation of erythroid gene expression by transcription factor GATA-1. Blood. 2004;104(10):3136–3147. doi: 10.1182/blood-2004-04-1603. [DOI] [PubMed] [Google Scholar]
- 39.Zhang J, Socolovsky M, Gross AW, Lodish HF. Role of Ras signaling in erythroid differentiation of mouse fetal liver cells: Functional analysis by a flow cytometry-based novel culture system. Blood. 2003;102(12):3938–3946. doi: 10.1182/blood-2003-05-1479. [DOI] [PubMed] [Google Scholar]
- 40.Fujiwara T, et al. Discovering hematopoietic mechanisms through genome-wide analysis of GATA factor chromatin occupancy. Mol Cell. 2009;36(4):667–681. doi: 10.1016/j.molcel.2009.11.001. [DOI] [PMC free article] [PubMed] [Google Scholar]
- 41.Yu M, et al. Insights into GATA-1-mediated gene activation versus repression via genome-wide chromatin occupancy analysis. Mol Cell. 2009;36(4):682–695. doi: 10.1016/j.molcel.2009.11.002. [DOI] [PMC free article] [PubMed] [Google Scholar]
- 42.Cheng Y, et al. Erythroid GATA1 function revealed by genome-wide analysis of transcription factor occupancy, histone modifications, and mRNA expression. Genome Res. 2009;19(12):2172–2184. doi: 10.1101/gr.098921.109. [DOI] [PMC free article] [PubMed] [Google Scholar]
- 43.Sankaran VG, Orkin SH. The switch from fetal to adult hemoglobin. Cold Spring Harb Perspect Medicine. 2013;3(1):a011643. doi: 10.1101/cshperspect.a011643. [DOI] [PMC free article] [PubMed] [Google Scholar]
- 44.Kingsley PD, et al. Ontogeny of erythroid gene expression. Blood. 2013;121(6):e5–e13. doi: 10.1182/blood-2012-04-422394. [DOI] [PMC free article] [PubMed] [Google Scholar]
- 45.Johnson KD, et al. Friend of GATA-1-independent transcriptional repression: A novel mode of GATA-1 function. Blood. 2007;109(12):5230–5233. doi: 10.1182/blood-2007-02-072983. [DOI] [PMC free article] [PubMed] [Google Scholar]
- 46.Johnson KD, Kim SI, Bresnick EH. Differential sensitivities of transcription factor target genes underlie cell type-specific gene expression profiles. Proc Natl Acad Sci USA. 2006;103(43):15939–15944. doi: 10.1073/pnas.0604041103. [DOI] [PMC free article] [PubMed] [Google Scholar]
- 47.Zhang Y, LeRoy G, Seelig HP, Lane WS, Reinberg D. The dermatomyositis-specific autoantigen Mi2 is a component of a complex containing histone deacetylase and nucleosome remodeling activities. Cell. 1998;95(2):279–289. doi: 10.1016/s0092-8674(00)81758-4. [DOI] [PubMed] [Google Scholar]
- 48.Wade PA, et al. Mi-2 complex couples DNA methylation to chromatin remodelling and histone deacetylation. Nat Genet. 1999;23(1):62–66. doi: 10.1038/12664. [DOI] [PubMed] [Google Scholar]
- 49.Li Z, Nie F, Wang S, Li L. Histone H4 Lys 20 monomethylation by histone methylase SET8 mediates Wnt target gene activation. Proc Natl Acad Sci USA. 2011;108(8):3116–3123. doi: 10.1073/pnas.1009353108. [DOI] [PMC free article] [PubMed] [Google Scholar]
- 50.Lee HY, Johnson KD, Boyer ME, Bresnick EH. Relocalizing genetic loci into specific subnuclear neighborhoods. J Biol Chem. 2011;286(21):18834–18844. doi: 10.1074/jbc.M111.221481. [DOI] [PMC free article] [PubMed] [Google Scholar]
- 51.Merryweather-Clarke AT, et al. Global gene expression analysis of human erythroid progenitors. Blood. 2011;117(13):e96–e108. doi: 10.1182/blood-2010-07-290825. [DOI] [PubMed] [Google Scholar]
- 52.Kang YA, et al. Autophagy driven by a master regulator of hematopoiesis. Mol Cell Biol. 2012;32(1):226–239. doi: 10.1128/MCB.06166-11. [DOI] [PMC free article] [PubMed] [Google Scholar]
- 53.Kundu M, et al. Ulk1 plays a critical role in the autophagic clearance of mitochondria and ribosomes during reticulocyte maturation. Blood. 2008;112(4):1493–1502. doi: 10.1182/blood-2008-02-137398. [DOI] [PMC free article] [PubMed] [Google Scholar]
- 54.Zhang J, et al. Mitochondrial clearance is regulated by Atg7-dependent and -independent mechanisms during reticulocyte maturation. Blood. 2009;114(1):157–164. doi: 10.1182/blood-2008-04-151639. [DOI] [PMC free article] [PubMed] [Google Scholar]
- 55.Ji P, Murata-Hori M, Lodish HF. Formation of mammalian erythrocytes: Chromatin condensation and enucleation. Trends Cell Biol. 2011;21(7):409–415. doi: 10.1016/j.tcb.2011.04.003. [DOI] [PMC free article] [PubMed] [Google Scholar]
- 56.Keerthivasan G, Wickrema A, Crispino JD. Erythroblast enucleation. Stem Cells Int. 2011;2011:139851. doi: 10.4061/2011/139851. [DOI] [PMC free article] [PubMed] [Google Scholar]
- 57.Granger BL, Lazarides E. Expression of the major neurofilament subunit in chicken erythrocytes. Science. 1983;221(4610):553–556. doi: 10.1126/science.6346488. [DOI] [PubMed] [Google Scholar]
- 58.Sangiorgi F, Woods CM, Lazarides E. Vimentin downregulation is an inherent feature of murine erythropoiesis and occurs independently of lineage. Development. 1990;110(1):85–96. doi: 10.1242/dev.110.1.85. [DOI] [PubMed] [Google Scholar]
- 59.Im H, et al. Measurement of protein-DNA interactions in vivo by chromatin immunoprecipitation. Methods Mol Biol. 2004;284:129–146. doi: 10.1385/1-59259-816-1:129. [DOI] [PubMed] [Google Scholar]
- 60.Vollrath AL, Smith AA, Craven M, Bradfield CA. EDGE(3): A web-based solution for management and analysis of Agilent two color microarray experiments. BMC Bioinformatics. 2009;10:280. doi: 10.1186/1471-2105-10-280. [DOI] [PMC free article] [PubMed] [Google Scholar]
Associated Data
This section collects any data citations, data availability statements, or supplementary materials included in this article.