

Abstract
Ovarian cancer is asymptomatic at early stages and most patients present with advanced levels of disease. Lack of cost-effective methods that can achieve frequent, simple and non-invasive testing hinders early detection and causes high mortality in ovarian cancer patients. Here, we report a simple and inexpensive microchip ELISA-based detection module that employs a portable detection system, i.e., a cell phone/charge-coupled device (CCD) to quantify an ovarian cancer biomarker, HE4, in urine. Integration of a mobile application with a cell phone enabled immediate processing of microchip ELISA results, which eliminated the need for a bulky, expensive spectrophotometer. The HE4 level detected by a cell phone or a lensless CCD system was significantly elevated in urine samples from cancer patients (n = 19) than normal healthy controls (n = 20) (p < 0.001). Receiver operating characteristic (ROC) analyses showed that the microchip ELISA coupled with a cell phone running an automated analysis application had a sensitivity of 89.5% at a specificity of 90%. Under the same specificity, the microchip ELISA coupled with a CCD had a sensitivity of 84.2%. In conclusion, integration of microchip ELISA with cell phone/CCD-based colorimetric measurement technology can be used to detect HE4 biomarker at the point-of-care (POC), paving the way to create bedside technologies for diagnostics and treatment monitoring.
Introduction
Ovarian cancer is the fifth leading cause of all cancer related mortality among women 1. Since ovarian cancer is asymptomatic at early stages, most patients present with advanced disease (stage III/IV) when diagnosed. Despite radical surgery and chemotherapy, 5 year survival rate of ovarian cancer at stage III and IV is only 33% compared to 90% at stage I 1, highlighting the need for early diagnosis and large scale screening among high-risk populations. However, existing diagnosis methods such as biopsy, medical imaging and genetic analysis cannot be used frequently for routine screening 1, 2. A medical survey revealed that lengthy and complex testing procedures associated with those methods hinder high-risk populations from seeking immediate medical care 3. Annual transvaginal sonography has been used to screen for ovarian cancer among subjects with a family history of ovarian cancer, which showed limited efficacy, when the ovarian volume remains normal 4, 5. Another common screening method is serum CA125, which is an enzyme-linked immunosorbent assay (ELISA), and has a sensitivity of 72% at specificity 95% 6. Technically, these two screening methods are invasive, costly and instrument dependent, and they cannot be established at the point-of-care (POC). Current ovarian cancer biochips based on the detection DNA sequences 7, 8 or protein biomarkers 9, 10 rely on fluorescence or chemiluminescence detection, which are designed and developed only for laboratory settings. Hence, there is an unmet need for developing a simple method to detect early-stage ovarian cancer at the POC.
POC diagnostics are appealing in terms of disease monitoring and control, including infectious diseases, cancer and diabetes, in both resource-limited and resource-rich settings. To offer POC testing by the bedside, the World Health Organization (WHO) has expressed the need for inexpensive, disposable and easy-to-use diagnostic devices 11, 12. This is particularly important for resource-limited settings, where there are limitations with trained personnel, infrastructure and medical instruments. Thus, the state-of-the-art diagnostic technologies such as polymerase chain reaction (PCR), ELISA or microarray have practical challenges to be established at the POC 13.
With advances in microelectromechanical systems (MEMS), miniaturization of ELISA on a single microchip has become feasible, coupled with detection technologies such as fluorescence detection 14–17, chemiluminescence 18, electrical detection 19–21 or colorimetric detection 22. However, these methods are expensive and technologically complex, and require bulky detection setups, which are not ideal for POC testing despite the use of miniaturized microchips. For instance, fluorescence or chemiluminescence detection often requires the use of a charge-couple device (CCD) camera interfaced with an expensive fluorescence microscope 23. Electrical detection of microchip ELISA requires reliable power supply and delicate circuitry to measure the change in impedance induced by the analyte. Colorimetric detection has been reported for on-chip ELISA using a CCD camera coupled to a microscope, which requires a computer and an analysis program 22. Although microchip ELISA results can also be seen by the naked eye, the analyte concentration cannot be quantitatively measured 24. Thus, inexpensive, simple and quick detection methods are desirable to facilitate microchip ELISA at the POC 25–27.
Human epididymis protein 4 (HE4) has been reported as a biomarker for ovarian cancer detection. Its concentration in serum has been shown to be correlated with the clinical status of ovarian cancer 28, 29,30. Here, we demonstrated a non-invasive detection strategy that combines microchip ELISA and cell phone/CCD camera based colorimetric measurement to detect HE4 in urine. Although cell phones have been previously evaluated as an imaging apparatus for medical diagnosis 31, 32, their capability to measure the biomarker concentration in clinical samples has not been reported. The cell phone integrated with the mobile application enabled immediate data processing of microchip ELISA results without referring to peripheral equipment for read-out and analysis. Via established mobile networks, this presented platform technology can be potentially used as a broadly applicable tool to diagnose other clinical diseases or to monitor treatment efficacy in resource-limited settings.
Materials and Methods
Microchip design and fabrication
We used a non-lithographic technique to fabricate microchips as previously published 26, 27. Polymethyl-methacrylate (PMMA) (McMaster Carr, Atlanta, GA) and double-sided adhesive film (iTapstore, Scotch Plains, NJ) were first cut using a laser cutter (VersaLaser™, Scottsdale AZ). The pieces were cut with dimensions of 24 × 40 mm2. On the top of the PMMA base (Figure S1), an inlet and outlet were cut with a diameter of 0.375 mm. Then, two layers of PMMA were assembled onto a polystyrene petri dish (BD Biosciences, San Jose, California) via two layers of double-side adhesive film, forming three microchannels. These microchannels had dimensions of 4 × 7.5 × 3.225 mm3 comprising an inlet and outlet at each end.
HE4 quantification with microchip ELISA and microplate ELISA immune assays
As shown in Figure 1, a urine sample was first loaded onto a postage stamp sized microchip (Figure 1A). On the microchip, the protein biomarker, i.e., HE4, was detected using a sandwich ELISA (Figure 1B). Once HE4 was captured by the immobilized capture antibody on-chip, a horseradish peroxidase (HRP) conjugated secondary antibody against HE4 was added, forming a sandwich immuno-complex. Upon addition of a substrate, tetramethylbenzidine (TMB), HRP catalyzed the substrate, and initiated a blue color development. The color intensity in each microchannel was correlated with the concentration of HE4 captured in urine. The colorimetric reaction was imaged using a cell phone camera (Figure 1C). The obtained ELISA images were instantly analyzed using an integrated mobile application and the HE4 concentration was reported on the cell phone screen (Figure 1D). Additionally, microchips were imaged with a lensless CCD (Figure S2).
Figure 1. Schematic of microchip ELISA coupled with cell phone-based colorimetric detection of ovarian cancer from urine.

(A) A small volume of urine sample was loaded into the microchip. (B) Sandwich ELISA was performed on a microchip. (C) The color development in the microchip was imaged with a cell phone built-in camera. (D) The concentration of HE4 in urine was calculated with an integrated mobile application. The mobile application reported the pixel values (red channel) from the selected region, i.e., marked with rectangles. Based on the regression of the standard curve, the concentration of HE4 biomarker from each microchannel was calculated and reported on the screen.
For microchip ELISA, samples and reagents were manually pipetted into the microchannel and incubation of samples and reagents (without mixing) were involved. The following testing procedure was listed, (1) pure HE4 peptide antigen was serially two-fold diluted in sodium bicarbonate (0.1 M, pH 9.7) to obtain final concentrations of 1,250, 625.0, 312.5, 156.3, 78.1, 39.1 and 19.5 ng/mL. Urinary peptides derived from human protein HE4 were modified for enhanced antigenicity. The optimized peptide sequences (CSLPNDKEGSCPQVNINFPQL) were synthesized and used to generate a rabbit polyclonal antibody (21st Century Biochemicals, Inc. Marlborough, MA). (2) One hundred microliters of each concentration was injected into the three-channel microchip with a pipette. (3) The HE4 quantification standards were incubated at room temperature for an hour. (4) The microchips were washed 3 times by injecting 200 μL of ELISA washing buffer (50 mM Tris-HCl, 150 mM NaCl and 0.05% Tween-20). (5) Microchips were blocked with 3% bovine serum albumin (BSA, m/v, Fischer Scientific, Pittsburgh, PA) at 37 °C for an hour, and step 4 was repeated. (6) An in-house developed anti-HE4-rabbit primary antibody (0.61 mg/mL) by Dr. Bin Ye was diluted in 1:50,000 in 3% BSA blocking buffer and injected into the microchips for incubation at 37 °C for an hour, and step 4 was repeated. (7) The secondary antibody, anti-rabbit-HRP (1 mg/mL, Abcam, Cambridge, MA), was diluted in 1:3,000 in Tris-buffered saline and Tween-20 (0.05%), and incubated at 37 °C for an hour, and step 4 was repeated. (8) For color development, 100 μL of one-Step ultra TMB (Thermo Fisher Scientific Inc., Waltham, MA) was injected, and incubated at room temperature in the dark for 9 minutes. (9) The color solution in microchannels was mixed by gentle pipetting. The optical color development was rapidly imaged using a cell phone camera or a portable lensless CCD (Figure S2). The total assay time was approximately 5 hours. Recently, there are techniques to decrease on-chip ELISA time within 15 minutes using magnetic particles because of significant increase of the surface area, which is applicable to the presented technology 33.
For conventional 96-well microplate ELISA, we followed the above procedure except at the detection step. Following addition of 100 μL of TMB, the microplate was incubated for 15 minutes at room temperature, and the color development was stopped by adding 100 μL of 1M H2SO4. The color intensity was measured by a microplate reader (BioTek, Winooski, VT) at a wavelength of 450 nm.
Quantitative image processing
A cell phone (Sony Ericson i790) with a 3.2 megapixel camera was used to image color development with ELISA. Alternatively, a lensless charge-coupled device (IPX-11M5, Imperx, Boca Raton, FL) with a resolution of 11 million pixels was utilized. The color intensity of red, green and blue pixel values was measured using a customized MATLAB (MathWorks, Natick, MA) code (see Supplementary Information S3). With this code, red, green and blue pixel values of each channel were reported within seconds as mean value ± standard deviation. We used the red (R) pixel values for our data analysis, since they demonstrated the widest range of color intensity for the catalyzed TMB substrate as measured using the CCD and cell phone.
To facilitate data processing, a mobile application (for source code and instructions see Supplementary Information sections S1 and S2) was developed to analyze microchip ELISA images and to report the levels of HE4 on the cell phone screen. The cell phone with the integrated mobile application carried out the following steps: (i) taking images or loading previously saved images for processing, (ii) selecting the regions within the channels for data analysis, (iii) converting color intensity into R values, (iv) normalizing R values from tested samples by that of the background, (v) calculating and storing the standard curve, and (vi) reporting the concentration of the patient samples. Based on the obtained cell phone images from the standards, the mobile application calculated the parameters of the standard curve and reported the concentrations of tested samples (ng/mL). For validation, the selected region from each channel by the mobile application was transferred to a laptop and processed using MATLAB (Table S1).
Clinical testing and statistical analysis
Forty de-identified and discarded clinical urine samples were obtained from Brigham and Women’s Hospital (Boston, MA) with approval from the institutional review board (IRB: 2006-P-001558/8, BWH). These urine samples were diluted 20 times in PBS, which had a pH of 7.2. One ovarian cancer patient was excluded for statistical analysis because of its aberrant urine creatinine concentration. The obtained HE4 concentrations were log-transformed, since they were not in normal distribution. Thus, the concentrations below 1 ng/mL appear as negative values after log-transformation. Box-Whisker analyses were performed using MedCalc Version 11.5.1 (Mariakerke, Belgium). Two-sample Wilcoxon ranks-sum test was used to determine whether the HE4 concentration from the ovarian cancer group, and the control group was within the same population. Bootstrapping was used to calculate 95% confidence intervals of AUROC and sensitivity given specificity. In each bootstrapping replicate, we first randomly sampled 39 subjects with replacement from the original data set. We then calculated the area under receiver operating characteristic curve (AUROC) and sensitivity given specificity based on this replicate. The 2.5 and 97.5 percentiles of the 10,000 estimated AUROC (sensitivity given specificity) were used as the lower and upper limits of the 95% CI. Statistical Software R (available at http://www.r-project.org/) was used to estimate the sensitivity given specificity and their 95% bootstrapping confidence intervals.
Results
To validate ELISA on-chip, we first measured off-chip readings from the microchip ELISA. The resultant color solution from each microchannel was transferred to a 96-well microplate, and the optical density (OD) was measured using a spectrophotometer. The HE4 standard curves from the microchip ELISA and conventional microplate ELISA presented similar linearity for HE4 peptide concentrations such as 1,250, 625.0, 312.5, 156.3, 78.1, 39.1 and 19.5 ng/mL, with an R2 of 0.94 (Figure 2A). The observed detection limit of HE4 in microchip ELISA was 19.5 ng/mL (8.48 nM). The results indicated that ELISA was reliably carried out on a microchip with a performance comparable to that on a 96-well microplate. Because of increased surface-to-volume ratio in the microchip, 9 minute TMB incubation was chosen for the HE4 microchip ELISA throughout this study to avoid saturated signals. Notably, lower OD readings were observed for the microchip ELISA than microplate ELISA, which was most likely due to the shorter incubation of TMB on-chip compared to 15-minute incubation on-plate.
Figure 2. Validation of HE4 ELISA on a microchip compared to conventional 96-well microplate ELISA.
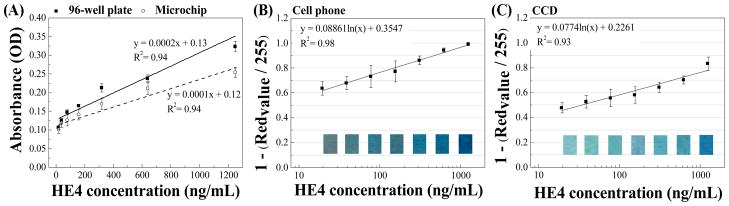
Microchip ELISA was first validated by collecting the color solution from the microchannel and read by a spectrophotometer. The standard curve obtained from microchip was compared with that obtained from a 96-well microplate (A). Further, HE4 microchip ELISA was coupled with the imaging detection with a cell phone (with an integrated mobile application) (B) or a lensless CCD camera (C). HE4 standards were tested on microchips and color development was imaged. The standard curve of HE4 on a microchip was then plotted. Data are presented as mean ± standard deviation (n = 8).
To achieve rapid detection using the microchip ELISA at the POC, we developed a detection algorithm using portable cell phone and lensless CCD imaging systems. Both systems relied on the analysis of red, green and blue pixel values of the color solution developed on-chip as a result of the ELISA reaction. In our study, the red pixel value had the widest changes among the tested standard concentrations ranging from 1,250 to 19.5 ng/mL (data not shown), and the changes in red pixel values were strongly correlated with the HE4 concentration (Figure 2). In the cell phone based approach, the integrated mobile application reported an R2 value of 0.98 for the standard curve over a range of 19.5 – 1,250 ng/mL (Figure 2B). In the CCD based approach, MATLAB was utilized to perform data analysis, and the R2 value of standard curve (0.93) was comparable to that obtained in microplate ELISA (Figure 2C).
The detection systems were further validated using urine samples from ovarian cancer patients (prior to surgery, n = 19) and age-matched healthy controls (n = 20). To determine whether these two groups were within the same distribution, we used a two-sample Wilcoxon ranks-sum test. For the microplate method, the means, standard errors of the sample mean (SEMs), and 95% CIs were −1.69, 0.31, [−2.29, −1.08] for normal urine samples and were 2.95, 0.27, [2.42, 3.47] for cancer urine samples. For the cell phone method, the means, SEMs, 95% CIs were 5.35, 0.09, [5.17, 5.52] for normal urine samples and were 6.68, 0.09, [6.50, 6.86] for cancer urine samples. For the CCD method, the means, SEMs and 95% CIs were 5.44, 0.08, [5.27, 5.61] for normal urine samples and were 6.79, 0.13, [6.54, 7.03] for cancer urine samples (Figure S3). P-values of two-sample Wilcoxon tests for these three methods were all < 0.001. The low p-values obtained by microchip ELISA and microplate ELISA indicated the logarithm-transformed HE4 concentrations for the majority of cancer urine samples was significantly greater than that of normal urine samples. Parallel boxplots showed that the detected level of HE4 after log-transformation in urine was significantly (p < 0.001) elevated in the ovarian cancer group compared to the control group using the cell phone and CCD based microchip ELISA, which was also observed in convention microplate ELISA (Figure 3, A–C).
Figure 3. Box-whisker analyses of log-transformed HE4 concentration in 39 clinical urine samples.

For all three methods, the logarithm-transformed HE4 concentrations for the majority (i.e., the “box” part of the box-whisker plot) of cancer urine samples (n=19) was greater than that of normal urine samples (n=20). The minimum, first quartile, median, third quartile, and maximum of the logarithm-transformed HE4 concentrations were −6.215, −1.623, 0.631, 0.572, 2.729, and 5.624 for the microplate method, 4.755, 5.188, 6.101, 5.999, 6.751, 7.965 for the cell phone method, and 4.550, 5.254, 5.844, 6.095, 6.865, 8.511 for the CCD method. A few outliers were observed for the logarithm-transformed HE4 concentrations measured by cell phone and CCD methods.
We compared our microchip ELISA with conventional 96-well microplate ELISA in both cancer and control groups using the Bland-Altman analysis method (Figure 4). The results indicated that microchip cell phone ELISA had bias in measuring log-transformed HE4 concentrations compared to microplate ELISA in both cancer patients (−0.7 to −6.8) and normal healthy controls (−3.5 to −10.6). Microchip CCD ELISA had bias in measuring log-transformed HE4 concentrations compared to microplate ELISA in both cancer patients (−0.7 to −7.0) and normal healthy controls (−3.6 to −10.6). Log-transformed HE4 concentrations measured by microchip cell phone ELISA and microchip CCD ELISA were in agreement, with a bias of 0.68 to 0.89 in cancer patients and a bias of 0.66 to 0.84 in normal healthy controls.
Figure 4. Bland-Altman analysis of clinical samples using 96-well microplate ELISA, microchip ELISA coupled with a cell phone or a CCD.

The quantification of HE4 in clinical urine samples obtained by microchip ELISA-cell phone was compared with that obtained by conventional microplate ELISA (A–B). The quantification of HE4 in clinical urine samples obtained by microchip ELISA-CCD was compared with that obtained by conventional microplate ELISA (C–D). The mean differences in HE4 quantification are represented by solid lines, with 95% confidence interval indicated by dashed lines.
To further evaluate the prediction power of the urine HE4 concentration, we constructed the ROC curve, and calculated the AUROC, sensitivity given specificity, and their 95% confidence intervals (CIs) (Figure 5). The 95% CIs of these parameters were based on 10,000 bootstrapping samples. We observed a sensitivity of 94.7%, 89.5% and 84.2% for the conventional 96-well microplate ELISA, microchip cell phone ELISA and microchip CCD ELISA with the specificity set to 90% for all three approaches (Table 1). The AUROCs were 0.979, 0.940 and 0.916 for microplate, microchip cell phone and microchip CCD ELISA, respectively. Since the AUROCs were close to the maximal possible value of 1, the urine HE4 concentration measured by all three methods had high accuracy to identify ovarian cancer patients from normal controls.
Figure 5. Receiver operating characteristic (ROC) analyses of conventional 96-well microplate ELISA as well as microchip ELISA coupled with a CCD or a cell phone.

The prediction accuracy of disease status based on these three methods was calculated by ROC analysis with the aid of a statistical program R. HE4 concentrations were log transformed. The area under ROC curves (AUROCs) for the three methods (microplate, cell phone, and CCD) were 0.979, 0.940, and 0.916, respectively. These data indicate that there are no statistically significant differences among the three AUROCs and these three methods can be all reliably used to differentiate ovarian cancer patients from normal controls.
Table 1.
AUROC, sensitivity and 95% CI to predict cancer status based on log-transformed HE4 concentrations.
| Microplate | Cell phone | CCD | ||||
|---|---|---|---|---|---|---|
|
| ||||||
| Estimated | 95% CI | Estimated | 95% CI | Estimated | 95% CI | |
| AUROC | 0.979 | [0.936, 1.000] | 0.940 | [0.852, 1.000] | 0.916 | [0.803, 0.995] |
| Sensitivity* | 0.947 | [0.647, 1.000] | 0.895 | [0.300, 1.000] | 0.842 | [0.619, 1.000] |
AUROC = Area under the ROC curve (AUROC), which was calculated with the trapezoidal rule. 95% CI was calculated based on 10,000 bootstrapping replicates. The HE4 concentrations were log transformed.
Sensitivity was calculated when the specificity was set to 90%. 95% CI was calculated based on 10,000 bootstrapping replicates.
Discussion
In this study, our goal was to demonstrate the feasibility of using a cell phone to facilitate microchip ELISA based non-invasive detection of HE4 in urine. We developed a colorimetric detection coupled with a cell phone/CCD for microchip ELISA readout, and a mobile application that measures the color intensity and reports the analyte concentration on a cell phone screen. The mobile application program can be installed on a smart cell phone to measure/analyze ELISA results without specialized instruments (e.g., a microplate reader and a computer). The developed microchip ELISA either coupled with cell phone detection or CCD detection demonstrated the reliability to differentiate cancer patients from their healthy controls, as indicated by p values (< 0.001) (Table 1). Identification of cancer patients among high-risk populations would potentially enable early treatment, which is key to reduce the high mortality 1. In addition, the message texting capability of cell phones via mobile networks allows important demographic or epidemiologic variables to be inputted by the end-user to improve diagnosis (e.g., the risk of malignancy prediction required menopausal status to be known 34). Most importantly, non-invasive urine testing offers easy sample collection and frequent testing, as it has been used to detect ovarian cancer 30, 35, 36. Thus, this cell phone based detection module can be potentially used for early detection of ovarian cancer among high-risk populations as well as follow-up treatment monitoring at the POC.
To adapt a simple detection method for microchip ELISA, we developed cell phone based colorimetric detection of HE4 concentrations ranging from 1,250, 625.0, 312.5, 156.3, 78.1, 39.1 to19.5 ng/mL (Figure 2). As tested, the LOD for HE4 in this study was 19.5 ng/mL (8.48 nM). Although electro-immunosensing (10−3–10−1 μg/mL) 37 or a bio-barcode assay (BCA) technologies (500 aM) 38 are more sensitive, they require special instruments for rapid quantification readout. Recently, another rapid method i.e., surface-enhanced Raman spectroscopy (SERS) was used to measure analytes in urine in seconds that detected analytes at relatively high concentrations (0.5 μg/mL) 39. Although the cell phone based detection is simple, we found that detection of color change in microchannels was limited by the height of microchannels. To overcome this limitation, we built microchannels to be as thick as 3.225 mm to ensure that color development can be detected by a cell phone camera. Some other physical limits (e.g., reaction and diffusion) also play important roles in microscale sensing 40. We overcame these limitations by mixing the color solution in microchannels using a pipet.
In this study, the sensitivity of microchip ELISA coupled with a cell phone or a CCD was 89.5% and 84.2%, when the specificity was set to 90%. The observed sensitivity was comparable to that obtained in a previous study using conventional microplate ELISA, in which a sensitivity of 86.6% for early stage (I/II) and 89% for late stage (III/IV), when the specificity was set to 94.4% 30. However, it should be noted that a combo HE4 biomarker (weighted average of urinary HE4 level and HE4/creatinine ratio) was used for calibration in the previous study. Currently, there is not a standard method to calibrate the urine biomarkers. It has been reported that the urinary creatinine level may not be the ideal calibrator for urine biomarker normalization 41, especially for cancer patients at advanced stages, who may have renal failure or impairment due to cancer progression or chemotherapy intervention 42, 43. In this study, the urine samples were collected from late stages (III and IV) of ovarian cancer patients, and no creatinine-based calibration was performed.
In both cancer patients and normal controls, we observed the bias in HE4 quantification using microchip ELISA (both CCD and cell phone) compared to the microplate ELISA (Figure 4, A–D), indicating that there are differences in quantifying urinary HE4 between these two methods. This is most likely due to batch-processing of the clinical samples on microchips. Unlike the 96-well microplate, we did not stop the color development on microchip since the stop solution would remove the color solution. Since the time window to take images before saturated signals occurred was narrow, we divided the 48 samples (tested in duplicates) including quantification standards into 6 batches (8 samples per batch). Despite this, we observed slightly over-developed signals for some cases. The slightly over-developed signals may have contributed to higher quantification of these samples on-chip than on the microplate. In comparison, the HE4 measurement by microchip ELISA was in agreement (Table 1). Considering the variation between batch processing, fully automated microchip ELISA is needed to reduce variation and improve the correlation between microchip ELISA and microplate ELISA. Despite the bias in HE4 quantification between these two methods, the microchip ELISA was able to differentiate ovarian cancer patients from normal controls (Figure 3). In short, the microchip ELISA can potentially expand the access to ovarian cancer care program at the POC as a pre-screening tool.
In this study, we developed a CCD-based colorimetric readout from microchip ELISA. The presented CCD detector is a lensless system, which is different from a cell phone camera (as setups were shown in Figure S2). Existing systems use CCDs coupled to lenses as a part of an imaging apparatus such as confocal or fluorescence microscope 14–17. These existing systems are not suitable for POC testing because of the high cost, maintenance, and portability issues 23, 26. In comparison, we used a lensless CCD setup to detect the color change without using a fluorescence microscope, which makes it more affordable, portable, and simpler to maintain. Further, the lensless CCD system has a wide field of view (FOV), which is significantly larger than that of a microscope, and can immediately capture the whole microchip area without scanning. Scanners are also not desirable for resource-limited settings due to the cost and difficulty of maintenance.
We also evaluated the reproducibility of the microchip ELISA coupled to a cell phone. In three independent experiments, the linearity of the standard curve was highly comparable with R2 of 0.938, 0.992, and 0.972 (Supplementary Information, Table S2), respectively. These results indicated that the microchip ELISA was reproducible despite multiple testing steps involved in the prototype. During the clinical testing, experiments were carried out by two operators. We did not observe significant difference in the concentration of HE4 obtained by these two operators. In the current setup, the assay involves repeatable cycles of reagent flow into a channel by manual pipetting. This reagent flow steps can be automated with the aid of a micro-pump, which will minimize the pipetting complexity 26, 44. Thus, further product development can be made at a commercialization level so that it can reach the stage of field testing at the POC.
In conclusion, we demonstrated the integration of a cell phone with microchip ELISA through a mobile application that can detect the HE4 biomarker in urine from ovarian cancer patients. This simple, non-invasive testing strategy can potentially aid early detection of ovarian cancer among high risk populations, and monitor treatment efficacy in the follow-up visits at the POC. With an integrated mobile application, this module can be employed in both resource-rich and resource-limited settings because of increasingly available mobile networks, whereby the appropriate clinical information can be instantly and remotely transferred between patients and physicians. This microchip and cell phone-based POC approach can become a broadly applied biotechnological tool, for any disease having a reasonably well-described ELISA biomarker.
Supplementary Material
S 1. Mobile application for colorimetric measurement
S 2. Mobile Application Instructions
S 3. Matlab code for colorimetric measurement
Table S1 Comparison of Red pixel values obtained by MATLAB and mobile application.
Table S2 Reproducibility of microchip ELISA coupled with cell phone detection.
Table S3 Mobile application code files for colorimetric detection.
Figure S1 Layer-by-layer assembly of an ELISA microchip.
Figure S2 Colorimetric measurement setups for a cell phone (a) and a lensless CCD (b).
Figure S3 Barplot of mean logarithm-transformed HE4 concentration with 95% confidence interval.
Acknowledgments
We would like to acknowledge the W.H. Coulter Foundation Young Investigator Award, RO1 A1081534, R21 AI087107. This work was supported by the Center for Integration of Medicine and Innovative Technology (CIMIT) under U.S. Army Medical Research Acquisition Activity Cooperative Agreements DAMD17-02-2-0006, W81XWH-07-2-0011, and W81XWH-09-2-0001. And this work was made possible by a research grant that was awarded and administered by the U.S. Army Medical Research & Materiel Command (USAMRMC) and the Telemedicine & Advanced Technology Research Center (TATRC), at Fort Detrick, MD. We also acknowledge NIH U01 HL065899-08. We thank Dr. Tariq Manzur for the support on the Imperx CCD setup. We also thank Hooman Safaee for help on schematics.
Footnotes
Author contributions
S.W. contributed to experiment design, performed the experiment and wrote the manuscript. X.Z. performed the experiment on microchip ELISA. I.K. performed the experiment on microchip ELISA. R.A. developed the mobile application, performed data analysis and wrote the manuscript. D.E. performed conventional ELISA. W.Q. performed the statistical analysis. D.C. performed the statistical analysis and wrote the manuscript. B.Y. contributed to experiment design, wrote the manuscript. U.D. supervised the project, contributed to experiment design, and wrote the manuscript.
References
- 1.Clarke-Pearson DL. N Engl J Med. 2009;361:170–177. doi: 10.1056/NEJMcp0901926. [DOI] [PubMed] [Google Scholar]
- 2.Hennessy BT, Coleman RL, Markman M. Lancet. 2009;374:1371–1382. doi: 10.1016/S0140-6736(09)61338-6. [DOI] [PubMed] [Google Scholar]
- 3.Lancet. 2009;374:1302. No author listed. [Google Scholar]
- 4.van Nagell JR, Depriest PD, Reedy MB, Gallion HH, Ueland FR, Pavlik EJ, Kryscio RJ. Gynecologic Oncology. 2000;77:350–356. doi: 10.1006/gyno.2000.5816. [DOI] [PubMed] [Google Scholar]
- 5.van Nagell JR, DePriest PD, Ueland FR, DeSimone CP, Cooper AL, McDonald JM, Pavlik EJ, Kryscio RJ. Cancer. 2007;109:1887–1896. doi: 10.1002/cncr.22594. [DOI] [PubMed] [Google Scholar]
- 6.Visintin I, Feng Z, Longton G, Ward DC, Alvero AB, Lai YL, Tenthorey J, Leiser A, Flores-Saaib R, Yu H, Azori M, Rutherford T, Schwartz PE, Mor G. Clinical Cancer Research. 2008;14:1065–1072. doi: 10.1158/1078-0432.CCR-07-1569. [DOI] [PubMed] [Google Scholar]
- 7.Mavrogiannopouloul E, Petrou PS, Kakabakos SE, Misiakos K. Biosensors & Bioelectronics. 2009;24:1341–1347. doi: 10.1016/j.bios.2008.07.061. [DOI] [PubMed] [Google Scholar]
- 8.Yim SC, Park HG, Chang HN, Cho DY. Analytical Biochemistry. 2005;337:332–337. doi: 10.1016/j.ab.2004.11.034. [DOI] [PubMed] [Google Scholar]
- 9.Bast RC, Jr, Hennessy B, Mills GB. Nat Rev Cancer. 2009;9:415–428. doi: 10.1038/nrc2644. [DOI] [PMC free article] [PubMed] [Google Scholar]
- 10.Gagnon A, Ye B. Current Opinion in Obstetrics & Gynecology. 2008;20:9–13. doi: 10.1097/GCO.0b013e3282f226a5. [DOI] [PubMed] [Google Scholar]
- 11.Lee WG, Kim YG, Chung BG, Demirci U, Khademhosseini A. Adv Drug Deliv Rev. 2010;62:449–457. doi: 10.1016/j.addr.2009.11.016. [DOI] [PMC free article] [PubMed] [Google Scholar]
- 12.Wang S, Xu F, Demirci U. Biotechnol Adv. 2010;28:770–781. doi: 10.1016/j.biotechadv.2010.06.004. [DOI] [PMC free article] [PubMed] [Google Scholar]
- 13.Peeling RW, Holmes KK, Mabey D, Ronald A. Sex Transm Infect. 2006;82:V1–V6. doi: 10.1136/sti.2006.024265. [DOI] [PMC free article] [PubMed] [Google Scholar]
- 14.Eteshola E, Balberg M. Biomedical Microdevices. 2004;6:7–9. doi: 10.1023/b:bmmd.0000013360.65653.c2. [DOI] [PubMed] [Google Scholar]
- 15.Babu S, Mohapatra S, Zubkov L, Murthy S, Papazoglou E. Biosens Bioelectron. 2009;24:3467–3474. doi: 10.1016/j.bios.2009.04.043. [DOI] [PubMed] [Google Scholar]
- 16.Cho IH, Paek EH, Kim YK, Kim JH, Paek SH. Anal Chim Acta. 2009;632:247–255. doi: 10.1016/j.aca.2008.11.019. [DOI] [PubMed] [Google Scholar]
- 17.He H, Yuan Y, Wang W, Chiou NR, Epstein AJ, Lee LJ. Biomicrofluidics. 2009;3:22401. doi: 10.1063/1.3116665. [DOI] [PMC free article] [PubMed] [Google Scholar]
- 18.Mobini Far HR, Torabi F, Danielsson B, Khayyami M. J Anal Toxicol. 2005;29:790–793. doi: 10.1093/jat/29.8.790. [DOI] [PubMed] [Google Scholar]
- 19.Liu Y, Wang H, Huang J, Yang J, Liu B, Yang P. Anal Chim Acta. 2009;650:77–82. doi: 10.1016/j.aca.2009.06.048. [DOI] [PubMed] [Google Scholar]
- 20.Hoegger D, Morier P, Vollet C, Heini D, Reymond F, Rossier JS. Analytical and Bioanalytical Chemistry. 2007;387:267–275. doi: 10.1007/s00216-006-0948-6. [DOI] [PubMed] [Google Scholar]
- 21.Rossier JS, Girault HH. Lab on a Chip. 2001;1:153–157. doi: 10.1039/b104772h. [DOI] [PubMed] [Google Scholar]
- 22.Christodoulides N, Mohanty S, Miller CS, Langub MC, Floriano PN, Dharshan P, Ali MF, Bernard B, Romanovicz D, Anslyn E, Fox PC, McDevitt JT. Lab on a Chip. 2005;5:261–269. doi: 10.1039/b414194f. [DOI] [PubMed] [Google Scholar]
- 23.Gurkan UA, Moon S, Geckil H, Xu F, Wang S, Lu TJ, Demirci U. Biotechnol J. 2011;6:138–149. doi: 10.1002/biot.201000427. [DOI] [PMC free article] [PubMed] [Google Scholar]
- 24.Yu L, Li CM, Liu Y, Gao J, Wang W, Gan Y. Lab Chip. 2009;9:1243–1247. doi: 10.1039/b816018j. [DOI] [PubMed] [Google Scholar]
- 25.Alyassin MA, Moon S, Keles HO, Manzur F, Lin RL, Haeggstrom E, Kuritzkes DR, Demirci U. Lab Chip. 2009;9:3364–3369. doi: 10.1039/b911882a. [DOI] [PMC free article] [PubMed] [Google Scholar]
- 26.Moon S, Keles HO, Ozcan A, Khademhosseini A, Haeggstrom E, Kuritzkes D, Demirci U. Biosens Bioelectron. 2009;24:3208–3214. doi: 10.1016/j.bios.2009.03.037. [DOI] [PMC free article] [PubMed] [Google Scholar]
- 27.Kim YG, Moon S, Kuritzkes DR, Demirci U. Biosens Bioelectron. 2009;25:253–258. doi: 10.1016/j.bios.2009.06.023. [DOI] [PMC free article] [PubMed] [Google Scholar]
- 28.Hellstrom I, Raycraft J, Hayden-Ledbetter M, Ledbetter JA, Schummer M, McIntosh M, Drescher C, Urban N, Hellstrom KE. Cancer Res. 2003;63:3695–3700. [PubMed] [Google Scholar]
- 29.Moore RG, McMeekin DS, Brown AK, DiSilvestro P, Miller MC, Allard WJ, Gajewski W, Kurman R, Bast RC, Jr, Skates SJ. Gynecol Oncol. 2009;112:40–46. doi: 10.1016/j.ygyno.2008.08.031. [DOI] [PMC free article] [PubMed] [Google Scholar]
- 30.Hellstrom I, Heagerty PJ, Swisher EM, Liu P, Jaffar J, Agnew K, Hellstrom KE. Cancer Lett. 2010;296:43–48. doi: 10.1016/j.canlet.2010.03.013. [DOI] [PMC free article] [PubMed] [Google Scholar]
- 31.Breslauer DN, Maamari RN, Switz NA, Lam WA, Fletcher DA. PLoS One. 2009;4:e6320. doi: 10.1371/journal.pone.0006320. [DOI] [PMC free article] [PubMed] [Google Scholar]
- 32.Granot Y, Ivorra A, Rubinsky B. Plos One. 2008;3:e2075. doi: 10.1371/journal.pone.0002075. [DOI] [PMC free article] [PubMed] [Google Scholar]
- 33.Lien KY, Hung LY, Huang TB, Tsai YC, Lei HY, Lee GB. Biosensors & Bioelectronics. 2011;26:3900–3907. doi: 10.1016/j.bios.2011.03.006. [DOI] [PMC free article] [PubMed] [Google Scholar]
- 34.Moore RG, McMeekin DS, Brown AK, DiSilvestro P, Miller MC, Allard WJ, Gajewski W, Kurman R, Bast RC, Jr, Skates SJ. Gynecologic Oncology. 2009;112:40–46. doi: 10.1016/j.ygyno.2008.08.031. [DOI] [PMC free article] [PubMed] [Google Scholar]
- 35.Chambers AF, Vanderhyden BC. Clin Cancer Res. 2006;12:323–327. doi: 10.1158/1078-0432.CCR-05-2563. [DOI] [PubMed] [Google Scholar]
- 36.Ye B, Skates S, Mok SC, Horick NK, Rosenberg HF, Vitonis A, Edwards D, Sluss P, Han WK, Berkowitz RS, Cramer DW. Clinical Cancer Research. 2006;12:432–441. doi: 10.1158/1078-0432.CCR-05-0461. [DOI] [PubMed] [Google Scholar]
- 37.Ko YJ, Maeng JH, Ahn Y, Hwang SY, Cho NG, Lee SH. Electrophoresis. 2008;29:3466–3476. doi: 10.1002/elps.200800139. [DOI] [PubMed] [Google Scholar]
- 38.Goluch ED, Nam JM, Georganopoulou DG, Chiesl TN, Shaikh KA, Ryu KS, Barron AE, Mirkin CA, Liu C. Lab Chip. 2006;6:1293–1299. doi: 10.1039/b606294f. [DOI] [PubMed] [Google Scholar]
- 39.Wang H, Malvadkar N, Koytek S, Bylander J, Reeves WB, Demirel MC. J Biomed Opt. 2010;15:027004. doi: 10.1117/1.3369002. [DOI] [PubMed] [Google Scholar]
- 40.Squires TM, Messinger RJ, Manalis SR. Nat Biotechnol. 2008;26:417–426. doi: 10.1038/nbt1388. [DOI] [PubMed] [Google Scholar]
- 41.Waikar SS, Sabbisetti VS, Bonventre JV. Kidney Int. 2010;78:486–494. doi: 10.1038/ki.2010.165. [DOI] [PMC free article] [PubMed] [Google Scholar]
- 42.Stabuc B, Vrhovec L, Stabuc-Silih M, Cizej TE. Clin Chem. 2000;46:193–197. [PubMed] [Google Scholar]
- 43.Montgomery MJ, Beringer PM, Louie SG, Gill MA. Ther Drug Monit. 2000;22:695–700. doi: 10.1097/00007691-200012000-00008. [DOI] [PubMed] [Google Scholar]
- 44.Kakuta M, Takahashi H, Kazuno S, Murayama K, Ueno T, Tokeshi M. Meas Sci Technol. 2006;17:3189–3194. [Google Scholar]
Associated Data
This section collects any data citations, data availability statements, or supplementary materials included in this article.
Supplementary Materials
S 1. Mobile application for colorimetric measurement
S 2. Mobile Application Instructions
S 3. Matlab code for colorimetric measurement
Table S1 Comparison of Red pixel values obtained by MATLAB and mobile application.
Table S2 Reproducibility of microchip ELISA coupled with cell phone detection.
Table S3 Mobile application code files for colorimetric detection.
Figure S1 Layer-by-layer assembly of an ELISA microchip.
Figure S2 Colorimetric measurement setups for a cell phone (a) and a lensless CCD (b).
Figure S3 Barplot of mean logarithm-transformed HE4 concentration with 95% confidence interval.