

Abstract
Epileptic seizures are due to abnormal synchronized neuronal discharges. Techniques measuring electrical changes are commonly used to analyze seizures. Neuronal activity can be also defined by concomitant hemodynamic and metabolic changes. Simultaneous electroencephalogram (EEG)‐functional MRI (fMRI) measures noninvasively with a high‐spatial resolution BOLD changes during seizures in the whole brain. Until now, only a static image representing the whole seizure was provided. We report in 10 focal epilepsy patients a new approach to dynamic imaging of seizures including the BOLD time course of seizures and the identification of brain structures involved in seizure onset and discharge propagation. The first activation was observed in agreement with the expected location of the focus based on clinical and EEG data (three intracranial recordings), thus providing validity to this approach. The BOLD signal preceded ictal EEG changes in two cases. EEG‐fMRI may detect changes in smaller and deeper structures than scalp EEG, which can only record activity form superficial cortical areas. This method allowed us to demonstrate that seizure onset zone was limited to one structure, thus supporting the concept of epileptic focus, but that a complex neuronal network was involved during propagation. Deactivations were also found during seizures, usually appearing after the first activation in areas close or distant to the activated regions. Deactivations may correspond to actively inhibited regions or to functional disconnection from normally active regions. This new noninvasive approach should open the study of seizure generation and propagation mechanisms in the whole brain to groups of patients with focal epilepsies. Hum Brain Mapp, 2009. © 2009 Wiley‐Liss, Inc.
Keywords: seizure, epilepsy, imaging, fMRI, EEG
INTRODUCTION
An epileptic seizure is characterized by an abnormal and excessive synchronized discharge of a group of neurons that leads to clinical manifestations (motor, sensory, autonomic, or psychic symptoms). The current way to visualize this abnormal neuronal activity in patients is to study the electrical changes using the electroencephalogram (EEG). However, neuronal activity can be defined by electrical changes as well as by hemodynamic and metabolic changes [Logothetis, 2008; Ugurbil et al., 2003]. It has been suggested that metabolic changes may precede visible electrical changes in some cases [Baumgartner et al., 1998; Zhao et al., 2007]. Although the order of occurrence and the relationship between the neuronal and the metabolic and hemodynamic components are not completely known, the study of the latter could provide different insights regarding brain activity during seizures. Until now, low‐temporal resolution reduced the interest of the hemodynamic and metabolic measurements during seizures, in contrast with the high‐temporal resolution and dynamic aspects of EEG investigations. Development of a new technique with high spatial and temporal resolution would be helpful in understanding the ictal epileptic process. This could remove uncertainties left by the electrical analysis approach, still limited by low‐spatial resolution for scalp EEG and limited sampling for intracerebral EEG. Thus, although focal seizures are thought to originate from a small brain region, the epileptic focus, the recent literature has emphasized the existence of epileptic networks of uncertain extent as the source of focal seizures [Bartolomei et al., 2008; Nair et al., 2004]. One of the main reasons for these continued controversies and uncertainties is that there is no means to measure electrical activity simultaneously in the whole brain. This limitation of the EEG technique reduces as well the potential explanatory role of ictal propagation studies with EEG. During seizures, some clinical signs may be difficult to explain by electrical analysis alone: negative symptoms, such as cognitive disorders for instance, could be more related to hemodynamic and metabolic dysfunction than to electrical changes.
In this study, we propose a method that addresses the fundamental limitations of intracerebral EEG, the actual gold standard for focus localization in humans, spatial under‐sampling, and invasiveness. By combining EEG and functional MRI (fMRI), it has been possible to study, in the whole brain and noninvasively, the metabolic correlates of interictal epileptic discharges [Gotman, 2006; Lemieux, 2004]. Previous studies have described the application of this method to short epileptic seizures [Di Bonaventura et al. 2006a, b; Federico et al., 2005; Kobayashi et al., 2006a; Salek‐Haddadi et al., 2002, 2003; Tyvaert et al., 2008], providing a nondynamic image collapsed over time of the whole seizure, mixing onset, and propagation, similarly to what is possible with SPECT [Van Paesschen et al., 2007] although with higher spatial resolution. We propose an approach to the analysis of EEG‐fMRI data that allows following the evolution of a seizure with 2‐s time resolution and 5‐mm spatial resolution, thus providing a unique view of the onset and the propagation of epileptic seizures with data obtained from the whole brain of humans, noninvasively. The method provides information on regions with increased or decreased metabolism and thus allows tracing the evolution of seizure activity and its effects.
EXPERIMENTAL
Subjects
The database of 3 T EEG‐fMRI recordings performed at the Montreal Neurological Institute and Hospital from May 2006 to June 2008 includes 93 focal epilepsy patients recruited because of a frequent interictal epileptiform activity seen on a previous EEG. None was recruited because of a high probability of seizure occurrence and no specific action was taken to increase this probability (drug reduction or sleep deprivation). We selected from this group 17 patients who had a spontaneous ictal EEG discharge during the EEG‐fMRI recording. Patients gave written informed consent in agreement with the local ethics committee procedure.
The occurrence of typical clinical signs simultaneously with EEG changes could not be used as the only criterion to define ictal EEG discharges, because subtle clinical changes could be missed inside the scanner even with video monitoring. In three patients (3, 7, and 8) typical clinical signs were observed during the EEG discharge (Table II). For others, we defined as ictal a sustained rhythmic EEG change clearly distinguished from background and from interictal activity and similar to discharges recorded earlier during routine or telemetry EEGs. Compared with brief interictal discharges, ictal discharges were longer (≥6 s) and included a propagation pattern of the rhythmic component. The duration of 6 s was used for the definition of ictal events in our population even if in the literature very short ictal events have been reported [Asano et al., 2005]. All EEG discharges selected in our patients fulfilled these criteria. To analyze the time course of these events, we excluded patients with unclear seizure boundaries (onset/end), recordings with large motion (superior to 1 mm in translation or 1° in rotation) and to facilitate the final interpretation, patients with brain resection. In total, seven patients were excluded (one for unclear boundaries and surgery and six for motion). Ten patients were analyzed (Tables I and II).
Table II.
Clinical and scalp electrical features of the ictal event recorded in EEG‐fMRI
| Pts | Ictal EEG pattern during fMRI | Duration | Clinical manifestations | Similar events in the run (nb) | Other types of epileptiform events (nb) | Number of F test windows (peak start/nd) | Statistical threshold (voxels/ F‐value) |
|---|---|---|---|---|---|---|---|
| 1 | L FT spiking activity followed by rhythmic 10–12 Hz bil F and L T activity and then by sharp and slow waves in the same areas. | 12.5 s | No | 1 | Bil FTP spikes (8) | 18 (−9/29) | 5/5.7 |
| 2 | L T sharp waves followed by clear 11–12 Hz discharge and by LT slow waves at the end. | 10.6 s | No | 4 | No | 17 (−9/27) | 4/5.7 |
| 3 | 7 Hz sharp wave discharges over R TPO and L TO areas followed by rhythmic bil spike and waves. | 23.5 s | Possible mouth movement | 9 | Bil O slow waves (11) | 24 (−9/41) | 5/5.75 |
| 4 | R TPO discharges propagating to L homologous regions | 13.1 s | No | 2 | L TP polyspikes and spikes (4), R TP polyspikes and spikes (8), bil TP polyspikes (2) and slow waves (1) | 24 (−9/41) | 5/5.75 |
| 5 | Bil O and R TPO discharges | 13.5 s | No | — | Bil TPO rhythmic slow waves (1) | 18 (−9/29) | 5/5.7 |
| 6 | Rhythmic spike and slow wave discharges over R post quadrant followed by bil spiking activity with a clear R predominance. | 12.3 s | No | — | R T spikes (14) or slow waves (5), (4.5s before the discharge) | 17 (−9/27) | 4/5.7 |
| 7 | R F rhythmic spike and waves with secondary bil F involvement | 11.1 s | Deep breath | 3 | L FT spike (1), R F spike and slow waves (8) | 17 (−9/27) | 4/5.7 |
| 8 | Bil FC sharp waves (predominant on the R) with rapid diffusion and after 29s predominance again of sharp and slow waves over the R FC region. | 44.6 s | Leg jerks | 2 | No | 34 (−9/61) | 5/5.8 |
| 9 | R FC slow waves followed by a 10Hz rhythmic activity over bil F and parasagittal areas and then by slow waves on the R side. | 7.7 s | No | — | No | 16 (−9/25) | 4/5.7 |
| 10 | Post R T spikes associated later in the seizure with synchronous or asynchronous L T spikes. | 45 s | No | — | R sharp waves (2), R slow waves (5), general rhythmic fast activity (3). | 34 (−9/61) | 5/5.8 |
| R T spike 9 s before seizure onset | |||||||
| Mean ± SD | 19.4 ± 14 s |
R, right; L, left; Bil, bilateral; T, temporal; F, frontal; C, central; P, parietal; O, occipital; nb, number.
Table I.
Characteristics of patients: clinical, anatomical MRI, and EEG features
| Pts | Age (year) | Epilepsy type | Age of seizure onset (year) | Anatomical MRI | Seizure semiology | EEG pattern of usual seizures | Interictal EEG | iEEG |
|---|---|---|---|---|---|---|---|---|
| 1 | 22 | FLE | 11 | N | Two types: (1) GTC; (2) Absences with staring and unresponsiveness during 30s. | Bursts of sharp and slow wave discharges followed by low voltage fast activity seen diffusely over both hemispheres. Postictal rhythmic biF sharp and slow wave discharges with L predominance. | BiF sharp and slow wave discharges during sleep; LT spikes; bursts of bil fast activity during sleep (with a L predominance). | None |
| 2 | 29 | LTPE | 18 | N | Déjà vu, anxiety, and palpitations followed by dysphasia and staring. Duration 30 s. | 10 Hz rhythmic sharp wave discharges over the L T areas followed by amplitude increase and reduced frequency. | LT spikes. | None |
| 3 | 19 | RTPOLE | 13 | N | Distortion of the L visual field (sometimes R side also) sometime associated with a loss of consciousness, left eyes deviation and tongue movements. Postictal headache. | 10 Hz rhythmic R TPO sharp activity followed by secondary generalization. | R TPO spikes | None |
| 4 | 26 | Bil TOLE | 9 | Band heterotopia predominating over P, O, and T, R > L | Chest pressure feeling followed by loss of contact, staring, chewing, and sometimes R eyes deviation. | Bil post T (R predominance) slow waves followed by rhythmic fast activity and irregular generalized slow waves. | Bil TO (R predominance) spike and slow waves complexes. | None |
| 5 | 23 | TOLE | 13 | Band heterotopia predominating over the bil F and P regions. | Visual illusions, micropsia followed by blindness or sees lights forming faces. | Prolonged EEG seizures, maximal over post temporal regions with a R predominance | Synchronous and rhythmic sharp‐and‐slow wave discharges over post head regions. | None |
| 6 | 20 | R TPE | 14 | Complex MCD over the R TPO with large heterotopic gray matter nodules and abnormal overlying cortex. | Visual distortion with color change, followed by confusion. | Brief rhythmic 5 Hz discharges over R TP areas | R TP sharp waves or spikes. | Depth electrodes: regional post T and PO onset. |
| 7 | 11 | RFLE | 5 | R ant. F suspected focal cortical dysplasia. | Sensation of fear followed by a deep breath movement, sometimes followed by a scream and head turn to the L. | Prolonged bursts of rhythmic bil F spike‐waves with a clear R predominance. | R F spikes. | Preoperative ECoG: R frontopolar and interhemispheric grids. R F rhythmic spikes. |
| 8 | 68 | RFLE | 1 month before | Single metastasis in the R post SMA | L eyelids clonus followed by jerks of the four limbs. | Bursts of R F slow waves followed by a generalized rhythmic discharge. | — | None |
| 9 | 42 | FCTE | 9 | R F atrophy, L TP and R T trepanation | During night only, slow head and chest flexion followed by L arm extension and R head deviation (5 s). | Bil FC rhythmic sharp wave activity. | R FC slow waves | None |
| 10 | 36 | FTLE | 4 | L FT atrophy | In the childhood: R body weakness post meningoencephalitis. Two types: 1. Drop attacks. 2. Head and eyes deviation to the L, dystonic posturing of the L arm. | Generalized depression then rhythmic slow waves and spikes on the R side. In postictal R rhythmic slow waves. | Generalized slow waves, polysharp‐slow waves over the R electrodes, sometimes more over the FT convexity. | ECoG: Strips located over the LFT convexity: technical problem with two of four grids. Absence of early focal left hemisphere discharge during seizures. |
Patients are ordered according to the type of brain lesion. R, right; L, left; Bil, bilateral; T, temporal; F, frontal; C, central; P, parietal; O, occipital; N, normal; MCD, malformation of cortical development; Max, maximum; ECoG, electrocorticography.
EEG‐fMRI Recording
The EEG signal was recorded using 25 scalp MR compatible electrodes placed using the 10–20 international EEG system. FCz was the reference and the electrocardiogram was recorded with two electrodes placed on the back. The head was maintained in position with a combination of vacuum pillow and foam cushions (Siemens, Germany) to improve patient comfort and to reduce movement artifacts. Data were transmitted from a BrainAmp amplifier (Brain Products, Munich, Germany, 5 kHz sampling rate) via an optic fiber cable to the EEG monitor located outside the scanner room.
EPI functional images were acquired in a 3 T MR scanner (Siemens, Trio, Germany). A T1 weighted anatomical image (1‐mm slice thickness, 256 × 256 matrix; TE = 7.4 ms and TR = 23 ms; flip angle 30°) was used for superposition with the functional images. For functional data, 6–15 runs of 6 min each were acquired in T2* weighted EPI sequence (voxel dimensions 5 × 5 × 5 mm, 25 slices, 64 × 64 matrix; TE = 30 ms and TR = 1750 ms; flip angle 90°).
Patients were recorded at rest during up to 2 h inside the MRI. A video camera and the EEG signal (with the gradient artifact filtered online) were used by a neurologist to monitor the patient during the entire recording. In case of clinical seizure, clinical signs were carefully collected. To avoid physically injury, the recording was stopped and the patient extracted of the machine in case of large movements or if the start of secondary generalization could be observed on the EEG. No specific drug reduction, sleep deprivation, or other seizure induction method was performed.
Data Processing
The EEG signal was secondarily processed off‐line using Brain Vision Analyser software (Brain Products, Munich, Germany) with correction of the gradient artifact and filtering of the EEG signal [Allen et al., 2000]. A 50‐Hz low‐pass filter was applied to remove the remaining artifact. Independent component analysis was used to extract the ballistocardiogram artifact [Bénar et al., 2003]. After correction of the EEG, a neurologist reviewed the signal. Epileptiform events were marked according to their type, location, and duration. For this study, specific attention was placed on prolonged epileptiform discharges (≥6 s) associated or not with clinical signs. In the latter, onset and end of the events were defined by the expert. For each patient, a single prolonged event was selected. In case of patients with several such events, we chose the longest with a clear electrical spatial propagation pattern.
The EPI images were motion corrected by linear six‐parameter rigid‐body transformations (three translations and three rotations) and smoothed (6‐mm full width at half maximum) using the software package from the Brain Imaging Center of the Montreal Neurological Institute (http://www.bic.mni.mcgill.ca/software/). Temporal autocorrelations were accounted for by fitting a first‐order autoregressive model according to the method of Worsley et al. [ 2002], and low‐frequency drifts in the signal were modeled with a third‐order polynomial fitted to each run. As residual motion artefacts may still contaminate the fMRI data even after motion correction [Friston et al., 1996], the six parameters used for realignment were integrated in the analysis as confound regressors.
Analysis of the Time Course of BOLD Changes
Different regressors for each type of epileptiform events (excluding the selected prolonged discharge) were built using the timing and the duration of each event and convolved with the standard hemodynamic response function [HRF, Glover, 1999]. These regressors were considered as confounds. For the selected ictal discharge, a basis set was created from successive gamma function regressors of full‐width at half‐maximum of 2 s peaking from minus 9 s before the EEG discharge onset to 10 s after the end of the expected end of the hemodynamic response of the discharge (timing at the end of the EEG discharge + 5.4 s (HRF) + 10 s) (Fig. 1).
Figure 1.
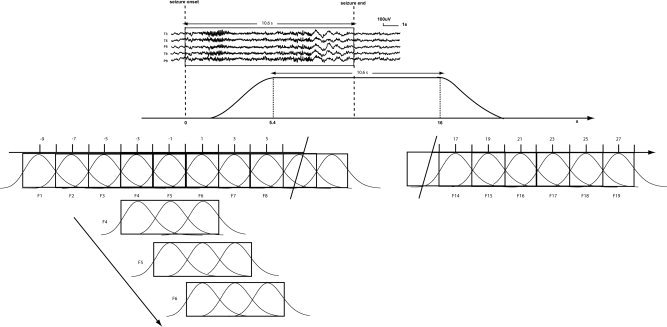
Sliding windows analysis of the ictal discharge. On the scalp EEG, an expert indicated seizure onset and end. The peak of the expected hemodynamic response related to the seizure starts 5.4 s after the onset and finishes 5.4 s after the end of the discharge. Successive gamma function regressors having a full‐width at half‐maximum of 2 s and separated by 2 s were used as separate regressors from −9 s before the discharge onset until 10 s after the end of the expected hemodynamic effect of the electrical discharge (this end takes place 5.4 s after the end of the electrical discharge). The number of regressors applied in the general linear model analysis therefore depended on the duration of each seizure. All these regressors were merged in the same general linear model analysis (regressors for interictal events, motion, and drift were also included as confounds). Successive F‐tests were applied on t‐value results obtained for three consecutive 2 s models. Each F‐test reflected results in a 6‐s window. These windows overlapped by 4 s, providing a F‐value every 2 s. The number of F‐tests depended on the number of regressors used. The statistical threshold was corrected for the number of voxels and for the number of F‐tests used for each patient.
All these regressors were considered in the same general linear model. We performed a multiple regression analysis on the 6‐min run including the selected discharge. Separate analysis of the statistical significance of each individual 2 s regressor may not reveal interesting results because of a low‐signal‐to‐noise ratio. We thus applied successive F‐tests on groups of three consecutive regressors (windows of 6 s) with 4 s of overlap between windows (Fig. 1). This resulted in F‐maps every 2 s. For each patient, the maps were thresholded at P < 0.001 (uncorrected), and a spatial extent threshold on the activated clusters was then applied to obtain P < 0.05, corrected for the multiple comparisons resulting from the number of voxels in the brain (using random field theory, [Friston et al., 1994]) and the use of multiple intervals for the F‐tests (Bonferroni correction). These thresholds were different for each patient since the number of F‐maps depended on the duration of each seizure. Threshold values are in Table II. For each voxel, the direction of the BOLD change was defined as the sign of the average effect of the three regressors included in the F‐test (positive for activation, negative for deactivation). We therefore obtained for each patient the time course of BOLD changes every 2 s before, during and after the ictal period.
The F‐map results were represented using the following scale: red–yellow scale corresponding to positive BOLD changes (activations) and blue–white scale to negative BOLD changes (deactivations). The F‐maps were labeled with the peak time of the central basis regressor of the three included in the F‐test.
We calculated for each 6 s F‐map window the volume of activation and deactivation (number of voxels with a significant F‐value) inside a brain mask automatically generated from the anatomical MRI of each patient [Smith, 2002].
To compare the durations of BOLD signal changes with EEG discharge durations and the timing of the first activation with the timing of the first deactivation, we used a paired samples t‐test with a significance threshold of P < 0.05.
RESULTS
BOLD and EEG Time Courses
For each ictal event, we obtained BOLD responses (activation and deactivation). On average these BOLD changes started 5.2 ± 2.6 s after the onset of the EEG discharge. Given the delay of 5.4 s due to the HRF, BOLD signal changes therefore started in correspondence with EEG discharge onset. BOLD activity returned to baseline 28.8 ± 12.9 s after EEG onset, for a mean BOLD discharge duration of 19.4 ± 14 s (the expected end of hemodynamic response related to the discharge was 24.8 ± 14 s). BOLD signal changes persisted after the end of the EEG discharge in two cases (4 and 9). But in general durations of EEG discharges and BOLD signal changes were highly correlated (r = 0.99, P < 0.0001).
Every 2 s, the volumes of activation and deactivation (number of voxels with a significant F‐value) in cerebral structures were measured. These volumes changed with a bell‐shape curve in most of the patients (less clear for 4 and 10) (Fig. 2). From the baseline, the volume increased gradually until a maximum and decreased to the previous baseline. The variation of volume involved activated and deactivated voxels.
Figure 2.
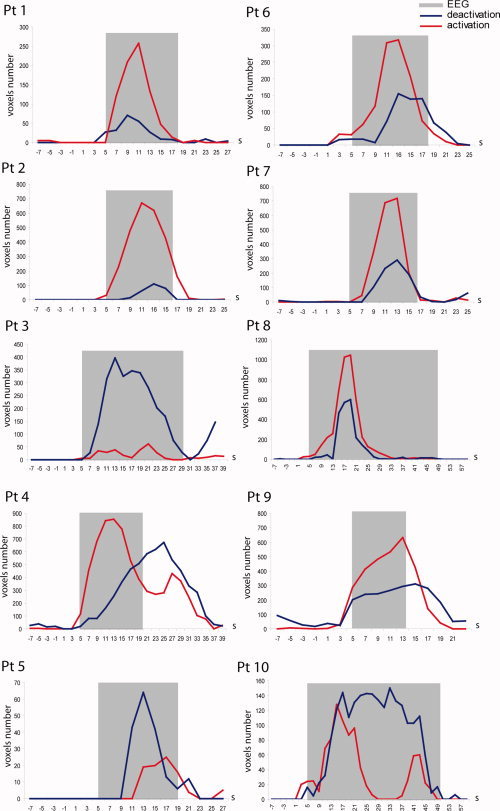
Time course of the cerebral volume involved in BOLD changes. The total number of voxels located in the brain involved either in activation (red line) or deactivation (blue line) is measured during and around the epileptiform ictal discharge. The duration and timing of the hemodynamic response expected from the ictal EEG event appears in gray (the time and duration of the electrical changes were convolved with the standard HRF). The vertical scale is different for each patient to facilitate visual analysis.
First Activation Location: The Seizure Onset Zone?
We studied the location where the first significant BOLD activation [(activation obtained in the first F‐map showing significant positive BOLD changes (corrected P value)] was observed in each patient. We believed that this structure could define the seizure onset zone. To validate this hypothesis, we examined different features of this zone: its spatial extent, its concordance with the clinical data available for each patient, and the duration of its activity.
Spatial extent
For each patient, we obtained a limited extent of the first activation: it involved more than one region in three (examples in Figs. 3 and 4) and was very focal (localized to a single brain area) in 7 of 10 patients (examples in Figs. 5 and 7). A bilateral activation was obtained in the two patients with double cortex (4 and 5) (Fig. 3), and bifrontal activation was observed in patient 1 with a normal MRI (Fig. 4). On average, the extent of the first activation area was 38.6 ± 51.7 voxels (Table III). Excluding two patients (1 and 4) with respectively 119 and 150 voxels activated, the other eight patients presented 14.6 ± 9.5 activated voxels in the first activation area. For these two patients, a subthreshold analysis described below (same section: duration) yielded a presumed seizure onset volume of 14 and 15 activated voxels, respectively. Fifteen voxels represent a little less than 2 cm3.
Figure 3.
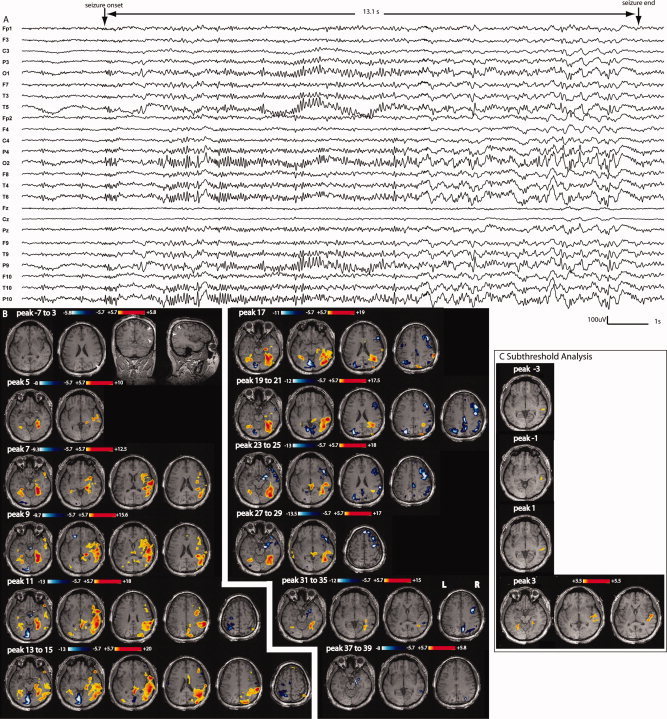
Patient 4: A: Electrical seizure lasting 13.1 s recorded during EEG‐fMRI test. Right temporo‐parietal and occipital discharges propagating to the left homologous regions observed in a referencial montage (reference FCz). B: F‐maps obtained on 6‐s windows data every 2 s. No response between −7 and 3 s; this line is used to show the anatomical MRI and bilateral band heterotopia predominating over parietal, occipital and temporal areas, maximum on the right side (white arrow heads). First significant activation (yellow–red scale) starts at peak 5 with a bilateral involvement of the cortex surrounding the heterotopic band. There is a late involvement of the lesion (starting at peaks 11–13 only). Deactivation (white–blue scale) appears mostly in the second part of the seizure, at first around the first activation area and later around the propagated activation areas (maximum on the right side, as the activation). C: After lowering the statistical threshold to 3.5, successive F‐maps preceding the first significant activation map (peak 5) showed new activation located in a similar area as the first significant activation. From peak −3 to peak 1, the activation was unilateral and more focal over the right temporal region.
Figure 4.
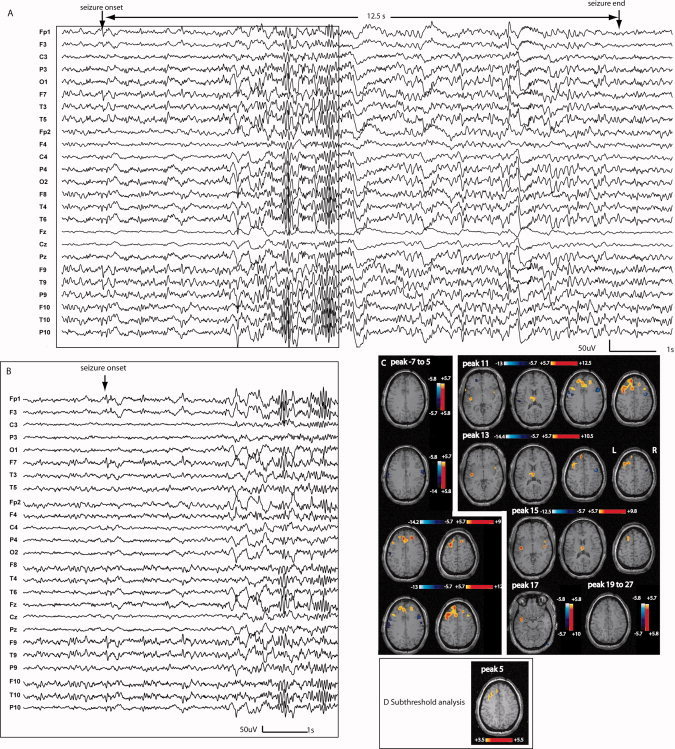
Patient 1: A: Electrical seizure recording lasting 12.5 s during EEG‐fMRI test. The ictal discharge started with left fronto‐temporal spiking activity observed in a referential montage (reference FCz) (left frontotemporal predominance more visible on average reference montage in B). C: The first significant activation started at peak 7 with early bifrontal involvement but left predominance. A secondary involvement of the thalami was observed (peaks 11, 13, and 15). The deactivation was located mostly near the onset area and the areas of propagation. D: After lowering the statistical threshold to 3.5, successive F‐maps preceding the first significant activation map (peak 7) showed activation located in a similar area as the first significant activation. However, this early activation was much more focal over the left superior frontal gyrus and did not spread to the right.
Figure 5.
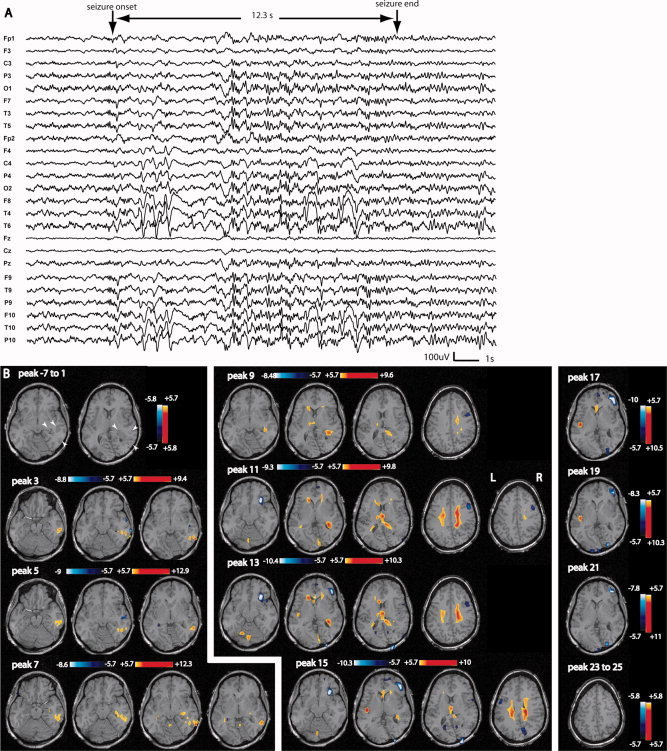
Patient 6: A: Electrical seizure lasting 12.3 s recorded during EEG‐fMRI test. In a referential montage (reference FCz), the seizure started with a rhythmic spike and slow wave discharge over the right posterior quadrant followed by a short attenuation and bilateral spiking activity with a clear right predominance (persistence of slow waves on the right side). B: No response between −7 and 1 s; anatomical MRI shows gray matter heterotopia combined with an abnormal overlying cortical gyration visible in the right posterior quadrant (white arrowheads). The first significant activation started at peak 3 in a very focally in the lesion. The propagation of the activation was first focal and then bilateral with an involvement of the thalamus at peak 9. The deactivation was seen in areas close to and distant from the activated regions. In the map preceding peak 3 (first significant activation), no activation could be obtained in the first defined focus by lowering the statistical threshold.
Figure 7.
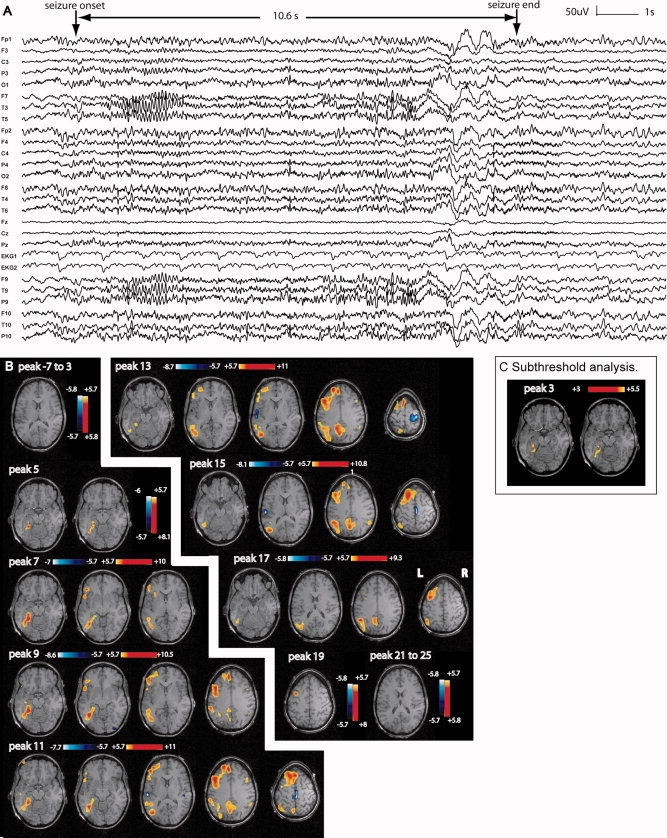
Patient 2: A: Electrical seizure lasting 10.6 s recorded during EEG–fMRI test. In a referential montage (reference FCz), the seizure started with left temporal sharp waves followed by a clear 11–12 Hz discharge also over the left temporal area. A decrease in frequency with left fronto‐temporal slow waves was seen at the end of the seizure. B: The first significant activation started at peak 5 very focally in the left posterior hippocampus and parahippocampal gyrus. The propagation of the activation was first and mainly homolateral, with later minimal bilateral involvement of the anterior and posterior cingulate areas at peak 11. A deactivation was seen late and distant from the focus. C: After lowering the statistical threshold to three, successive F‐maps preceding the first significant activation map (peak 5) showed new activation located in a similar area as the first significant activation.
Table III.
BOLD changes time course and location of first significant activation
| Pts | Expected focus location | Activation | Deactivation | ||||
|---|---|---|---|---|---|---|---|
| Volume of first activation (number of voxels) | Start (s) | End (s) | First activation location | Start (s) | End (s) | ||
| 1 | Bil F with L predominance | 119 | 7 | 17 | Bil F sup gyrus, ant. cingulate area. | 5 | 17 |
| 2 | L mesial T | 18 | 5 | 19 | L post hippocampus and parahippocampus gyrus | 9 | 15 |
| 3 | R TPO | 6 | 7 | 27 | R O | 7 | 31 |
| 4 | R TPO with fast contralateral propagation | 150 | 5 | 37 | R hippocampus, R and L collateral sulcus, R T pole, R sup T gyrus | 9 | 41 |
| 5 | Bil O | 10 | 13 | 21 | L O (in the heterotopic cortex) and post T | 11 | 21 |
| 6 | R TP, in the lesion | 34 | 3 | 21 | R TPO (in the lesion) | 3 | 23 |
| 7 | R F | 9 | 7 | 15 | R F (in the suspected lesion) | 9 | 17 |
| 8 | R FC, around the lesion | 5 | 3 | 45 | R precuneus at the bottom of the metastasis | 7 | 49 |
| 9 | R FC, around the lesion | 18 | 3 | 19 | R FT, around the lesion | 5 | 21 |
| 10 | FT (side hard to define, R hemisphere involved early in the seizure process) | 17 | 3 | 47 | R post. T | 9 | 49 |
| Mean ± SD | 38.6 ± 51.7 | 5.6 ± 3.1 | 26.8 ± 11.9 | 7.4 ± 2.4 | 28.3 ± 13.3 | ||
The start and end times represent the time of the F‐map; for instance, a start time at 5 s represents a BOLD change occurring at the same time as the EEG onset, given the 5.4 s hemodynamic delay.
R, right; L, left; Bil, bilateral; T, temporal; F, frontal; C, central; P, parietal; O, occipital.
Concordance with clinical data
A neurologist expert in epilepsy provided the estimated focus location based on a standard evaluation, including seizure semiology, anatomical MRI, interictal and ictal scalp EEG, and intracranial EEG if available (Tables I and II). We compared this estimated focus location and the location of the first significant BOLD activation in each patient (Table III). We declared concordance when measures were located in the same side and the same lobe. In nine cases (all patients except patient 10), the location of the first activation was concordant with the estimated focus location. Clinical and electrophysiological data provided for patient 10 did not allow us to reach a clear conclusion concerning focus location. The left hemisphere atrophy and the initial right body weakness suggested a seizure generation in the left hemisphere. However, the clinical signs during recent seizures involved the left side and scalp EEG abnormalities predominated in the right frontotemporal areas during ictal and interictal events. A right hemisphere involvement (focus or only propagation) therefore appears to be clear at present. Our EEG‐fMRI results did not contradict these observations. In two cases (4 and 5), the focus location was concordant with the clinical and electrophysiological data but was outside the lesion observed on anatomical MRI.
Three patients (6, 7, and 10) underwent intracranial study in the context of a presurgical exploration (6 and 10) or during surgery (7). In patient 6 (Figs. 5 and 6), the contacts of the depth electrodes aiming at the malformation of cortical development in the right parieto‐temporo‐occipital region recorded the seizure onset. The first activation was located in the malformation (right parieto‐temporo‐occipital region) and corroborates the intracranial results for the focus location. In patient 7, peroperative ECoG recording from the right mesial frontal and frontopolar area showed sustained spiking discharges overlying an abnormal gyrus defined as dysplastic after the surgery. This area coincided with the first activation location. Concerning patient 10, the cortical recording done with four strips of six contacts placed over the left frontotemporal convexity was unable to distinguish a clear focus: the epileptiform activity was recorded at the same time at different locations, being diffuse at onset. Technical problems with two of four strips made also the interpretation difficult. Moreover, seizure semiology recorded during the intracranial study provided arguments for right epileptic activity during the seizure. The first BOLD activation was seen in the right hemisphere and did not contradict these findings. This patient had a meningoencephalitis during early childhood, which may have injured both hemispheres but with a more severe left side gray matter damage and atrophy that may reduce the likelihood of seizure generation. In conclusion, our EEG‐fMRI results are in excellent agreement with the intracranial studies of two patients and do not contradict the uncertain third study.
Figure 6.
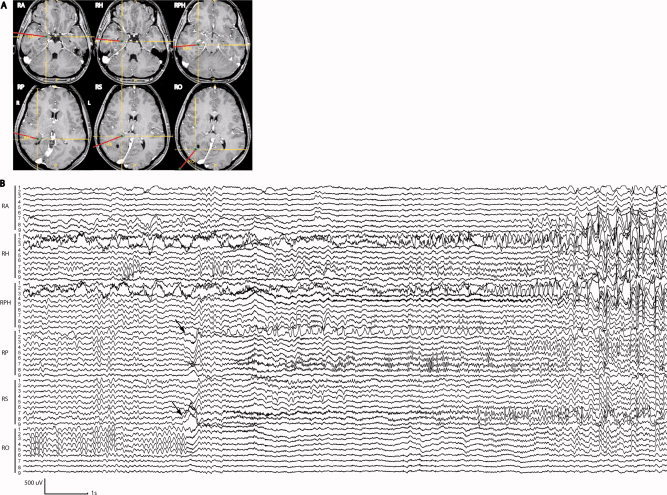
Patient 6: Intracranial EEG recording. A: Electrode positions (axial T1): the thin lines indicate the target of the deepest electrode contacts and the thick lines, the electrode positions. The malformation of cortical development was explored with electrodes RPH, RP, RS and RO, and the amygdala and hippocampus with RA and RH. The R and L sides are reversed on the MR images compared to the fMRI maps. B: Example of a clinical seizure with a relatively diffuse onset (attenuation of background activity overriding a large slow wave) observed simultaneously at electrodes RP and RS and in the deepest contacts of RO (arrows). A rhythmic discharge of sharp waves was then observed in RP1 with a diffuse fast activity at electrodes RPH, RP, RS, and RO. The hippocampus is involved later. During the seizure, the patient reported luminosity changes and appearance of colors. RA, right amygdala; RH, right hippocampus; RPH, right posterior hippocampus; RP, right posterior temporal; RS, right inferior parietal; RO, right occipital. [Color figure can be viewed in the online issue, which is available at www.interscience.wiley.com.]
Duration
To estimate the duration of the activation in the focus, we calculated the number of successive F‐maps where a significant activation remained at the location of the first significant activation. On average, the structure involved in the first activation continued to be active in 6.5 consecutive F‐tests (range, 2–15), corresponding to 13 s. Given our method of a 6‐s sliding window with 4 s overlap, the activation in the original focus has to be observed in at least four consecutive F‐tests to support the hypothesis of a sustained activity without redundancy. Two patients (3 and 5) did not fill those criteria with only two and three successive F‐tests with activation in the focus, respectively.
To extend the above analysis, we looked at the location of the maximum F value (activation) in the F‐map preceding the one with the first significant activation. If this maximum F‐value was in the same area as the defined focus, we considered this subthreshold activation as valid, because the probability that this was by chance was very small: considering the large number of voxels mapping the brain (about 8,000), the activation observed in a similar small area in two nonoverlapping windows is very unlikely to be obtained only by chance: if the first significant activation (e.g., in peak 1) is made of a cluster of 10 voxels, the probability that the peak voxel of the preceding nonoverlapping window (peak −5) belongs to this cluster by chance is 10/8,000 = 0.001). This analysis was performed in nine of the 10 patients, patient 10 was excluded because of the confounding effect of the hemodynamic response of the interictal event occurring before the ictal discharge. Seven of these nine patients had, in the preceding F‐maps, a peak F‐value in the focus defined by the first significant activation (patients 1–5, 8, and 9; mean 1.5 F‐maps; range, 1–4, corresponding to 3 s; examples on Figs. 3, 4, 5, 3, 4, 5). Including this subthreshold activation, the activity in the defined focus could be followed in 7.9 consecutive F‐maps on average (range, 3–19), corresponding to 15.8 s. Patient 3 was finally the only one to fail the criterion of four consecutive activations in the same region, as defined earlier.
In two cases (4 and 9), the maximum activation was consistent in four F‐maps before de first significant activation F‐map. Activation in the focus could be observed at −5 s for patient 4 and at −3 s for patient 9. BOLD changes could thus be observed before the EEG onset in these two cases. The duration of BOLD changes was longer than the EEG seizure in one case (4) (Fig. 3): while the BOLD changes started at the beginning of the expected hemodynamic seizure onset, it persisted 20 s after the end of the expected hemodynamic effect of the EEG discharge.
Propagation Pathways
We evaluated structures activated during the ictal discharge propagation. Propagated activation was observed immediately after the first significant activation F‐test. Two patterns of propagation could be distinguished (Figs. 3, 4, 5, 3, 4, 5 and 7): (1) local and homolateral; (2) contralateral (bilateralization). Only patient 10 presented a secondary multifocal activation, which did not correspond to an extension of the primary focus. The other patients showed local extension of the primary activation and contralateral activation. Concomitant with the contralateral extension of the activation, we observed activation of midline structures such as the thalami (5 of 9), anterior (3 of 9), and posterior cingulate area (2 of 9) (Figs. 4, 5, and 7 as examples). The thalami were usually involved late in the seizure time course (mean, 9.8 ± 3.6 s).
Deactivation: Spatio‐Temporal Evolution During the Seizure
For each patient, we observed a negative BOLD response at some point during the seizure. In eight patients, the activation was the dominant response and on average occurred earlier (4.5 ± 1.8 s) than the deactivation (7 ± 2.4 s) (P = 0.028). The other two patients (3 and 5) presented a different pattern: the deactivation was much more prominent than the activation. The deactivation was sometimes located close to the activation and sometimes distant from it.
DISCUSSION
We propose a noninvasive method using a sliding window analysis, which provides a measure in the whole brain of the hemodynamic and metabolic changes occurring throughout a seizure with high‐spatiotemporal resolution. We showed in patients with focal epilepsy that the BOLD signal was strongly correlated with the time course and the spatial extent of the ictal EEG. Also, by analyzing the time course of BOLD changes, the seizure onset could be separated from propagated activity. We demonstrated that the first activation was likely to reflect the region of seizure onset; its extent was limited and did not involve a complex network, such as that observed during propagation. This analysis revealed ictal activity in deep and small structures, and the spatio‐temporal evolution of deactivation during the seizure.
An important goal of research in the epilepsy field is to find a noninvasive method that can define precisely with high‐spatiotemporal resolution the seizure onset zone and the epileptic network. Current methods such as EEG, high‐resolution EEG with source localization, ictal SPECT, and SISCOM (Subtraction Ictal SPECT Coregistred MRI) provide partial solutions. Intracranial EEG (iEEG) remains the gold standard for seizure onset zone location in patients with intractable focal epilepsy who are candidate for surgery. This method has a fundamental and serious limitation: it allows recording only from a small fraction of the total brain volume; each electrode records from its immediate vicinity and recording from a large fraction of the brain would require a large number of electrodes and be excessively invasive. It is therefore impossible to say whether a seizure appearing at some electrode contacts actually originates near these contacts or in fact originates at a distance, in a region without electrodes, and then propagates to the recording contacts. This is because it is not possible, by examination of an epileptic discharge in the EEG, to know with certainty if it represents the seizure onset or propagated activity [Sperling, 1997]. This uncertainty and limited spatial sampling are at the root of our lack of knowledge of the extent of the seizure generating region and may be the cause of some failures of surgical treatment. For the same reason, the iEEG is limited in its ability to follow the propagation of epileptic seizures. This does not imply that iEEG is not clinically useful, but that it has limitations [Engel et al., 1990; Sperling, 1997]. EEG‐fMRI has been used in several ictal studies [Di Bonaventura et al., 2006a, b; Federico et al., 2005; Kobayashi et al., 2006a; Salek‐Haddadi et al., 2002, 2003; Tyvaert et al., 2008]. Contrary to interictal epileptiform events [Gotman et al., 2006, 2008; Lemieux, 2004], single ictal discharges can be analyzed due to the large BOLD changes present during each seizure [Auer et al., 2008], providing a high‐signal‐to‐noise ratio (SNR). Seizures were until now analyzed with a bloc‐design, assuming a stable hemodynamic response for the entire discharge and thus not accounting for its nonstationary and evolutionary nature. Results therefore mixed activity related to seizure onset and propagation. In this article, we propose a method to study the BOLD response during ictal events with a time resolution of 2 s and a spatial resolution of 5 mm. This method was validated on 10 patients who experienced seizures inside the MRI.
To validate our method, we demonstrated that the BOLD time course reflected directly ictal activity. First, the timing of the BOLD signal reflected the EEG discharge, taking into account the delayed hemodynamic response occurring after a neuronal discharge. Also, the volume of BOLD signal changes during the seizure followed a bell‐shape curve and the typical spatial propagation pattern of epileptic discharges [Götz‐Trabert et al., 2008; Pinto et al., 2005; Verma and Radtke, 2006]. We could separate the first significant activation from propagated activation. The first activation was likely to be located in the focus, the brain structure responsible for seizure generation. At present, there is no perfect way to define the true seizure onset location. IEEG recording is the most accurate method for focus localization [Engel et al., 1990] with the limitations mentioned earlier.
To confirm that the earliest activation is the “true” focus, we combined different criteria: (1) Spatial extent of the first activation: the seizure onset zone should be spatially limited compared to the entire epileptic zone [Pinto et al., 2005; Verma and Radtke, 2006]; (2) Concordance of the location of the first activation with what is known of each patient's epilepsy; and (3) Duration of the activation inside the focus, which should remain activate during the seizure [Ebersole and Pacia, 1996]. For each patient, the first activation area had a limited spatial extent, although in three patients it involved more than one region: in two (4 and 5), the bilateral activation was explained by bilateral band heterotopia (“double cortex”) and bilateral epileptic generator, and in the third (1), the bifrontal activation with a left‐sided predominance suggested a left frontal primary focus with fast contralateral propagation as often seen in frontal lobe epilepsy. This was strengthened by the subthreshold analysis, which provided a focal onset zone (one region) in two of these last three patients (1, 4, and 5). Furthermore, in all patients, the first significant activation was more localized than the subsequent activation, thus implying propagation. The first significant activation was largely located in the area of the expected focus defined by the expert. We can argue that this definition is uncertain in some cases without intracranial recording or surgical outcome. However, as currently in epilepsy, we defined the best fitting location with the only information available (clinical data, interictal and ictal EEG, and anatomical MRI) and based on expert knowledge. For patients 4 and 5, the activation involved the normotopic cortex overlying the band of heterotopic cortex. There is no evidence that the heterotopic cortex can generate ictal activity responsible for scalp EEG discharges and clinical signs [Bernasconi et al., 2001; Mai et al., 2003], but the isolated overlying cortex appears sufficient to generate seizures [Chen et al., 2000; Schottler et al., 1998]. Our results strengthen this hypothesis. In three patients, our findings largely agreed with the intracranial evaluation, showing similar locations of the focus. Finally, we generally observed a sustained activity in the focus, corroborating EEG observations of ictal activity from onset and throughout the ictal discharge [Ebersole and Pacia, 1996]. This was not the case for patients 3 and 5, who presented a different pattern of BOLD time course, with a nonevolutionary focal activation and a large deactivation. They both had occipital lobe epilepsy with diffuse slow waves dominating the ictal EEG signal. In these two cases, predominance of the deactivation may be explained by the particular EEG slow waves pattern. The meaning of deactivation is still not understood, but in some cases it has been associated with EEG slow waves and usually with decreased brain activity [Czisch et al., 2004; Kobayashi et al., 2006b]. Considering all these results, we conclude that the first activation was in agreement with what we knew of the focus.
There is currently a debate about the anatomical and functional organization of the seizure onset zone. In contrast to the traditional concept of a spatially restricted seizure focus, a new concept of an extended neuronal network responsible for seizure generation has been proposed [Bartolomei et al., 2008; Nair et al., 2004]. This hypothesis was supported in part by more than occasional poor outcomes after surgical resection of the presumed focal onset zone and by the simultaneous involvement of different structures at the beginning of seizures observed in intracranial EEG. Current exploration methods with incomplete spatial sampling do not allow a resolution of this dilemma. Using our method, we could identify from the whole brain for each patient a small cortical area activated at seizure onset. This newly defined seizure onset zone was always compact and limited in volume. No specific neuronal network combining different cortical areas could be distinguished at the beginning. We suggest that a single structure is sufficient to start the seizure process. However, the concept of epileptic network was verified during propagation. The volume of activated voxels increased with involvement of surrounded cortical area or even distant and contralateral cortical regions. Different patterns of propagation were distinguished. Local or contralateral cortical regions were secondarily involved. Interestingly, the thalami were most of the time also involved but only late, after local cortical propagation. Involvement of the thalami could reflect the involvement of a cortico‐thalamo‐cortical pathway in the propagation of the seizure in contrast with cortico‐cortical pathway. Contralateral propagation was seen with anterior or posterior cingulate or thalami activation, emphasizing the role of these midline structures in propagation. The involvement of the thalamic structures was assessed in the propagation of temporal lobe seizures using iEEG [Guye et al., 2006; Rosenberg et al., 2006]. We extended this finding to different types and to nontemporal seizures (where thalamic iEEG is not justified in the context of presurgical exploration). Further EEG‐fMRI studies should be performed in different types of seizure with more patients to better delineate thalamic involvement. Finally, the seizure onset zone in association with secondarily activated areas could define this so‐called epileptic network. Its definition remains crucial to better understand seizure propagation and semiology and to estimate the extent of regions exposed to a possible kindling process.
This technique can provide information about the epileptic network, but the meaning of all BOLD changes, especially those located in distant areas is not clear yet. This technique explores hemodynamic and metabolic changes that occur specifically during the ictal EEG discharge. However, these changes could be related directly to the electrical discharge or related to global brain activity changes (attention and consciousness fluctuation, for example). At this time, we cannot discriminate these two possibilities. Some of the distant areas are clearly involved in the ictal discharge, because they are part of well‐defined epileptic networks. The involvement of the others has still an unclear meaning. However, deactivation more than activation seems correlated with reduced brain activity such as decreased attention [Schridde et al., 2008]. This has been observed during generalized epileptic discharges [Gotman et al., 2005].
The proposed method provides information about ictal activity that is not accessible with other explorations. First, we observed the seizure time course not only at the electrical level but also at the hemodynamic and metabolic levels. There were expected differences between the scalp EEG, which records activity from superficial and large cortical areas [Tao et al., 2007] and the BOLD signal reflecting hemodynamic and metabolic changes in the whole brain. Moreover, the order of occurrence and the exact relationship between the electrical and BOLD changes during the neuronal activity at the seizure onset are not known. BOLD changes could occur before the onset or after the end of the scalp EEG discharge. These BOLD changes however are susceptible to be invisible with the usual statistical threshold considering their low SNR. The activity related with the early seizure onset is characterized by a lower activity (electrical, hemodynamic, and metabolic changes) in accordance with the relative smaller number of neurons implicated in the process compared to the rest of the seizure firing in a larger brain area. We used an exploratory approach to observe the earliest BOLD increase with a lower statistical threshold than used in the standard analysis. The reliability of the activation observed with this new threshold is supported by its reproducibility in consecutive F‐maps. We choose to lower the threshold but another way to correct the SNR issue would be to perform a study on several seizures. This allowed us to observe an early onset, preceding the electrical onset. In two cases (4 and 9), BOLD changes appeared in a small region before the electrical discharge. This result agrees with the hypothesis that metabolic changes may precede visible electrical changes [Baumgartner et al., 1998; Zhao et al., 2007]. Structures involved in the seizure onset may be small or deep and thus not visible on scalp EEG or the metabolic and hemodynamic changes are the first event in the seizure process. Further studies should be conducted to explore these hypotheses. In one case (4), BOLD changes persisted 20 s after the electrical discharge (Figs. 2 and 3). According to our BOLD changes map, it is interesting to notice that during this last period (with no EEG changes), BOLD changes did not include superficial cortex any longer. Only deep structures were involved and especially the heterotopic part of the double cortex. This is a good example of the potential interest of EEG‐fMRI study in epilepsy, the EEG being blind to some deep ictal or interictal activities. The analysis of BOLD changes provides complementary information to the EEG to understand the generation and propagation processes.
Second, deactivations were demonstrated dynamically during seizures. Deactivation was reported in the surrounding of and at distance from the focus during interictal [Kobayashi et al., 2006b] and ictal studies [Kobayashi et al., 2006a; Tyvaert et al., 2008]. In our study, deactivations occurred after the first activation in close and distant areas from the regions activated at the onset and during propagation. This could imply that deactivation occurs secondarily to activation. For patients 3 and 5 who presented an early and large deactivation compared to activation, the spatial extent still remained around the activation zone. Deactivations could correspond to actively inhibited regions [Chatton et al., 2003; Stefanovic et al., 2004] or to regions having reduced activity as a result of functional disconnection from normally active regions [Logothetis, 2003; Schridde et al., 2008], and possibly explain negative seizure symptoms.
This method is limited to patients with relatively frequent seizures, either electrical or clinical with limited motion. Most of our patients presented in the scanner electrical or small clinical seizures. Recent publications emphasize the interest of these minimal seizures to localize the seizure onset zone [Sperling and O'Connor, 1990; Zangaladze et al., 2008]. They showed that subclinical seizures probably share the same source as clinical seizures [Sperling and O'Connor, 1990; Zangaladze et al., 2008] and that differences between subclinical and clinical seizures may only relate to the spatial extent of the discharge [Babb et al., 1987; Wennberg and Lozano, 2002]. In EEG‐fMRI, the difference between the two types of seizures would affect mostly the extent of BOLD changes involved in the propagation process. To confirm this hypothesis, a comparative EEG‐fMRI study of subclinical and clinical seizures from each patient would have to be done.
This study showed results concerning a single seizure per patient. The reproducibility was not evaluated. BOLD changes related to several seizures obtained for each patient should be compared to address this question. However, EEG seizure discharges are never identical in terms of duration, spatial extent, and frequency components. Further studies should be conducted to explore the reproducibility of this technique and the impact on BOLD changes of the spatial and frequency fluctuations of the electrical discharge.
Because fMRI measures hemodynamic and metabolic changes reflecting neuronal activity simultaneously in the whole brain, small, deep, or superficial sources can be equally detected when electrical changes are seen on the surface. This might allow defining precisely the timing and location of the seizure onset. Analyzing the ictal BOLD signal time course might enhance our understanding of seizure generation and propagation. This new method, free from the limitations of intracerebral EEG (invasiveness and limited spatial sampling) could open the study of seizure generation and propagation mechanisms to groups of patients with focal or generalized epilepsies.
Acknowledgements
We are grateful to Dr Nguyen Dang (Notre Dame Hospital, Montreal) for his help with patient recruitment and for providing useful clinical information.
REFERENCES
- Allen PJ, Josephs O, Turner R ( 2000): A method for removing imaging artifact from continuous EEG recorded during functional MRI. Neuroimage 2: 230–239. [DOI] [PubMed] [Google Scholar]
- Auer T, Veto K, Dóczi T, Komoly S, Juhos V, Janszky J, Schwarcz A ( 2008): Identifying seizure‐onset zone and visualizing seizure spread by fMRI: A case report. Epileptic Disord 10: 93–100. [DOI] [PubMed] [Google Scholar]
- Asano E, Juhász C, Shah A, Muzik O, Chugani DC, Shah J, Sood S, Chugani HT ( 2005): Origin and propagation of epileptic spasms delineated on electrocorticography. Epilepsia 46: 1086–1097. [DOI] [PMC free article] [PubMed] [Google Scholar]
- Babb TL, Wilson CL, Isokawa‐Akesson M ( 1987): Firing patterns of human limbic neurons during stereoencephalography (SEEG) and clinical temporal lobe seizures. Electroencephalogr Clin Neurophysiol 66: 467–482. [DOI] [PubMed] [Google Scholar]
- Bartolomei F, Wendling F, Chauvel P ( 2008): [The concept of an epileptogenic network in human partial epilepsies]. Neurochirurgie 54: 174–184. [DOI] [PubMed] [Google Scholar]
- Baumgartner C, Serles W, Leutmezer F, Pataraia E, Aull S, Czech T, Pietrzyk U, Relic A, Podreka I ( 1998): Preictal SPECT in temporal lobe epilepsy: Regional cerebral blood flow is increased prior to electroencephalography‐seizure onset. J Nucl Med 39: 978–982. [PubMed] [Google Scholar]
- Bénar C, Aghakhani Y, Wang Y, Izenberg A, Al‐Asmi A, Dubeau F, Gotman J ( 2008): Quality of EEG in simultaneous EEG‐fMRI for epilepsy. Clin Neurophysiol 114: 569–580. [DOI] [PubMed] [Google Scholar]
- Bernasconi A, Martinez V, Rosa‐Neto P, D'Agostino D, Bernasconi N, Berkovic S MacKay M, Harvey AS, Palmini A, da Costa JC, Paglioli E, Kim HI, Connolly M, Olivier A, Dubeau F, Andermann E, Guerrini R, Whisler W, de Toledo‐Morrell L, Morrell F, Andermann F ( 2001): Surgical resection for intractable epilepsy in “double cortex” syndrome yields inadequate results. Epilepsia 42: 1124–1129. [DOI] [PubMed] [Google Scholar]
- Chatton JY, Pellerin L, Magistretti PJ ( 2003): GABA uptake into astrocytes is not associated with significant metabolic cost: Implications for brain imaging of inhibitory transmission. Proc Natl Acad Sci USA 100: 12456–12461. [DOI] [PMC free article] [PubMed] [Google Scholar]
- Chen ZF, Schottler F, Bertram E, Gall CM, Anzivino MJ, Lee KS ( 2000): Distribution and initiation of seizure activity in a rat brain with subcortical band heterotopia. Epilepsia 41: 493–501. [DOI] [PubMed] [Google Scholar]
- Czisch M, Wehrle R, Kaufmann C, Wetter TC, Holsboer F, Pollmächer T, Auer DP ( 2004): Functional MRI during sleep: BOLD signal decreases and their electrophysiological correlates. Eur J Neurosci 20: 566–574. [DOI] [PubMed] [Google Scholar]
- Di Bonaventura C, Vaudano AE, Carnì M, Pantano P, Nucciarelli V, Garreffa G, Maraviglia B, Prencipe M, Bozzao L, Manfredi M, Giallonardo AT ( 2006a): EEG/fMRI study of ictal and interictal epileptic activity: Methodological issues and future perspectives in clinical practice. Epilepsia 47: 52–58. [DOI] [PubMed] [Google Scholar]
- Di Bonaventura C, Carnfi M, Vaudano AE, Pantano P, Garreffa G, Le Piane E, Maraviglia B, Bozzao L, Manfredi M, Prencipe M, Giallonardo AT ( 2006b): Ictal hemodynamic changes in late‐onset Rasmussen encephalitis. Ann Neurol 59: 432–433. [DOI] [PubMed] [Google Scholar]
- Ebersole JS and Pacia SV ( 1996): Localization of temporal lobe foci by ictal EEG patterns. Epilepsia 37: 386–399. [DOI] [PubMed] [Google Scholar]
- Engel J Jr, Henry TR, Risinger MW, Mazziotta JC, Sutherling WW, Levesque MF, Phelps ME ( 1990): Presurgical evaluation for partial epilepsy: Relative contributions of chronic depth‐electrode recordings versus FDG‐PET and scalp‐sphenoidal ictal EEG. Neurology 40: 1670–1677. [DOI] [PubMed] [Google Scholar]
- Federico P, Abbott DF, Briellmann RS, Harvey AS, Jackson GD ( 2005): Functional MRI of the pre‐ictal state. Brain 128: 1811–1817. [DOI] [PubMed] [Google Scholar]
- Friston KJ, Worsley KJ, Frackowiak RS, Mazziotta JC, Evans AC ( 1994): Assessing the significance of focal activations using their spatial extent. Hum Brain Mapp 1: 214–220. [DOI] [PubMed] [Google Scholar]
- Friston KJ, Williams S, Howard R, Frackowiak RS, Turner R ( 1996): Movement‐related effects in fMRI time‐series. Magn Reson Med 135: 346–355. [DOI] [PubMed] [Google Scholar]
- Glover GH ( 1999): Deconvolution of impulse response in event‐related BOLD fMRI. Neuroimage 9: 416–429. [DOI] [PubMed] [Google Scholar]
- Gotman J, Grova C, Bagshaw A, Kobayashi E, Aghakhani Y, Dubeau F ( 2005): Generalized epileptic discharges show thalamocortical activation and suspension of the default state of the brain. Proc Natl Acad Sci USA 18; 102: 15236–15240. [DOI] [PMC free article] [PubMed] [Google Scholar]
- Gotman J, Kobayashi E, Bagshaw AP, Bénar CG, Dubeau F ( 2006): Combining EEG and fMRI: A multimodal tool for epilepsy research. J Magn Reson Imaging 23: 906–920. [DOI] [PubMed] [Google Scholar]
- Gotman J ( 2008): Epileptic networks studied with EEG‐fMRI. Epilepsia 49 ( Suppl 3): 42–51. [DOI] [PMC free article] [PubMed] [Google Scholar]
- Götz‐Trabert K, Hauck C, Wagner K, Fauser S, Schulze‐Bonhage A ( 2008): Spread of ictal activity in focal epilepsy. Epilepsia 24. [DOI] [PubMed] [Google Scholar]
- Guye M, Régis J, Tamura M, Wendling F, McGonigal A, Chauvel P, Bartolomei F ( 2006): The role of corticothalamic coupling in human temporal lobe epilepsy. Brain 129: 1917–1928. [DOI] [PubMed] [Google Scholar]
- Kobayashi E, Hawco CS, Grova C, Dubeau F, Gotman J ( 2006a): Widespread and intense BOLD changes during brief focal electrographic seizures. Neurology 66: 1049–1055. [DOI] [PubMed] [Google Scholar]
- Kobayashi E, Bagshaw AP, Grova C, Dubeau F, Gotman J ( 2006b): Negative BOLD responses to epileptic spikes. Hum Brain Mapp 27: 488–497. [DOI] [PMC free article] [PubMed] [Google Scholar]
- Lemieux L ( 2004): Electroencephalography‐correlated functional MR imaging studies of epileptic activity. Neuroimaging Clin N Am 14: 487–506. [DOI] [PubMed] [Google Scholar]
- Logothetis NK ( 2003): The underpinnings of the BOLD functional magnetic resonance imaging signal. J Neurosci 3: 3963–3971. [DOI] [PMC free article] [PubMed] [Google Scholar]
- Logothetis NK ( 2008): What we can do and what we cannot do with fMRI. Nature 453: 869–878. [DOI] [PubMed] [Google Scholar]
- Mai R, Tassi L, Cossu M, Francione S, Lo Russo G, Garbelli R, Ferrario A, Galli C, Taroni F, Citterio A, Spreafico R ( 2003): A neuropathological, stereo‐EEG, and MRI study of subcortical band heterotopia. Neurology 60: 1834–1838. [DOI] [PubMed] [Google Scholar]
- Nair DR, Mohamed A, Burgess R, Lüders H ( 2004): A critical review of the different conceptual hypotheses framing human focal epilepsy. Epileptic Disord 6: 77–83. [PubMed] [Google Scholar]
- Pinto DJ, Patrick SL, Huang WC, Connors BW ( 2005): Initiation, propagation, and termination of epileptiform activity in rodent neocortex in vitro involve distinct mechanisms. J Neurosci 25: 8131–8140. [DOI] [PMC free article] [PubMed] [Google Scholar]
- Rosenberg DS, Mauguière F, Demarquay G, Ryvlin P, Isnard J, Fischer C, Guénot M, Magnin M ( 2006): Involvement of medial pulvinar thalamic nucleus in human temporal lobe seizures. Epilepsia 47: 98–107. [DOI] [PubMed] [Google Scholar]
- Salek‐Haddadi A, Merschhemke M, Lemieux L, Fish DR ( 2002): Simultaneous EEG‐Correlated Ictal fMRI. Neuroimage 16: 32–40. [DOI] [PubMed] [Google Scholar]
- Salek‐Haddadi A, Lemieux L, Merschhemke M, Friston KJ, Duncan JS, Fish DR ( 2003): Functional magnetic resonance imaging of human absence seizures. Ann Neurol 53: 663–667. [DOI] [PubMed] [Google Scholar]
- Schottler F, Couture D, Rao A, Kahn H, Lee KS ( 1998): Subcortical connections of normotopic and heterotopic neurons in sensory and motor cortices of the tish mutant rat. J Comp Neurol 395: 29–42. [PubMed] [Google Scholar]
- Schridde U, Khubchandani M, Motelow JE, Sanganahalli BG, Hyder F, Blumenfeld H ( 2008): Negative BOLD with large increases in neuronal activity. Cereb Cortex 18: 1814–1827. [DOI] [PMC free article] [PubMed] [Google Scholar]
- Stefanovic B, Warnking JM, Pike GB ( 2004): Hemodynamic and metabolic responses to neuronal inhibition. Neuroimage 22: 771–778. [DOI] [PubMed] [Google Scholar]
- Smith SM ( 2002): Fast robust automated brain extraction. Hum Brain Mapp 17: 143–155. [DOI] [PMC free article] [PubMed] [Google Scholar]
- Sperling MR, O'Connor MJ ( 1990): Auras and subclinical seizures: Characteristics and prognostic significance. Ann Neurol 28: 320–328. [DOI] [PubMed] [Google Scholar]
- Sperling MR ( 1997): Clinical challenges in invasive monitoring in epilepsy surgery. Epilepsia 38: S6–S12. [DOI] [PubMed] [Google Scholar]
- Tao JX, Baldwin M, Hawes‐Ebersole S, Ebersole JS ( 2007): Cortical substrates of scalp EEG epileptiform discharges. J Clin Neurophysiol 24: 96–100. [DOI] [PubMed] [Google Scholar]
- Tyvaert L, Hawco C, Kobayashi E, LeVan P, Dubeau F, Gotman J ( 2008): Different structures involved during ictal and interictal epileptic activity in malformations of cortical development: An EEG‐fMRI study. Brain 131: 2042–2060. [DOI] [PMC free article] [PubMed] [Google Scholar]
- Uğurbil K, Toth L, Kim DS ( 2003): How accurate is magnetic resonance imaging of brain function? Trends Neurosci 26: 108–114. [DOI] [PubMed] [Google Scholar]
- Van Paesschen W, Dupont P, Sunaert S, Goffin K, Van Laere K ( 2007): The use of SPECT and PET in routine clinical practice in epilepsy. Curr Opin Neurol 20: 194–202. [DOI] [PubMed] [Google Scholar]
- Verma A, Radtke R ( 2006): EEG of partial seizures. J Clin Neurophysiol 23: 333–339. [DOI] [PubMed] [Google Scholar]
- Wennberg RA, Lozano AM ( 2003): Intracranial volume conduction of cortical spikes and sleep potentials recorded with deep brain stimulating electrodes. Clin Neurophysiol 114: 1403–1418. [DOI] [PubMed] [Google Scholar]
- Worsley KJ, Liao CH, Aston J, Petre V, Duncan GH, Morales F, Evans AC ( 2002): A general statistical analysis for fMRI data. Neuroimage 15: 1–15. [DOI] [PubMed] [Google Scholar]
- Zangaladze A, Nei M, Liporace JD, Sperling MR ( 2008): Characteristics and clinical significance of subclinical seizures. Epilepsia 21. [DOI] [PubMed] [Google Scholar]
- Zhao M, Suh M, Ma H, Perry C, Geneslaw A, Schwartz TH ( 2007): Focal increases in perfusion and decreases in hemoglobin oxygenation precede seizure onset in spontaneous human epilepsy. Epilepsia 48: 2059–2067. [DOI] [PubMed] [Google Scholar]