

Abstract
Recent advances in noninvasive structural imaging have opened up new approaches to cortical parcellation, many of which are described in this special issue on In Vivo Brodmann Mapping. In this introductory article, we focus on the emergence of cortical myelin maps as a valuable way to assess cortical organization in humans and nonhuman primates. We demonstrate how myelin maps are useful in three general domains: (i) as a way to identify cortical areas and functionally specialized regions in individuals and group averages; (ii) as a substrate for improved intersubject registration; and (iii) as a basis for interspecies comparisons. We also discuss how myelin-based cortical parcellation is complementary in important ways to connectivity-based parcellation using functional MRI or diffusion imaging and tractography. These observations and perspectives provide a useful background and context for other articles in this special issue.
Keywords: Myelin, parcellation, cortical areas, registration, networks
Introduction
Since the early 20th century, a major objective in systems neuroscience has been to subdivide the cerebral cortex into anatomically and functionally well-defined cortical areas. The earliest approach to be applied systematically was architectonics, i.e., identifying areas based on regional differences observed in histological sections stained for cell bodies or for myelin. Because the criteria for distinguishing among architectonic areas were subjective and often subtle, multiple parcellation schemes that differ in important ways have been described in each species examined, including humans and macaque monkeys. In recent decades, postmortem architectonics has improved through the incorporation of immunocytochemical and other markers (e.g., (Öngür et al., 2003), and by improved analysis methods such as observer-independent quantitative methods (e.g., (Schleicher et al., 1999; Amunts et al., 2000; Eickhoff et al., 2005; Schleicher et al., 2009). Additionally, the emergence of powerful alternative parcellation methods based on topographic organization (e.g., retinotopy), connectivity, and function has led to the discovery of many new areas as well as the confirmation of many previously charted areas (Felleman and Van Essen, 1991; Wandell and Winower, 2011). However, despite great progress in charting the layout of areas, a consensus cortical parcellation scheme for any primate species remains elusive (Van Essen, 2012, 2012b).
This special issue on In Vivo Brodmann Mapping celebrates the recent emergence of noninvasive methods for imaging architectonic patterns in humans and nonhuman primates. It includes articles describing a number of methodological advances, the majority of which are related to regional differences in myelin content within cortical gray matter that enable generation of cortical ‘myelin maps’. Thus, they represent a 21st-century revitalization of the pioneering efforts begun a century ago to characterize myeloarchitecture using postmortem histological stains (Hopf, 1955, 1956; see Nieuwenhuys, 2012).
Cortical myelin maps (and in vivo architectonics in general) are useful in several contexts for analyzing cortical organization in humans and nonhuman primates. (i) Myelin maps aid in cortical parcellation, i.e., in identifying anatomically and functionally distinct regions in individual subjects and group averages. (ii) They offer a substrate for improved intersubject alignment relative to standard methods that rely exclusively on shape features (i.e., cortical folding patterns). (iii) They provide evidence for anatomically corresponding regions in different species that may also reflect functional correspondences and evolutionary homologies. Here, we comment on all three of these topics, in order to provide context and motivation for topics discussed in greater depth in the other articles in this special issue
In vivo architectonics has emerged at a propitious time, insofar as it accompanies a veritable explosion of neuroimaging studies on the functional organization of the brain obtained using other modalities, most notably task-evoked fMRI (tfMRI), resting-state fMRI (rfMRI), and diffusion MRI (dMRI). The analysis of data using these other modalities can benefit greatly from the availability of myelin maps, which provide information about cortical organization in individual subjects as well as group averages. Here, we illustrate this using examples from the Human Connectome Project (HCP), an effort that is currently acquiring high-resolution structural, functional (rfMRI and tfMRI), and dMRI data on healthy adults (Van Essen et al., 2013a). The HCP datasets, which are being made freely available to the scientific community, include cortical myelin maps as a standard part of the preprocessing pipeline for structural imaging.
In vivo architectonics
A starting point for in vivo architectonics is that cerebral cortex is nonuniform in appearance when viewed using conventional structural imaging. For example, in a standard T1-weighted (T1w) image, cortical gray matter is brighter in regions such as primary motor cortex that are known to be heavily myelinated (Fig. 1A, blue arrow) and darker in other regions known to be lightly myelinated (Fig. 1A, red arrow). These regional nonuniformities are in some respects an experimental confound, because they can introduce errors and bias in automated methods for cortical segmentation, surface generation, and thickness estimation that require special efforts to circumvent (Glasser and Van Essen, 2011, Glasser et al., 2013b). In vivo architectonics makes lemonade from lemons by taking advantage of the information contained in these regional nonuniformities. One strategy for doing this is based on the fact that T2-weighted (T2w) images also show regional differences in intensity, but they tend to be opposite in polarity to those in T1w images (Fig. 1B, red and blue arrows, reversed relative to Fig. 1A). Fig. 1C shows the results of taking the T1w/T2w ratio, excluding voxels outside the gray-matter ribbon, and colorizing appropriately, yielding a map that is red and yellow (high T1w/T2w ratio, e.g., black/white arrow) in regions known to be heavily myelinated (e.g., somato-motor cortex in the central sulcus), green in regions known to be moderately myelinated, and blue in regions known to be lightly myelinated (e.g., white arrow).
Figure 1.
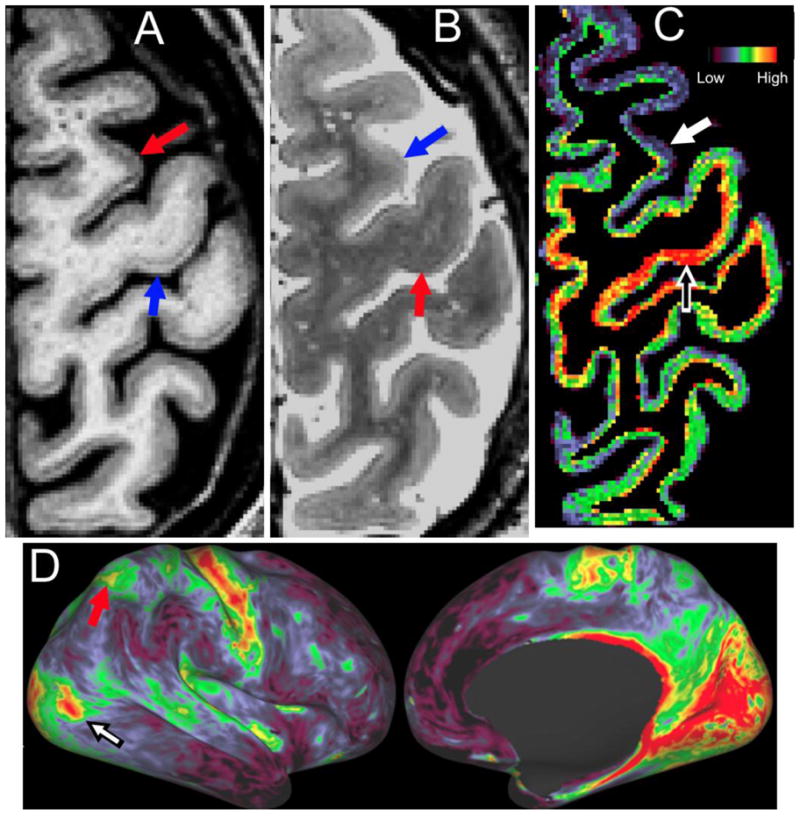
Myelin content estimated by taking the voxelwise ratio of T1w (A) to T2w (B), and colorizing (C). D. Myelin map on inflated right hemisphere of the same subject, including heavily myelinated hotspots centered on area MT+ (black/white arrow) and in the intraparietal sulcus (red arrow).
After this initial voxelwise analysis, the T1w/T2w data are mapped from the cortical ribbon to individual-subject representations of the cortical midthickness surface (Fig. 1D; see also Fig. 1 in Glasser et al, 2013a, this issue). The resultant myelin map shows a distinctive pattern of heavy, moderate, and light myelination that is discussed below. Of particular note in this subject are two distinctive patches of heavy myelination, one in lateral occipital cortex (white/black arrow) and one in medial parietal cortex (red arrow). It is also significant that the myelin map is largely independent of the cortical folding pattern – i.e., myelin does not tend to be heavier or lighter on gyral crowns or sulcal fundi.
In order to compare results across a population of healthy adults, the individual surfaces were registered to a population average using FreeSurfer’s surface-based registration. This method entails registering the individual’s ‘sulc’ map (a measure akin to sulcal depth) to that of a population average and thus relies exclusively on shape characteristics, as do other widely used intersubject registration methods (e.g., BrainVoyager). Fig. 2 illustrates the average cortical myelin map from a group of 20 healthy adults, displayed on lateral and medial views of an inflated right hemisphere atlas surface. This map was generated from 20 unrelated subjects from the HCP Q1 open access data release (https://db.humanconnectome.org; cf Van Essen et al., 2013a), and it illustrates several key features of cortical myelin maps described in detail elsewhere (Glasser and Van Essen, 2011; Sereno et al., 2012; Glasser et al., 2013a). Importantly, the overall pattern of the myelin map is strongly concordant with classical myeloarchitectonic studies. For example, red regions on the map correspond to heavily myelinated regions seen in histological sections (Hopf, 1955, 1956; Hopf and Vitzthum, 1957). Moreover, spatial gradients in the group average myelin map colocalize with probabilistic cytoarchitectonic borders, most notably in somato-motor cortex and visual cortex (black contours in Fig. 1) but also in several other regions (Glasser and Van Essen, 2011). Area hOc5, a.k.a the area MT+ complex (Fischl et al., 2008; Van Essen et al., 2012c), is centered on a patch of heavy myelination and surrounded by a ring of moderate myelination in the group-average map. A swath of moderately myelinated cortex in the group average extends from visual cortex to somatosensory cortex in medial parietal cortex in the group average (red arrow). More generally, regions of high, medium, and low cortical myelin content covary with a variety of other anatomical, developmental, and evolutionary patterns (Glasser and Van Essen, 2011; Glasser et al., 2013a), including the classical pattern of subcortical white matter myelin development described by Flechsig (cf. Fuster, 1995; Glasser and Van Essen, 2011).
Figure 2.
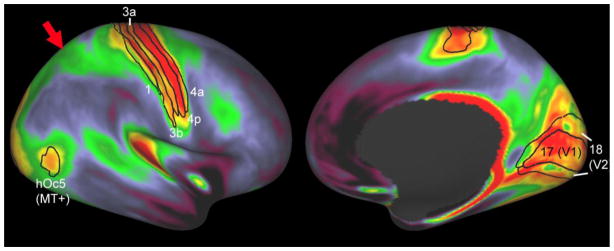
Group average myelin map from the HCP Unrelated 20 subjects (ref). Black contours indicate areal boundaries of somatosensory (1,3a,3b), motor (4a,4p), and visual (17=V1, 18=V2, and hOc5 = MT+) areas from probabilistic cytoarchitectonic maps registered to the atlas surface (Fischl et al., 2008). Red arrow shows strip of moderately myelinated cortex in medial parietal cortex.
Intersubject variability in myelin maps
The surface-based registration represented in Figure 2 has significant advantages over conventional volume-based registration, mainly because the registration process respects the topology of the cortical sheet despite large individual differences in the pattern of convolutions (Fischl et al., 1999; Anticevic et al., 2008b; Fischl et al., 2008; Frost and Goebel, 2012a; Tucholka et al., 2012a; Van Essen et al., 2012a). However, because it relies on optimizing the alignment of shape features (folding patterns), it does not take into account the fact that cortical areal boundaries have a complex and variable relationship to gyral and sulcal folds, especially in regions of high folding variability (Amunts et al., 1999, 2000; Van Essen et al., 2012c).
Myelin maps provide a useful indicator of the degree of residual misalignment after shape-based surface registration. For example, Figure 3 illustrates variability of heavily myelinated patches in lateral occipital and medial parietal cortex for five individual subjects compared to the 20-subject group average. In the group-average myelin map (upper left), one cross is centered on hOc5 (MT+), another is centered on a moderately myelinated patch near the fundus of the superior temporal sulcus (STS), and the third is centered on the middle of the moderately myelinated swath in parietal cortex. Each of the five individual subjects has a candidate myelin hotspot in the vicinity of MT+, but the location and shape of this patch varies across subjects. Each subject also has a moderately myelinated patch in the STS, but again with some variability in location. Two subjects have an additional patch in between (100307 and 117122 in the center column). In parietal cortex, four of the exemplar subjects have a patch of moderately heavy myelination (yellow or red) in a variable location relative to the group average peak, but in one subject (117112, lower center), no such peak is evident.
Figure 3.

Myelin maps for the group average plus five individual HCP subjects, displayed on lateral views of the very inflated group average surface. Myelin maps were generated from the HCP Q1 open access dataset (based on methods described in Glasser et al., 2013a) and were further processed by a normalization step that compensates for bias specific to the HCP Skyra scanner.
An important question is the degree to which the myelin maps reflect the location of functionally specialized regions in individual subjects. For example, does the heavily myelinated patch near the population-average MT+ complex accurately reflect the location of MT+ in each individual? Does the heavily myelinated patch approximately midway along the swath of moderately myelinated cortex in the parietal lobe represent a functionally distinct area? A useful way to evaluate this issue is to compare myelin maps with functionally delineated regions in individual subjects. One such approach involves comparison with task-fMRI activations. For example, Figure 4 compares myelin maps with motion-selective fMRI activation in the MT+ complex (Glasser et al., 2012a). Fig. 4A shows a group-average myelin map, generated from a different group of subjects than those illustrated in Fig. 3. A motion-selective group fMRI activation (Fig. 4B) was centered over the heavily myelinated patch, as evidenced by the ring of white highlighted vertices positioned along peaks in the spatial gradients of the myelin map (Fig. 4C) and task activation map (Fig. 4D). In one exemplar subject, both the heavily myelinated patch (Fig. 4E) and the motion-selective activation (Fig. 4F) were centered on the dorsal portion of the group average, whereas in another exemplar subject both the heavily myelinated patch (Fig. 4G) and the motion-selective activation (Fig. 4H) were centered on the ventral portion of the group average.
Figure 4.
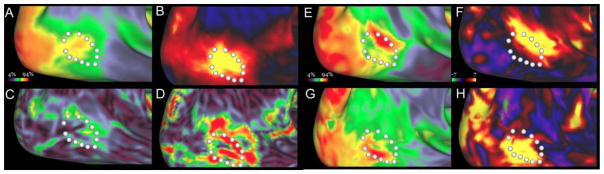
Myelin maps compared to tfMRI motion activation maps in a group average (upper left) vs individual subjects. A. Group average myelin map from 10 subjects (14 scans, including four repeat subjects) from a pilot HCP dataset. B. Group average motion activation from the same population. C. Spatial gradient of group average myelin map. D. Spatial gradient of group average motion map. E, F. Myelin map and task activation hotspots are colocalized in one subject. G, H. In a different subject, myelin map and task activation are again colocalized, but in a different location relative to the group-average MT+ border. Adapted from Glasser et al., 2012a).
An alternative approach is to compare myelin maps in individual subjects with functional connectivity maps determined using resting-state fMRI (Glasser et al., 2011a). For example, Figure 5A shows a seed location centered in heavily myelinated MT+ of the right hemisphere, plus highlighted vertices on the corresponding MT+ in the left hemisphere and two other myelin hotspots in frontal cortex (FEF) and parietal cortex (cf. Fig. 4) in both hemispheres. In Fig. 5B, hotspots of high functional connectivity map are present at all highlighted vertices, indicating colocalization of functional connectivity and myelin hotspots. On the medial aspect of the hemisphere, the boundary of heavy myelination in visual cortex (Fig. 5A, white contour and green arrow in lower panels) is colocalized with a sharp transition in the functional connectivity map for the MT+ seed (Fig. 5B). This preliminary analysis provides encouragement that myelin maps provide a valuable surrogate for functionally relevant cortical domains in individual subjects.
Figure 5.
Correlations between myelin hotspots and functional connectivity in an individual HCP subject 100307. A. Myelin map for this subject, with highlighted vertices indicating a seed location in right MT+ (red arrow) and additional myelin hotspots in frontal (FEF) and parietal cortex. B. Functional connectivity map associated with the seed location in right MT+ shows strong colocalization of functional connectivity hotspots with myelin hotspots in panel A.
Previous studies have proposed that intersubject registration can be improved by incorporating functionally-based constraints in addition to conventions shape-based constraints. For example, Sabuncu et al. (2010) showed improved intersubject alignment using fMRI activation patterns while subjects viewed a movie. However, a task-fMRI approach registration is limited by the need to carry out the same task in all subjects. Given the above evidence that myelin maps provide functionally-relevant markers in most individuals, it offers an attractive alternative strategy for improving intersubject registration. This has now been tested and confirmed using a novel multimodal surface matching (MSM) algorithm (Robinson et al., 2013). Much remains to be done in terms of parameter optimization, but it is encouraging that group-average myelin maps can be substantially sharpened using constraints that include myelin as well as shape features.
A more ambitious possibility for the future will involve connectivity-based registration using functional and/or structural connectivity. In theory, the vast amounts of data available using these modalities should enable accurate intersubject alignment across the entire cortical sheet. However, the robustness of this approach will need to be critically assessed. One issue is that fMRI and diffusion imaging are impacted by biases arising from the pattern of folds in each individual. For fMRI, vascular mixing of signals across sulcal banks introduces a major bias (cf. Van Essen and Ugurbil, 2012). For diffusion imaging, the largest problem is a bias that artifactually overemphasizes connectivity with gyral crowns (Van Essen et al., 2013b). Additional confounds arise because individuals will differ in inter-areal connectivity profiles and in the degree to which particular areas are activated in any given tasks. These individual differences constitute neurobiologically interesting issues to study, but they complicate the use of connectivity and task-activations to constrain intersubject registration. Myelin maps, while not bias-free, are less impacted by folding-related biases. In addition, it is common to acquire T1w and T2w scans as a matter of routine in a variety of neuroimaging studies. Consequently, we anticipate that multi-modal registration that includes myelin maps will have broad utility in a variety of future studies.
Interspecies comparisons
A third general domain in which myelin maps are useful is for comparisons across species. The common ancestor to the primate lineage (~55 Million years ago) had a small lissencephalic cerebral cortex, probably more similar to modern prosimians than any other primate (Allman, 1977, 2000). Cerebral cortex has expanded to very different degrees in various primate lineages. For example, cortical surface area for one hemisphere averages 105 cm2 for the macaque monkey (Van Essen et al., 2012b), 317 cm2 for the chimpanzee (Van Essen, 2006), and 978 cm2 for humans (Van Essen et al., 2012c). More importantly, cortical expansion has been highly nonuniform across species. For example, some regions of lateral temporal, parietal, and prefrontal cortex have expanded 20-fold or more in surface area in humans compared to macaques, whereas other regions such as areas V1 and V2 have expanded only about 2-fold more in humans (Denys et al., 2004; Van Essen and Dierker, 2007). However, the accuracy of such comparisons are impacted by the difficulty in identifying clear homologies across species in regions outside early sensory and motor cortex. In ‘higher association’ cortex, there are no ‘ground truth’ consensus parcellations in either species, and it is difficult to infer with confidence exactly which cortical areas or regions are homologous (i.e., have a common evolutionary origin in an ancestral lineage). The situation is even more difficult when making comparisons to great apes, as there is far less experimental information available regarding the anatomical and functional organization in any of the great ape species.
In the context of the above challenges, myelin maps offer tantalizing prospects for improving our understanding of evolutionary relationships in primate cerebral cortex. Cortical myelin maps have been generated in a number of nonhuman primate species, including the marmoset (Bock et al., 2009, 2011), macaque, and chimpanzee (Glasser et al., 2011b; Glasser et al., 2012b). Figure. 3 of Glasser et al., (2013a) illustrates population-average myelin maps made using similar methods (T1w/T2w ratio) in macaque, chimpanzee, and humans. All three species show heavily myelinated regions in somato-motor cortex, early auditory cortex, early visual cortex, and retrosplenial cortex. More intriguingly, the chimpanzee has several heavily myelinated patches that provide strong evidence for evolutionary homologies in regions that have been poorly mapped. This includes a heavily myelinated patch in the posterior bank of the STS (similar to its location in the macaque) that is a very strong candidate for the homologue of the heavily myelinated MT+ complex in humans and macaques. Similarly, a moderately myelinated region in chimpanzee prefrontal cortex is a strong candidate for the frontal eye fields (FEF) discernible in macaque and human myelin maps. Its location in the precentral and superior frontal sulci, extending significantly anterior to the motor and premotor strip, is more similar to the location of macaque FEF than human FEF. In cortex in the intraparietal sulcus, all three species have a moderately myelinated swath with multiple hotspots of heavier myelination. In macaques and chimpanzees, this swath includes both lateral and medial banks of the intraparietal sulcus (IPS). In humans, it also includes both banks of the IPS but extends only partway up the lateral bank (cf. Figs. 2, 3 above).
Interspecies comparisons of lightly myelinated cortical regions are also quite interesting, because there are dramatic species differences in their overall extent. All three species have lightly myelinated regions in lateral and medial parietal cortex, lateral temporal cortex, and over most of prefrontal cortex. The proportion of lightly myelinated cortex is only moderately greater in the chimpanzee compared to the macaque, whereas it is dramatically larger in humans, especially in lateral prefrontal, parietal, and temporal cortex (cf. Figs. 3 and 4 of Glasser et al., 2013a). These regions are also show much greater intersubject variability in the pattern of convolutions in humans. These observations are relevant to the hypothesis that much of lightly myelinated cortex is not only evolutionarily recent in the human lineage and involved in higher cognitive functions such as language, but that it may have qualitatively different features related to circuit plasticity and dynamics (Glasser et al., 2013a).
Comparisons between macaques and humans are not only of general evolutionary interest, but are especially important because the macaque provides most of the ‘ground truth’ neuroanatomical connectivity data that can be used for validation of rfMRI and dMRI-based inferences in humans. Comparisons between great apes and humans is of high interest owing to their evolutionary proximity, yet there are very few options for obtaining detailed anatomical and functional data on their brain organization. Hence, we are optimistic that myelin maps will remain an important addition to the repertoire of data that can be used for interspecies comparisons.
Parcellation mismatches across modalities
In the final section, we consider the importance of multi-modal parcellation approaches that provide distinct and complementary ways to subdivide the cortical sheet. A starting point is to note that cortical areas have conventionally been identified using information from one or more of four general approaches: architectonics, topographic organization, functional specificity, and connectivity. When parcellations based on different approaches are in accord with one another, there is greater confidence in areal boundaries, and in cases like areas V1 and MT there can be concordance across all four approaches (e.g., Van Essen et al., 1981; Felleman and Van Essen, 1991). On the other hand, it is also well established that many cortical areas have heterogeneous connectivity patterns related either to topographic organization or to a patch-like modularity in organization. For example, in macaque primary motor cortex, face, forelimb, and hindlimb regions receive their major inputs from different sets of cortical areas that overlap only partially (Tokuno et al., 1997; Hatanaka et al., 2001). Likewise, central vs peripheral portions of macaque area V1 have different patterns and strengths of connectivity with extrastriate visual areas (Falchier et al., 2002).
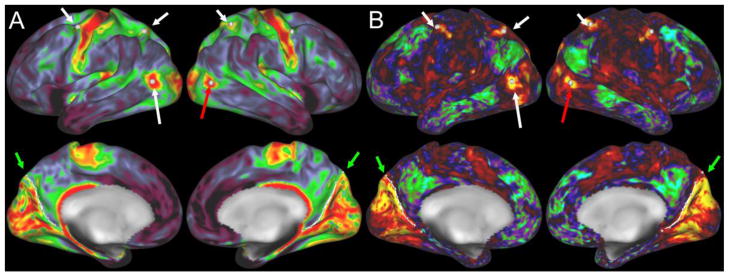
These observations are relevant to connectivity-based cortical parcellation approaches, which offer a powerful approach to identifying regions of human cortex that are delineated based on similarities in functional and/or structural connectivity revealed by in vivo neuroimaging (Knosche and Tittgemeyer, 2011). In this context, it is instructive to compare the differences as well as similarities between architectonic parcellations and alternative parcellations derived from functional connectivity based on resting-state fMRI analyses (Power et al., 2011; Yeo et al., 2011; Sereno et al., 2012). For example, Fig. 6A, B illustrates a functional network parcellation of the entire cerebral cortex (Yeo et al., 2011) that was generated from resting-state functional connectivity data mapped to the cortical surface in 1,000 individual subjects, then registered to the fsaverage atlas surface as in preceding figures. The architectonic and functional network parcellation schemes differ strikingly and in three distinct ways (i–iii below).
Figure 6.
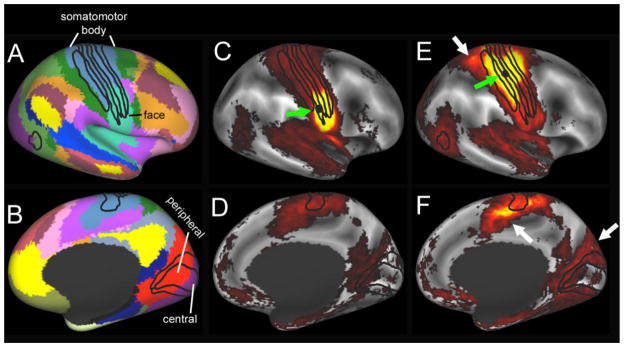
A, B. Functional network parcellation by Yeo et al. (2011) shows functional network boundaries that cut midway through architectonically-defined somatosensory areas (panel A) and visual areas (panel B). C – F. Functional connectivity maps from the HCP Q1 unrelated 20 group average 20 for seeds within area 3b face representation (panels C, D) and upper body representation (panels E, F), including the arm and hand.
(i) Network parcels split some architectonic areas
Some connectivity-based network parcels cut across the interior of well-defined architectonic areas. Specifically, in somatomotor cortex (Fig. 6A) there are separate functional network parcels for the body representation and the face representation (also reported by Power et al., 2011). In visual cortex (Fig. 6B), separate functional network parcels occupy central and peripheral representations of architectonic areas 17 and 18 (black outlines) plus nearby extrastriate visual areas that differ in their emphasis on central vision (ventral regions) vs peripheral regions (dorsal regions).
Within-area differences in functional connectivity are illustrated in Fig. 6C–F, using group-average functional connectivity from the HCP 20 unrelated subjects (Q1 data release; Van Essen et al, 2013a; Smith et al., 2013). A seed region in the face representation of area 3b (green arrow, Fig. 6C) shows strong functional connectivity with nearby face portions of somatomotor cortex and moderate functional connectivity with many other regions of the somatomotor complex, auditory cortex, and visual cortex. A seed region in the upper body representation of area 3b (Fig. 6E) shows functional connectivity with much of the upper body representation of other somatomotor areas and with the cingulate motor cortex and area 5m. In addition, the functional connectivity with dorsal and ventral extrastriate visual areas, while more modest, appears to be stronger and more extensive than that associated the seed in the face representation. These and many other comparisons of this type need further quantitation and validation, but the exemplars illustrated here provide a useful sense of the patterns of functional connectivity and their regional variations obtainable revealed by seed-based analyses.
(ii) Network parcels span multiple architectonic areas
The functional network parcels that split early somatomotor and visual areas are notable insofar as they each encompass portions of neighboring architectonic areas: areas 17, 18 and extrastriate areas for the visual network parcels and areas 3a, 3b, 1, 2, 4p, and 4a of the somatomotor nodes (Fig. 6A, B; see also Yeo et al., 2011; Power et al., 2011). The network parcel that includes the somatomotor face representation also extends across much of auditory cortex, implying that functional networks can span multiple sensory modalities.
These observations are consistent with tracer studies in the macaque indicating that connectivity differences between neighboring cortical areas are less pronounced than has previously been appreciated. For example, quantitative connectivity profiles of the foveal representation of areas V1, V2, and V4 differ only modestly and mainly in the relative strength rather than the presence vs absence of inputs to each area (Markov et al., 2011). Similarity of connectivity profiles is evident for many other nearby areas (Markov et al., 2012). Altogether, these findings suggest that within-area heterogeneity of anatomical connectivity may exceed the between-area differences in connectivity for topographically corresponding locations. This would explain why parcellations based on architectonics and functional connectivity show the pronounced differences discussed above. However, this in no way negates or undermines the validity and utility of parcellations based on architectonics and/or topographic organization.
(iii) Network parcels are often noncontiguous
Many functional network parcels comprise distinct subregions that can be widely separated (e.g., in different cortical lobes). For example, the yellow patches in Fig. 2 represent widely dispersed components of the default mode network (Fox et al., 2005; Raichle and Snyder, 2007). Despite their separation, these subregions have greater commonality in their functional connectivity than do adjacent regions that belong to different networks. This feature of functional networks is especially common in association cortex, and less common in early sensory and motor regions.
More generally, these considerations reinforce the importance of a thorough multi-modal approach to cortical parcellation in order to adequately characterize its functional organization. Architectonic methods (including in vivo architectonics) and topographic mapping methods (e.g., retinotopic and somatotopic mapping) will likely remain the most effective ways to chart the full extent of individual cortical areas in regions where retinotopy or somatotopy are present. Connectivity-based parcellation enables mapping of cortical sub-areas that reflect important aspects of within-area heterogeneity of connectivity and function. Connectivity-based parcellation can be done with diffusion imaging and tractography (Johansen-Berg et al., 2004; Klein et al., 2007; Beckmann et al., 2009) as well as the resting-state fMRI approach discussed above. Both modalities will benefit from higher quality imaging data, such as that currently being obtained by the Human Connectome Project (HCP) (Van Essen et al., 2012b) yet there are biases and uncertainties associated with each modality that can have a major impact on parcellations. Also, the analysis methods for identifying connectivity-based parcels will continue to be refined, using a variety of approaches such as spatial gradients (Cohen et al., 2008; Nelson et al., 2010; Glasser et al., 2011a; Glasser et al., 2012a), clustering methods that enforce spatial contiguity (Blumensath et al., 2013), and snowballing combined with gradients (Wig et al., 2013).
Given the fundamental complementarity of these various modalities and approaches, multi-modal parcellation is likely to provide the most comprehensive and accurate parcellations, but it also poses challenges for how best to combine information across modalities.
Summary
The modern era of in vivo human neuroimaging commenced two decades ago with the advent of MRI-based neuroimaging as a way to probe brain structure, function, and connectivity (see special issue on 20 years of fMRI). An initial trickle of experimental data quickly evolved into an ever-growing torrent whose sheer magnitude is staggering. Our overall understanding of cortical organization and function has advanced immensely as well. Yet the fundamental goal of achieving a solid first-order understanding of cortical parcellation remains elusive. By analogy, cortical cartographers of today are about as far along in charting the human brain as were cartographers of the earth’s surface in the early 18th century. Yet the tools are at hand for making dramatic advances over the next decade. There is good reason to be optimistic that vivo architectonics will play an increasingly important role in contributing to these advances.
Highlights.
Myelin maps reveal cortical organization in individuals and group averages
Myelin maps can aid in compensating for individual variability
Myelin maps aid in comparisons between humans, great apes, and monkeys
Acknowledgments
We thank our many colleagues in the WU-Minn HCP Consortium (http://humanconnectome.org) for invaluable contributions to the data acquisition, analysis, and sharing efforts that enabled our use of HCP data in several of the figures. Supported by NIMH grant R01 MH 60974 and the Human Connectome Project (1U54MH091657-01) from the 16 NIH Institutes and Centers that Support the NIH Blueprint for Neuroscience Research. MFG was supported by an individual fellowship NIH F30 MH097312.
Footnotes
Publisher's Disclaimer: This is a PDF file of an unedited manuscript that has been accepted for publication. As a service to our customers we are providing this early version of the manuscript. The manuscript will undergo copyediting, typesetting, and review of the resulting proof before it is published in its final citable form. Please note that during the production process errors may be discovered which could affect the content, and all legal disclaimers that apply to the journal pertain.
References
- Allman JM. Evolution of the visual system in early primates. In: Sprague J, Epstein A, editors. Progress in Physiological Pscyhology. Academic Press; 1977. pp. 1–53. [Google Scholar]
- Allman JM. In: Evolving Brains. Freeman WH, editor. Scientific American Library; New York: 2000. [Google Scholar]
- Amunts K, Malikovic A, Mohlberg H, Schormann T, Zilles K. Brodmann’s Areas 17 and 18 Brought into Stereotaxic Space--Where and How Variable? NeuroImage. 2000;11:66–84. doi: 10.1006/nimg.1999.0516. [DOI] [PubMed] [Google Scholar]
- Anticevic A, Dierker DL, Gillespie SK, Repovs G, Csernansky JG, Van Essen DC, Barch DM. Comparing surface-based and volume-based analyses of functional neuroimaging data in patients with schizophrenia. Neuroimage. 2008b;41:835–848. doi: 10.1016/j.neuroimage.2008.02.052. [DOI] [PMC free article] [PubMed] [Google Scholar]
- Beckmann M, Johansen-Berg H, Rushworth MF. Connectivity-based parcellation of human cingulate cortex and its relation to functional specialization. J Neurosci. 2009;29:1175–1190. doi: 10.1523/JNEUROSCI.3328-08.2009. [DOI] [PMC free article] [PubMed] [Google Scholar]
- Blumensath T, Jbabdi S, Glasser MF, Van Essen DC, Ugurbil K, Behrens TE, Smith SM. Spatially constrained hierarchical parcellation of the brain with resting-state fMRI. Neuroimage. 2013 doi: 10.1016/j.neuroimage.2013.03.024. (in press) [DOI] [PMC free article] [PubMed] [Google Scholar]
- Bock DD, et al. Network anatomy and in vivo physiology of visual cortical neurons. Nature. 2011;471:177–182. doi: 10.1038/nature09802. [DOI] [PMC free article] [PubMed] [Google Scholar]
- Bock N, Kocharyan A, Liu J, Silva A. Visualizing the entire cortical myelination pattern in marmosets with magnetic resonance imaging. Journal of neuroscience methods. 2009;185:15–22. doi: 10.1016/j.jneumeth.2009.08.022. [DOI] [PMC free article] [PubMed] [Google Scholar]
- Cohen AL, Fair DA, Dosenbach NU, Miezin FM, Dierker D, Van Essen DC, Schlaggar BL, Petersen SE. Defining functional areas in individual human brains using resting functional connectivity MRI. NeuroImage. 2008;41:45–57. doi: 10.1016/j.neuroimage.2008.01.066. [DOI] [PMC free article] [PubMed] [Google Scholar]
- Denys K, Vanduffel W, Fize D, Nelissen K, Sawamura H, Georgieva S, Vogels R, Van Essen D, Orban GA. Visual activation in prefrontal cortex is stronger in monkeys than in humans. J Cogn Neurosci. 2004;16:1505–1516. doi: 10.1162/0898929042568505. [DOI] [PubMed] [Google Scholar]
- Eickhoff SB, Stephan KE, Mohlberg H, Grefkes C, Fink GR, Amunts K, Zilles K. A new SPM toolbox for combining probabilistic cytoarchitectonic maps and functional imaging data. NeuroImage. 2005;25:1325–1335. doi: 10.1016/j.neuroimage.2004.12.034. [DOI] [PubMed] [Google Scholar]
- Falchier A, Clavagnier S, Barone P, Kennedy H. Anatomical evidence of multimodal integration in primate striate cortex. J Neurosci. 2002;22:5749–5759. doi: 10.1523/JNEUROSCI.22-13-05749.2002. [DOI] [PMC free article] [PubMed] [Google Scholar]
- Felleman DJ, Van Essen DC. Distributed hierarchical processing in the primate cerebral cortex. Cereb Cortex. 1991;1:1–47. doi: 10.1093/cercor/1.1.1-a. [DOI] [PubMed] [Google Scholar]
- Fischl B, Sereno MI, Tootell RB, Dale AM. High-resolution intersubject averaging and a coordinate system for the cortical surface. Human brain mapping. 1999;8:272–284. doi: 10.1002/(SICI)1097-0193(1999)8:4<272::AID-HBM10>3.0.CO;2-4. [DOI] [PMC free article] [PubMed] [Google Scholar]
- Fischl B, Rajendran N, Busa E, Augustinack J, Hinds O, Yeo BTT, Mohlberg H, Amunts K, Zilles K. Cortical folding patterns and predicting cytoarchitecture. Cerebral Cortex. 2008;18:1973–1980. doi: 10.1093/cercor/bhm225. [DOI] [PMC free article] [PubMed] [Google Scholar]
- Fox MD, Snyder AZ, Vincent JL, Corbetta M, Van Essen DC, Raichle ME. The human brain is intrinsically organized into dynamic, anticorrelated functional networks. Proceedings of the National Academy of Sciences of the United States of America. 2005;102:9673–9678. doi: 10.1073/pnas.0504136102. [DOI] [PMC free article] [PubMed] [Google Scholar]
- Frost MA, Goebel R. Measuring structural–functional correspondence: Spatial variability of specialised brain regions after macro-anatomical alignment. Neuroimage. 2012a;59:1369–1381. doi: 10.1016/j.neuroimage.2011.08.035. [DOI] [PubMed] [Google Scholar]
- Frost MA, Goebel R. Measuring structural-functional correspondence: spatial variability of specialised brain regions after macro-anatomical alignment. NeuroImage. 2012b;59:1369–1381. doi: 10.1016/j.neuroimage.2011.08.035. [DOI] [PubMed] [Google Scholar]
- Fuster JM. Gradients of Cortical Plasticity. In: McGaugh JL, Weinberger NM, Lynch G, editors. Brain and memory: modulation and mediation of neuroplasticity. Oxford University Press; USA: 1995. [Google Scholar]
- Glasser M, Van Essen DC. Mapping human cortical areas in vivo based on myelin content as revealed by T1 and T2-weighted MRI. J Neuroscience. 2011;31:11597–11616. doi: 10.1523/JNEUROSCI.2180-11.2011. [DOI] [PMC free article] [PubMed] [Google Scholar]
- Glasser M, Laumann T, Coalson T, Cohen AL, Snyder A, Schlaggar BL, Petersen SE, Van Essen D. Comparison of surface gradients derived from myelin maps and functional connectivity analysis. Org Human Brain Mapping Annual Meeting Abstract 2011a [Google Scholar]
- Glasser MF, Preuss TM, Snyder LH, Nair G, Rilling JR, Zhang X, Li L, Van Essen DC. Comparative mapping of cortical myelin content in humans, chimpanzees, and Macaques using T1-weighted and T2-weighted MRI. Soc Neurosci Abstract 2011b [Google Scholar]
- Glasser MF, Burgess G, Xu J, He Y, Barch DM, Calson TS, Fischl B, Harms MP, Jenkinson M, Patenaude B, Petersen SE, Schlaggar BL, Smith S, Woolrich MW, Yacoub E, Van Essen DC. Surface gradient comparison of myelin and fMRI: Architectonic and fucntional border co-localization. Org Human Brain Mapping Abstract 2012a [Google Scholar]
- Glasser MF, Preuss TM, Nair G, Rilling JK, Zhang X, Li L, Van Essen DC. Improved cortical myelin maps in humans, chimpanzees, and Macaques allow identification of putative areal homologies. Soc Neurosci Abstract 2012b [Google Scholar]
- Glasser MF, Goyalb MS, Press TM, Raichle ME, Van Essen DC. Trends and properties of human cerebral cortex: Correleations with cortical myelin content. Neuroimage (Special issue on In Vivo Brodmann Mapping) 2013a doi: 10.1016/j.neuroimage.2013.03.060. [DOI] [PMC free article] [PubMed] [Google Scholar]
- Glasser MF, Sotiropoulos SN, Wilson JA, Coalson T, Fischl B, Andersson J, Xu J, Jbabdi S, Webster M, Polimeni J, Van Essen DC, Jenkinson M. The minimal preprocessing pipielines for the Human Connectome Projects. Neuroimage. 2013b doi: 10.1016/j.neuroimage.2013.04.127. (Special issue on Mapping the Connectome) [DOI] [PMC free article] [PubMed] [Google Scholar]
- Hatanaka N, Nambu A, Yamashita A, Takada M, Tokuno H. Somatotopic arrangement and corticocortical inputs of the hindlimb region of the primary motor cortex in the macaque monkey. Neuroscience research. 2001;40:9–22. doi: 10.1016/s0168-0102(01)00210-3. [DOI] [PubMed] [Google Scholar]
- Hopf A. Über die Verteilung myeloarchitektonischer Merkmale in der isokortikalen Schläfenlappenrinde beim Menschen’) J Hirnforsch. 1955;2:36–54. [Google Scholar]
- Hopf A. Über die Verteilung myeloarchitektonischer Merkmale in der Stirnhirnrinde beim Menschen. J Hirnforsch. 1956;2:311–333. [PubMed] [Google Scholar]
- Hopf A, Vitzthum HG. Über die Verteilung myeloarchitektonischer Merkmale in der Scheitellappenrinde beim Menschen. JOURNAL FÜR HIRNFORSCHUNG 3. 1957 [PubMed]
- Johansen-Berg H, Behrens TE, Robson MD, Drobnjak I, Rushworth MF, Brady JM, Smith SM, Higham DJ, Matthews PM. Changes in connectivity profiles define functionally distinct regions in human medial frontal cortex. Proceedings of the National Academy of Sciences of the United States of America. 2004;101:13335–13340. doi: 10.1073/pnas.0403743101. [DOI] [PMC free article] [PubMed] [Google Scholar]
- Klein JC, Behrens TE, Robson MD, Mackay CE, Higham DJ, Johansen-Berg H. Connectivity-based parcellation of human cortex using diffusion MRI: Establishing reproducibility, validity and observer independence in BA 44/45 and SMA/pre-SMA. NeuroImage. 2007;34:204–211. doi: 10.1016/j.neuroimage.2006.08.022. [DOI] [PubMed] [Google Scholar]
- Knosche TR, Tittgemeyer M. The role of long-range connectivity for the characterization of the functional-anatomical organization of the cortex. Frontiers in systems neuroscience. 2011;5:58. doi: 10.3389/fnsys.2011.00058. [DOI] [PMC free article] [PubMed] [Google Scholar]
- Markov NT, Misery P, Falchier A, Lamy C, Vezoli J, Quilodran R, Gariel MA, Giroud P, Ercsey-Ravasz M, Pilaz LJ, Huissoud C, Barone P, Dehay C, Toroczkai Z, Van Essen DC, Kennedy H, Knoblauch K. Weight consistency specifies regularities of macaque cortical networks. Cereb Cortex. 2011;21:1254–1272. doi: 10.1093/cercor/bhq201. [DOI] [PMC free article] [PubMed] [Google Scholar]
- Markov NT, et al. A weighted and directed interareal connectivity matrix for macaque cerebral cortex. Cereb Cortex. 2012 doi: 10.1093/cercor/bhs270. Epub 2012/09/27. [DOI] [PMC free article] [PubMed] [Google Scholar]
- Nelson SM, Cohen AL, Power JD, Wig GS, Miezin FM, Wheeler ME, Velanova K, Donaldson DI, Phillips JS, Schlaggar BL, Petersen SE. A parcellation scheme for human left lateral parietal cortex. Neuron. 2010;67:156–170. doi: 10.1016/j.neuron.2010.05.025. [DOI] [PMC free article] [PubMed] [Google Scholar]
- Nieuwenhuys R. The insular cortex: a review. Progress in brain research. 2012;195:123–163. doi: 10.1016/B978-0-444-53860-4.00007-6. [DOI] [PubMed] [Google Scholar]
- Öngür D, Ferry A, Price J. Architectonic subdivision of the human orbital and medial prefrontal cortex. The Journal of comparative neurology. 2003;460:425–449. doi: 10.1002/cne.10609. [DOI] [PubMed] [Google Scholar]
- Power JD, Cohen AL, Nelson SM, Wig GS, Barnes KA, Church JA, Vogel AC, Laumann TO, Miezin FM, Schlaggar BL, Petersen SE. Functional network organization of the human brain. Neuron. 2011;72:665–678. doi: 10.1016/j.neuron.2011.09.006. [DOI] [PMC free article] [PubMed] [Google Scholar]
- Raichle ME, Snyder AZ. A default mode of brain function: a brief history of an evolving idea. NeuroImage. 2007;37:1083–1090. doi: 10.1016/j.neuroimage.2007.02.041. discussion 1097–1089. [DOI] [PubMed] [Google Scholar]
- Robinson E, Jbabdi S, Andersson J, Smith S, Glasser M, Van Essen D, Burgess G, Harms M, Barch D, Jenkinson M. Multimodal surface matching: Fast and generalisable cortical registration using discrete optimisation. Proc Information Processing in Medical Imaging Springer. 2013 doi: 10.1007/978-3-642-38868-2_40. [DOI] [PubMed] [Google Scholar]
- Schleicher A, Morosan P, Amunts K, Zilles K. Quantitative architectural analysis: a new approach to cortical mapping. Journal of autism and developmental disorders. 2009;39:1568–1581. doi: 10.1007/s10803-009-0790-8. [DOI] [PubMed] [Google Scholar]
- Schleicher A, Amunts K, Geyer S, Morosan P, Zilles K. Observer-independent method for microstructural parcellation of cerebral cortex: A quantitative approach to cytoarchitectonics. NeuroImage. 1999;9:165–177. doi: 10.1006/nimg.1998.0385. [DOI] [PubMed] [Google Scholar]
- Sereno MI, Lutti A, Weiskopf N, Dick F. Mapping the Human Cortical Surface by Combining Quantitative T1 with Retinotopy. Cereb Cortex. 2012 doi: 10.1093/cercor/bhs213. [DOI] [PMC free article] [PubMed] [Google Scholar]
- Tokuno H, Takada M, Nambu A, Inase M. Reevaluation of ipsilateral corticocortical inputs to the orofacial region of the primary motor cortex in the macaque monkey. The Journal of comparative neurology. 1997;389:34–48. doi: 10.1002/(sici)1096-9861(19971208)389:1<34::aid-cne3>3.0.co;2-f. [DOI] [PubMed] [Google Scholar]
- Tucholka A, Fritsch V, Poline JB, Thirion B. An empirical comparison of surface-based and volume-based group studies in neuroimaging. NeuroImage. 2012a doi: 10.1016/j.neuroimage.2012.06.019. [DOI] [PubMed] [Google Scholar]
- Tucholka A, Fritsch V, Poline JB, Thirion B. An empirical comparison of surface-based and volume-based group studies in neuroimaging. NeuroImage. 2012b;63:1443–1453. doi: 10.1016/j.neuroimage.2012.06.019. [DOI] [PubMed] [Google Scholar]
- Van Essen DC. Cerebral cortical folding patterns in primates: Why they vary and what they signify. In: Kaas J, editor. Evolution of the Nervous System. Academic Press; Oxford: 2006. [Google Scholar]
- Van Essen DC, Dierker DL. Surface-based and probabilistic atlases of primate cerebral cortex. Neuron. 2007;56:209–225. doi: 10.1016/j.neuron.2007.10.015. [DOI] [PubMed] [Google Scholar]
- Van Essen DC, Ugurbil K. The future of the human connectome. NeuroImage. 2012;62:1299–1310. doi: 10.1016/j.neuroimage.2012.01.032. [DOI] [PMC free article] [PubMed] [Google Scholar]
- Van Essen DC, Maunsell JH, Bixby JL. The middle temporal visual area in the macaque: myeloarchitecture, connections, functional properties and topographic organization. The Journal of comparative neurology. 1981;199:293–326. doi: 10.1002/cne.901990302. [DOI] [PubMed] [Google Scholar]
- Van Essen DC, et al. The Human Connectome Project: a data acquisition perspective. NeuroImage. 2012a;62:2222–2231. doi: 10.1016/j.neuroimage.2012.02.018. [DOI] [PMC free article] [PubMed] [Google Scholar]
- Van Essen DC, Glasser MF, Dierker D, Harwell J. Cortical parcellations of the Macaque monkey analyzed on surface-based atlases. Cereb Cortex. 2012b;22:2227–2240. doi: 10.1093/cercor/bhr290. doi: 2210.1093/cercor/bhr2290. [DOI] [PMC free article] [PubMed] [Google Scholar]
- Van Essen DC, Glasser MF, Dierker D, Harwell J, Coalson T. Parcellations and hemispheric asymmetries of human cerebral cortex analyzed on surface-based atlases. Cereb Cortex. 2012c;22:2241–2262. doi: 10.1093/cercor/bhr291. doi: 2210.1093/cercor/bhr2291. [DOI] [PMC free article] [PubMed] [Google Scholar]
- Van Essen DC, Smith S, Barch D, Behrens TEJ, Yacoub E, Ugurbil K. The WU-Minn Human Connectome Project: an Overview. Neuroimage (Special issue on Mapping the Connectome) 2013a doi: 10.1016/j.neuroimage.2013.05.041. [DOI] [PMC free article] [PubMed] [Google Scholar]
- Van Essen DC, Jbabdi S, Sotiropoulos SN, Chen C, Dikranian K, Coalson T, Harwell J, Behrens TEJ, Glasser MF. Diffusion MRI. 2. 2013b. Mapping connections in humans and nonhuman primates: Aspirations and challenges for diffusion imaging. in press. [Google Scholar]
- Wandell BA, Winawer J. Imaging retinotopic maps in the human brain. Vision research. 2010 doi: 10.1016/j.visres.2010.08.004. [DOI] [PMC free article] [PubMed] [Google Scholar]
- Wig GS, Laumann TO, Cohen AL, Power JD, Nelson SM, Glasser MF, Miezin FM, Snyder AZ, Schlaggar BL, Petersen SE. Parcellating an Individual Subject’s Cortical and Subcortical Brain Structures Using Snowball Sampling of Resting-State Correlations. Cereb Cortex. 2013 doi: 10.1093/cercor/bht056. [DOI] [PMC free article] [PubMed] [Google Scholar]
- Yeo BT, Krienen FM, Sepulcre J, Sabuncu MR, Lashkari D, Hollinshead M, Roffman JL, Smoller JW, Zollei L, Polimeni JR, Fischl B, Liu H, Buckner RL. The organization of the human cerebral cortex estimated by intrinsic functional connectivity. J Neurophysiol. 2011;106:1125–1165. doi: 10.1152/jn.00338.2011. [DOI] [PMC free article] [PubMed] [Google Scholar]