

Abstract
Mass spectrometry (MS)-based proteomics has become an indispensable tool for protein identification and quantification. In this review, common MS workflows are described, with an emphasis on applications of MS-based proteomics in developmental biology. Progress has been made in the analysis of proteome changes during tissue differentiation and in various genetic perturbations. MS-based proteomics has been particularly useful for identifying novel protein interactions by affinity purification-mass spectrometry (AP-MS), many of which have been subsequently functionally validated and led to the discovery of previously unknown modes of developmental regulation. Quantitative proteomics approaches can be used to study post-translational protein modifications (PTMs) such as phosphorylation, to reveal the dynamics of intracellular signal transduction. Integrative approaches combine quantitative MS-based proteomics with other high-throughput methods, with the promise of a systems level understanding of developmental regulation.
INTRODUCTION
Developmental biology in its modern incarnation grew as an interdisciplinary science at the intersection of embryology, genetics, and molecular biology. It has embraced the advent of “omics” approaches and has greatly benefited from the complete genome sequences of model organisms and an ability to follow the expression of every gene using methods such as global RNA profiling. However, information obtained from genomic experiments is insufficient to fully define cellular functions which are largely carried out by proteins. During organism development, proteins are up- and down-regulated in specific tissues, often without corresponding changes in mRNA abundance 1, post-translationally modified, and engage in interactions with their partners. Proteomics offers a direct way to detect and quantify all of these aspects of protein function, even in complex mixtures. Such experiments can be implemented both on a global scale and in focused, targeted studies. Proteomics has emerged as a powerful new way to analyze how proteins carry out and regulate developmental processes, making it possible to perform experiments that were not feasible before 2, 3. Proteomic approaches complement other types of large-scale surveys of developmental functions, such as genetic screens and, more recently, transcriptomics, RNAi screens and analysis of chromatin architecture.
Recent advances in proteomics have been enabled by the development of instrumentation and analytical software for protein mass spectrometry (MS) 2, 3. In this review, common MS-based proteomic workflows are first described, followed by discussion of specific examples of how proteomics has led to fundamental new insights in developmental biology. Emphasis is on the analysis of proteomes in specific tissues and mutant conditions, discovery of novel protein interactions and regulatory functions by affinity purification-mass spectrometry (AP-MS), analysis of post-translational modifications and the dynamics of cell signaling, and integrative approaches that utilize several different techniques for analyzing complex cellular networks. Most examples are drawn from the animal models; readers interested in application of proteomics to plant development are referred to a recent review 4.
TECHNOLOGY OF MASS SPECTROMETRY-BASED PROTEOMICS
Shotgun Proteomics
Mass spectrometry relies on the use of instruments that are based on a simple principle: they are able to measure the mass of a biological molecule with exquisite precision. Modern mass spectrometers are equipped with sophisticated components and are achieving ever-increasing resolution and sensitivity, yet the underlying principle of accurate mass measurement remains the same. Current approaches in protein MS can be largely divided into shotgun and targeted proteomics 5. Shotgun proteomics (sometimes referred to as discovery, or bottom-up proteomics) is by far the most commonly used method, as it was the first to be developed and is easier to implement. A typical workflow in a shotgun proteomics experiment is outlined in Fig. 1A. Starting with a protein sample, several steps of sample preparation and analysis in a mass spectrometer are carried out with a goal of detecting and identifying as many proteins as possible. Proteins are typically digested with a protease such as trypsin, resulting in a collection of peptides. The peptides are then separated by liquid chromatography (LC), ionized by electrospray ionization (ESI) and sent into the first mass analyzer which detects the mass-to-charge ratios (m/z) of the peptides as they are sequentially eluted during the LC run. This process creates a survey mass spectrum of the sample. In theory, a collection of peptide masses (a “fingerprint”) could unambiguously identify a protein. However, for multi-protein mixtures obtained from complex proteomes this is not feasible, and additional steps of obtaining amino acid sequences of individual peptides are carried out. Peptides are partially fragmented in a collision cell, which creates a random set of shorter peptides that differ from one another by one amino acid. These shorter peptides are then analyzed by a second mass analyzer, which makes it possible to reconstruct the sequence of the peptide based on the known masses of the amino acid side chains (Fig. 1A). The entire procedure is referred to as LC-MS/MS or tandem MS because of the two MS steps.
Figure 1.

Common mass spectrometry-based proteomics workflows. (A) Shotgun proteomics. The goal of shotgun proteomics experiments is to discover and identify as many proteins and their post-translational modifications (PTMs) as possible. An example fragmentation process in the collision cell is shown for a random peptide; this process is repeated for all detected peptides. (B) Targeted proteomics: selected reaction monitoring (SRM). The aim of targeted proteomics studies is to quantify a defined, limited set of proteins with high reproducibility and sensitivity. A single precursor peptide and its single fragment chosen for SRM are highlighted in red throughout the procedure. (C) Quantitative proteomics. The goal is to quantify differences in protein abundance between two or more samples, which is achieved by differential labeling of proteins or peptides with stable isotopes. This approach can be used both with shotgun and targeted proteomics methods. (D) Analysis of PTMs. Identification of PTMs is possible due to a mass shift that is characteristic for a particular modification. In the example shown, phosphorylation shifts the mass of a peptide by 80 Da. Abbreviations: LC, liquid chromatography; ESI, electrospray ionization. See text for more details.
Since a complex protein sample can generate hundreds and even thousands of peptides, it is difficult to determine the sequence of each peptide entirely from the raw MS/MS data. To aid in peptide identification, bioinformatics analysis of the raw data is performed by comparing the actual spectra with a protein sequence database for the respective organism, digested in silico. Clearly, a high-quality proteome annotation is critical for successful identification of proteins in shotgun proteomics experiments. Generally, the greater the number of peptides matched with the database for any given protein, the higher the confidence of this protein’s identification. The output from a shotgun proteomics experiment is thus a list of identified proteins that are likely to be present in the starting sample (Fig. 1A). Modern mass spectrometers can now identify hundreds of proteins in complex mixtures in a single LC-MS/MS experiment. The same workflow can be used to search for post-translational protein modifications, because they result in a characteristic shift in mass of the modified peptide by a known amount (Fig. 1D).
Targeted Proteomics: Selected Reaction Monitoring (SRM)
While shotgun proteomics is a good approach to identify proteins in samples whose composition is not known a priori, the method relies on a stochastic nature of peptide detection, which is driven by identification of highly abundant proteins. In order to increase reproducibility and sensitivity of detection, targeted proteomics approaches are being developed. In this mode, researchers deliberately focus on a defined set of proteins of interest in the sample, while ignoring all others. Because of the focus on specific peptides, this approach is referred to as selected reaction monitoring (SRM, also known as multiple reaction monitoring or MRM) 6. SRM methods rely on the use of a modified MS workflow performed on triple quadrupole instruments (Fig. 1B). Sample preparation in terms of trypsin digestion and LC/ESI is similar, but the first mass analyzer is tuned to select only a single specific peptide for a given protein. This peptide is then fragmented in the collision cell, and the second mass analyzer is also set up to measure only a single fragment species from that peptide. The output of such a procedure is referred to as a transition and is a plot of the detected specific fragment intensity over time. Focusing on a single peptide followed by selection of a single product of its fragmentation dramatically increases both the sensitivity and reproducibility of protein detection, making it possible to reliably monitor even low-abundance proteins in complex samples.
SRM assays require prior optimization of the whole procedure, starting from a selection of “good” peptides representing the protein of interest (sometimes referred to as “proteotypic peptides”), and including standardization of every step. Because of a requirement for up-front assay development, SRM applications have been less widespread than shotgun proteomics studies, but their use is likely to broaden as the proteomes are better defined and proteotypic peptide libraries are developed. Large-scale efforts to define detectable proteomes are underway for several model systems, with central repositories such as PeptideAtlas serving as aggregating databases.
Quantitative Proteomics
The stochastic nature of MS detection makes it impossible to determine the amount of a given peptide without using reference standards. However, it is often desirable to know the exact amount of protein in a given sample, and to be able to compare protein abundances between different samples. Several methods have been developed for both absolute and relative quantification of proteins in MS experiments 3, 7. Most methods make use of stable isotope labeling of proteins or peptides, though label-free quantification approaches have also been developed. During MS analysis, differentially labeled peptides whose masses may differ by as little as a few daltons can be reliably distinguished, and when compared to each other within a single experiment, provide quantitative information about the relative abundances of each isoform (Fig. 1C).
A variety of labeling approaches are available, which can be broadly divided into in vivo (or metabolic) and in vitro (chemical) labeling. In metabolic labeling, an organism or a cell line is raised on media containing a precursor labeled with stable (non-radioactive) isotopes which is incorporated into all proteins without affecting their function. In the most popular version of metabolic labeling, termed stable-isotope labeling by amino acids in cell culture (SILAC), an organism or a cell line is grown on media containing lysine or arginine with a precisely defined number of 13C and 15N atoms, making it possible to multiplex the assay 8. Successful SILAC-based MS experiments are critically dependent on a complete substitution of the natural amino acid with a labeled one, and this has now been achieved for many organisms including yeast, flies, and mice. In the simplest setup, labeled and unlabeled samples from two experimental conditions are analyzed either by a shotgun MS workflow or SRM (Fig. 1A, B). The labeled and unlabeled forms of each peptide are distinguished by a defined isotopic shift, and their ratios are quantified in a mass spectrometer (Fig. 1C). The result is a list of relative peptide (and hence protein) abundances in two samples.
In chemical, or in vitro labeling, protein samples are obtained from two or more experimental conditions, and the proteins or peptides are then chemically labeled with stable isotope-containing reagents. Lately, a procedure employing isobaric tags for relative and absolute quantitation (iTRAQ) and its variations have been gaining in popularity 9, and simpler (and cheaper) approaches such as dimethyl labeling have also been developed 10. Similar to metabolic labeling, samples are analyzed in a shotgun or SRM workflow, and the relative protein abundances are determined by comparing the intensities of two or more isotopic isoforms derived from the same peptide.
The two main labeling methods (SILAC and in vitro approaches) each have advantages and pitfalls. The main advantage of SILAC is the absence of a need for chemical derivatization steps that may add to the experimental error. However, the extent of labeling is critical for a successful experiment and can pose a challenge for certain organisms. While chemical labeling requires more extensive sample processing than SILAC and is more costly, it allows for higher multiplexing and can be applied to samples not amenable to metabolic labeling 9.
APPLICATIONS OF MASS SPECTROMETRY-BASED PROTEOMICS IN DEVELOPMENTAL BIOLOGY
Profiling Developmental Changes Using Proteomics
What possibilities are offered by modern protein MS to developmental biologists? Despite certain challenges pertaining to the inherent complexity of the proteome (Box 1), MS-based proteomics approaches have been successfully applied in several areas of developmental biology. One of the basic aspects of development is the process of cell and tissue differentiation, and many MS-based proteomics studies have been directed at analyzing the differences in protein composition in various organs and tissues. In Drosophila, tissue-specific proteomes were studied in embryos and adult heads, male reproductive system, sperm, wing imaginal discs, larval hemolymph, and neuropeptides (reviewed in 13). A similar comparative analysis has been carried out in a study of adult zebrafish organs 14. Recent advances in instrumentation and sample preparation are yielding an ever-increasing coverage of the tissue-specific proteomes, e.g. the cardiac proteome in the mouse 15 and Drosophila 16. Many tissue profiling experiments have been aided by separation of proteins on two-dimensional gels prior to MS. In a recent example, differences between the ectoderm and mesoderm in early Xenopus embryos were analyzed using two-dimensional difference gel electrophoresis (DiGE) followed by MS identification of the differentially expressed proteins 17. In a creative application of differential isotope labeling to study tissue-specific proteins, female flies metabolically labeled with 15N were mated with unlabeled males, and the male seminal fluid transferred at mating was then analyzed in dissected female reproductive tracts, allowing an unambiguous differentiation between the male and female proteins 18, 19. This type of analysis would not be possible without the use of proteomics.
BOX 1: Challenges of Working With Complex Tissues.
Three important challenges have been encountered when MS-based proteomics methods were applied to study proteins from cells and organisms. The first one stems from an enormous dynamic range in protein abundance that exists in cells, from just a few molecules to thousands of copies per cell. The second relates to the compositional complexity of samples obtained even from a single type of cells. Thus, an average mammalian cell can express over 10,000 polypeptides that can differ in abundance over several orders of magnitude 1, 3. These challenges of protein heterogeneity pose a problem for shotgun proteomics, with its tendency to detect more abundant proteins. To overcome these issues, various methods of sample fractionation and enrichment have been developed, ranging from traditional one- and two-dimensional gel electrophoresis to sophisticated affinity-based methods that enrich for a class of proteins or modifications of interest 3, 7, 11. In addition, better peptide chromatography procedures help tackle proteome complexity. A third challenge in working with complex samples is caused by the limitations in MS sensitivity and a requirement for a significant amount of input material for reliable protein identification (i.e. on the order of 106 cells). However, recent instrument improvements have pushed the sensitivity of mass spectrometers to a new level, making it possible to identify proteins from small cell populations, such as those obtainable by FACS 11. Improved resolution of modern MS approaches allows a near-complete identification of all proteins from simpler organisms such as yeast 12, and it will soon be possible to identify almost all expressed proteins in cells from higher eukaryotes in a single experiment 3.
Proteomics is also being used to map changes in protein expression during development as a function of time, in an ever-increasing number of studies in different model systems. For example, maternal-to-zygotic transition (MZT) was studied in Drosophila using 15N metabolically labeled embryos 20. This study uncovered widespread post-transcriptional downregulation of maternally expressed proteins during MZT. 15N metabolic labeling was also recently applied to map proteome changes in C. elegans ontogenesis 21. In the mouse, the proteomes of oocytes at different stages were compared 22, and in another example, proteomics was used to profile postnatal intestinal development 23. In two interesting studies, MS-based proteomics revealed that caste differentiation in bees and wasps is detectable at the protein level earlier than previously thought 24, 25. A study on gastropod embryo development is noteworthy because the authors had to use de novo peptide and protein identification as the genome sequence of their model organism was unavailable 26.
In tune with the growth of interest in stem cell biology, MS-based proteomics has been applied to study the differentiation of stem cells. Starting with the first proteomic profiling of human embryonic stem cells 27, proteomics has been employed to study many aspects of stem cell biology 11. For example, many novel cell surface markers of mouse embryo-derived stem cell lines were identified using MS 28. These findings guided validation of antibodies that were subsequently used for isolation of viable lineage progenitors from blastocyst stage embryos by flow cytometry 28.
Using Genetics in Combination with Proteomics to Analyze Development
Genetic approaches have contributed tremendously to our understanding of developmental pathways and regulatory mechanisms. MS-based proteomics opens up new possibilities to analyze changes in cellular proteomes using mutants and other genetic perturbations. One of the early efforts compared genetically ventralized and lateralized Drosophila embryos and identified proteins involved in ventral furrow morphogenesis during gastrulation 29. Metabolic 15N labeling was used to discover proteins with altered abundance in the daf-2 mutant of C. elegans, shedding light on dauer formation, insulin signaling, and the aging process 30. SILAC-labeled worms were recently used to identify proteins that are up- or down-regulated in nuclear hormone receptor 49 (nhr-49) mutants and RNAi knockdown animals, revealing downregulation of enzymes related to lipid metabolism 31. In a pioneering application of SILAC to label a whole mammalian organism, proteome changes were studied in kindlin-3 (Fermt3) mutant mice, which uncovered a network of proteins required for normal erythrocyte development 32. Analysis of protein abundance in germline-lacking tudor mutants of Drosophila in combination with SILAC labeling of flies made it possible to discriminate whether sex-specific proteins originated in the germline or somatic tissue 33.
One recently developed application of MS-based proteomics is identification of microRNA (miRNA) targets, which is of interest for developmental biology, given widespread gene regulation by microRNAs. Proteomics is particularly suitable for identifying targets of miRNA regulation, because much of this regulation occurs at the posttranscriptional level. Several studies performed miRNA overexpression or knockdown in cultured cells followed by a SILAC-based quantification of protein abundance, which revealed a widespread effect on protein translation as a consequence of perturbing even a single miRNA 34–36.
Discovery of Novel Protein Interactions by Affinity Purification-Mass Spectrometry (AP-MS)
Many developmental regulatory mechanisms involve modulation of a protein’s activity through its binding to other proteins. MS-based proteomics has been particularly successful at analyzing protein-protein interactions (PPIs) important in development. Binary PPIs have been studied by yeast two hybrid methods, however MS-based proteomics can be applied to the analysis of complexes formed in living cells, thus better approximating the cellular environment in which proteins interact. Over the years, a method of choice for analyzing PPIs has been affinity purification-mass spectrometry (AP-MS) 37. A typical AP-MS workflow is shown in Fig. 2. A protein of interest is tagged with an affinity tag, expressed in cultured cells or in the organism, then a protein complex containing the bait and associated subunits is purified using one or two affinity steps, followed by analysis of the components with LC-MS/MS. A variety of tags have been used in this workflow, with tandem affinity purification (TAP) tags used for both large-scale and focused projects (reviewed in 13, 37). More recently, single-step purification approaches employing streptavidin binding peptide (SBP) and other tags have been shown to be as effective as TAP 38, 39. The advantages of single-step purification are a significant reduction in time and the potential to identify transiently or weakly associated components.
Figure 2.
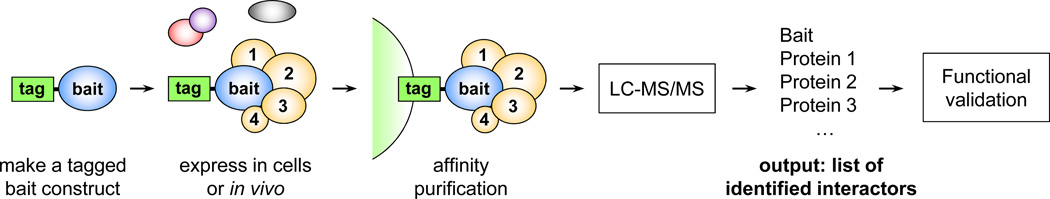
Affinity purification-mass spectrometry (AP-MS) workflow. A protein of interest is tagged with an affinity tag and expressed in cultured cells or in vivo. The bait protein and associated subunits are purified using one or more affinity steps, followed by LC-MS/MS identification of components. Novel associations are validated in functional studies.
The output from an AP-MS experiment is a list of putative interacting partners of the protein used as bait (Fig. 2). The identities of the interactors can provide insight into the function of the bait protein through the “guilt by association” principle. In that respect, AP-MS experiments can be viewed as being complementary to genetics screens. Both types of approaches can be used to map and characterize a particular cellular pathway, albeit from somewhat different angles. While genetic screening interrogates gene function and does not assume a direct interaction between components, AP-MS experiments identify an immediate protein interaction network of a protein of interest, without necessarily assigning functional significance to the interactions. PPI data can enrich genetics by providing a molecular framework for interpreting the results of genetic screens, and can even extend the reach of genetics by revealing components that may be missed in a genetic screen. However, because of the functionally unbiased nature of the AP-MS experiments and a potential for identifying false positives, the list of interactors should be considered to be putative until interactions are validated in independent assays and followed up with functional studies.
Several novel protein interactions identified by AP-MS and functionally validated have led to the discovery of new developmental regulatory mechanisms. Some examples of these studies are listed in Table 1. These examples clearly demonstrate that AP-MS has become a powerful technique to advance our knowledge of developmental regulation in different organisms. AP-MS analysis of eukaryotic protein complexes on a large scale has until recently been only carried out in yeast 37. This gap has been filled by a study in Drosophila which determined the largest protein interaction map generated by an AP-MS approach for a metazoan 50. Though this and many other AP-MS studies employed cell culture as an accessible experimental system and/or mild overexpression, it is clear that many of the interactions identified this way are biologically meaningful (Table 1). However, arguably the best approach to isolate protein complexes is to use transgenic organisms in which the endogenous gene is replaced with a tagged isoform, as has been done in a number of studies 45, 47, 51.
Table 1.
Novel protein associations and corresponding developmental regulatory mechanisms identified by affinity purification-mass spectrometry (AP-MS).
| Organism | Bait | Interactor(s) | Tag | Source cell type | Validated function | References |
|---|---|---|---|---|---|---|
| Worm | MIS-12, KBP-1 | 10 kinetochore proteins | LAP (GFP-S) | Transgenic worms | Outer kinetochore assembly, chromosome segregation | 40 |
| Worm | DCR-1 | Several associated proteins | 8xHA | Transgenic worms | Role of DCR-1 in multiple small-RNA-mediated pathways | 41 |
| Fly | Deltex (Dx) | Kurtz (Krz) | TAP (ProtA-CBP) | Stable Kc167 cell line | Downregulation of Notch signaling | 42 |
| Fly | Archipelago (Ago/Fbxw7) | Myc (dm) | TAP (ProtA-CBP) | Stable Kc167 cell line | Degradation of Myc, control of cell growth | 43 |
| Fly | Myopic (Mop/PTPN23) | Yorkie (Yki) | GS-TAP (ProtG-SBP) | Stable S2 cell line | Endocytic regulation of Yorkie/Hippo signaling | 38 |
| Zebrafish | Elipsa | Intraflagellartransport (IFT) particle proteins | TAP (ProtA-CBP) | Transfected zebrafish embryos | Regulation of intraflagellartransport andciliogenesis | 44 |
| Mouse | Cyclin D1 | Transcription factors | FLAG-HA | Mouse organs from tagged knock-in lines | Transcriptional function of Cyclin D1 in development | 45 |
| Mouse | Oct4 (POU5F1) | Several associated proteins | 3xFLAG and 3xFLAG-CBP | Embryonic stem cell lines | Expanded view of Oct4 regulatory network and pluripotent cell identity | 46, 47 |
| Human | Disheveled (Dvl) | KLHL12, Cullin-3 (CUL3) | SBP-HA-CBP | Stable HEK293T cell line | Degradation of Dsh, downregulation of Wnt signaling | 48 |
| Human | WTX (FAM123B) | β-catenin, other proteins | SBP-HA-CBP | Stable HEK293T cell line | Degradation of β-catenin, downregulation of Wnt signaling | 49 |
Exciting new developments of the AP-MS technique are starting to be implemented. Various mutations can be introduced into the bait protein and assessed for their effect on complex composition, and changes in protein interactions can also be studied in mutant organisms 2. It is now possible to use quantitative proteomics to analyze changes in complex composition during development, as was done using iTRAQ labeling to study Cyclin E-associated proteins in adult vs. embryo mouse brain 52. Transient or unstable interactions can be revealed by using in vivo cross-linking strategies 53, 54. As only a small fraction of the total PPI space is currently known, AP-MS will continue being a useful tool for identifying new protein interactions and modes of regulation in development.
Analysis of Post-Translational Modifications (PTMs) and Cell Signaling
In addition to PPIs, a common regulatory mechanism to modify protein activity during development is post-translational modifications (PTMs). The most widespread regulatory PTM is phosphorylation, however many other kinds of PTMs are known to be developmentally important, including acetylation, ubiquitination, sumoylation, and glycosylation. MS-based proteomics is extremely well suited to study PTMs because a modified peptide is visible in a mass spectrum as a peak shifted by a characteristic mass value (see Fig. 1D). For an in-depth review of the technology and applications of phosphoproteomics, see a review by M. Jünger in this series.
In one of the earliest comprehensive studies of PTMs by MS, a quantitative temporal analysis of EGFR phosphorylation was carried out by Mann and colleagues using SILAC labeled HeLa cells 55. This study revealed thousands of protein phosphorylation events during the cellular response to EGFR stimulation and showed that phosphorylated proteins can be grouped into clusters with different temporal profiles. Quantification of signaling dynamics was taken to a new level in a recent study in which AP-MS was used in combination with SRM (in the so-called AP-SRM method) to follow quantitative changes in protein complex composition and phosphorylation events involving signaling adaptor GRB2, after stimulation of HEK293T cells with growth factors 56. This analysis revealed both the core interactors as well as growth-factor stimulated GRB2 associations, and also assigned interactions to specific domains with the use of mutated GRB2 isoforms.
Few studies have directly analyzed PTMs in development. A comprehensive survey of protein phosphorylation landscape in the Drosophila embryos identified 13,720 different phosphorylation sites in 2,702 proteins 57. In a recent study, phosphorylation events were analyzed during egg to larva transition in a polychaete 58. Evidence for significant changes in the phosphoproteome during development was obtained by comparing phosphorylation sites in neonatal vs. adult brain in the mouse 59.
In addition to phosphorylation, other kinds of developmentally important PTMs are starting to be investigated with MS-based proteomics. For example, glycosylation of the Notch receptor, which is central to the regulation of Notch signaling, was studied with a focus on the sites and dynamics of glycosylation events 60–62. Analysis of sumoylation in the early Drosophila embryos has identified multiple targets and implicated sumoylation of Ras as an important developmental regulatory mechanism 63.
Integrative Approaches
A broader utility of MS-based proteomics as an indispensable part of systems biology approaches is evident from emerging integrative studies that combine proteomics with other high-throughput methods, such as transcriptomics. In one example, a chromatin remodeling regulator ISWI was knocked down by RNAi in Drosophila SL2 cells, and the resulting global changes in the transcriptome and the proteome were quantified 64. This study revealed a widespread non-correlation between changes in protein and transcript levels, suggesting a significant extent of post-transcriptional control of protein abundance in response to perturbation of a major chromatin component. In another example of an integrative approach, data from systematic RNAi screens in Drosophila cultured cells were combined with the phosphosite data from the study mentioned above 57 to construct a JNK (basket) regulatory network 65. This study provided a systems view of JNK signaling, highlighting functional modules and their interconnections via specific protein phosphorylation sites 65. A similar approach which combined RNAi screens with AP-MS analysis of protein complexes has comprehensively characterized the RTK-Ras-ERK signaling network and revealed several previously unknown regulators 66. One of the most comprehensive recent studies tracked a human individual for 14 months with detailed genomic, transcriptomic, metabolomic, and proteomic analyses and revealed changes that correlated with healthy and diseased states occurring during that time period 67.
CONCLUSION
It is not an exaggeration to say that MS-based proteomics has established itself as an integral component of systems biology approaches, contributing to an emerging discipline of “systems developmental biology” 68. We are now in a wave of a “third generation proteomics” that strives to achieve a multidimensional view of proteomes by analyzing protein localization, turnover, and isoforms, in addition to absolute and relative quantification and the study of PPIs and PTMs 69. Some of the emerging technologies in biological MS include the development of top-down proteomics (analysis of intact proteins) as opposed to bottom-up (shotgun) methods, with the obvious advantage of obviating the need for extra sample preparation steps such as proteolytic digestion. As proteotypic peptide libraries become more widespread, the difference between the shotgun and targeted (SRM) methods may become less distinct 5. Many analyses are shifting towards protein quantification, in addition to simple identification. While issues related to proteome complexity (Box 1) remain a challenge, there is little doubt that advances in MS-based proteomics technologies will lead to new and unique insights into the regulation of developmental processes.
ACKNOWLEDGEMENTS
The author thanks Kenneth Kleene and members of the Veraksa lab for helpful comments on the manuscript. This work was supported by NIH grants GM097727 and CA156734, and NSF grant 0640700 to A.V.
Footnotes
FURTHER READING/RESOURCES
A special issue of the Journal of Proteomics, “Model Organism Proteomics”, vol. 73, issue 11, October 2010. http://www.sciencedirect.com/science/journal/18743919/73/11
A special issue of Molecular and Cellular Proteomics, “PROSPECTS: Proteomics in Space and Time”, vol. 11, No. 3, March 2012. http://www.mcponline.org/content/11/3.toc
PeptideAtlas: http://www.peptideatlas.org/
REFERENCES
- 1.Schwanhausser B, Busse D, Li N, Dittmar G, Schuchhardt J, Wolf J, Chen W, Selbach M. Global quantification of mammalian gene expression control. Nature. 2011;473:337–342. doi: 10.1038/nature10098. [DOI] [PubMed] [Google Scholar]
- 2.Gstaiger M, Aebersold R. Applying mass spectrometry-based proteomics to genetics, genomics and network biology. Nat Rev Genet. 2009;10:617–627. doi: 10.1038/nrg2633. [DOI] [PubMed] [Google Scholar]
- 3.Cox J, Mann M. Quantitative, high-resolution proteomics for data-driven systems biology. Annu Rev Biochem. 2011;80:273–299. doi: 10.1146/annurev-biochem-061308-093216. [DOI] [PubMed] [Google Scholar]
- 4.Kaufmann K, Smaczniak C, de Vries S, Angenent GC, Karlova R. Proteomics insights into plant signaling and development. Proteomics. 2011;11:744–755. doi: 10.1002/pmic.201000418. [DOI] [PubMed] [Google Scholar]
- 5.Angel TE, Aryal UK, Hengel SM, Baker ES, Kelly RT, Robinson EW, Smith RD. Mass spectrometry-based proteomics: existing capabilities and future directions. Chem Soc Rev. 2012;41:3912–3928. doi: 10.1039/c2cs15331a. [DOI] [PMC free article] [PubMed] [Google Scholar]
- 6.Picotti P, Aebersold R. Selected reaction monitoring-based proteomics: workflows, potential, pitfalls and future directions. Nat Methods. 2012;9:555–566. doi: 10.1038/nmeth.2015. [DOI] [PubMed] [Google Scholar]
- 7.Elliott MH, Smith DS, Parker CE, Borchers C. Current trends in quantitative proteomics. J Mass Spectrom. 2009;44:1637–1660. doi: 10.1002/jms.1692. [DOI] [PubMed] [Google Scholar]
- 8.Mann M. Functional and quantitative proteomics using SILAC. Nat Rev Mol Cell Biol. 2006;7:952–958. doi: 10.1038/nrm2067. [DOI] [PubMed] [Google Scholar]
- 9.Li Z, Adams RM, Chourey K, Hurst GB, Hettich RL, Pan C. Systematic comparison of label-free, metabolic labeling, and isobaric chemical labeling for quantitative proteomics on LTQ Orbitrap Velos. J Proteome Res. 2012;11:1582–1590. doi: 10.1021/pr200748h. [DOI] [PubMed] [Google Scholar]
- 10.Kovanich D, Cappadona S, Raijmakers R, Mohammed S, Scholten A, Heck AJ. Applications of stable isotope dimethyl labeling in quantitative proteomics. Anal Bioanal Chem. 2012;404:991–1009. doi: 10.1007/s00216-012-6070-z. [DOI] [PubMed] [Google Scholar]
- 11.van Hoof D, Krijgsveld J, Mummery C. Proteomic analysis of stem cell differentiation and early development. Cold Spring Harb Perspect Biol. 2012;4 doi: 10.1101/cshperspect.a008177. [DOI] [PMC free article] [PubMed] [Google Scholar]
- 12.Nagaraj N, Kulak NA, Cox J, Neuhauser N, Mayr K, Hoerning O, Vorm O, Mann M. System-wide perturbation analysis with nearly complete coverage of the yeast proteome by single-shot ultra HPLC runs on a bench top Orbitrap. Mol Cell Proteomics. 2012;11:M111 013722. doi: 10.1074/mcp.M111.013722. [DOI] [PMC free article] [PubMed] [Google Scholar]
- 13.Veraksa A. When peptides fly: advances in Drosophila proteomics. J Proteomics. 2010;73:2158–2170. doi: 10.1016/j.jprot.2010.05.006. [DOI] [PubMed] [Google Scholar]
- 14.Abramsson A, Westman-Brinkmalm A, Pannee J, Gustavsson M, von Otter M, Blennow K, Brinkmalm G, Kettunen P, Zetterberg H. Proteomics profiling of single organs from individual adult zebrafish. Zebrafish. 2010;7:161–168. doi: 10.1089/zeb.2009.0644. [DOI] [PubMed] [Google Scholar]
- 15.Bousette N, Kislinger T, Fong V, Isserlin R, Hewel JA, Emil A, Gramolini AO. Large-scale characterization and analysis of the murine cardiac proteome. J Proteome Res. 2009;8:1887–1901. doi: 10.1021/pr800845a. [DOI] [PubMed] [Google Scholar]
- 16.Cammarato A, Ahrens CH, Alayari NN, Qeli E, Rucker J, Reedy MC, Zmasek CM, Gucek M, Cole RN, Van Eyk JE, et al. A mighty small heart: the cardiac proteome of adult Drosophila melanogaster. PLoS One. 2011;6:e18497. doi: 10.1371/journal.pone.0018497. [DOI] [PMC free article] [PubMed] [Google Scholar]
- 17.Wang R, Liu X, Kuster-Schock E, Fagotto F. Proteomic Analysis of Differences in Ectoderm and Mesoderm Membranes by DiGE. J Proteome Res. 2012;11:4575–4593. doi: 10.1021/pr300379m. [DOI] [PubMed] [Google Scholar]
- 18.Findlay GD, Yi X, Maccoss MJ, Swanson WJ. Proteomics reveals novel Drosophila seminal fluid proteins transferred at mating. PLoS Biol. 2008;6:e178. doi: 10.1371/journal.pbio.0060178. [DOI] [PMC free article] [PubMed] [Google Scholar]
- 19.Findlay GD, MacCoss MJ, Swanson WJ. Proteomic discovery of previously unannotated, rapidly evolving seminal fluid genes in Drosophila. Genome Res. 2009;19:886–896. doi: 10.1101/gr.089391.108. [DOI] [PMC free article] [PubMed] [Google Scholar]
- 20.Gouw JW, Pinkse MW, Vos HR, Moshkin Y, Verrijzer CP, Heck AJ, Krijgsveld J. In vivo stable isotope labeling of fruit flies reveals post-transcriptional regulation in the maternal-to-zygotic transition. Mol Cell Proteomics. 2009;8:1566–1578. doi: 10.1074/mcp.M900114-MCP200. [DOI] [PMC free article] [PubMed] [Google Scholar]
- 21.Geillinger KE, Kuhlmann K, Eisenacher M, Meyer HE, Daniel H, Spanier B. Dynamic Changes of the Caenorhabditis elegans Proteome during Ontogenesis Assessed by Quantitative Analysis with (15)N Metabolic Labeling. J Proteome Res. 2012;11:4594–4604. doi: 10.1021/pr300385v. [DOI] [PubMed] [Google Scholar]
- 22.Wang S, Kou Z, Jing Z, Zhang Y, Guo X, Dong M, Wilmut I, Gao S. Proteome of mouse oocytes at different developmental stages. Proc Natl Acad Sci U S A. 2010;107:17639–17644. doi: 10.1073/pnas.1013185107. [DOI] [PMC free article] [PubMed] [Google Scholar]
- 23.Hansson J, Panchaud A, Favre L, Bosco N, Mansourian R, Benyacoub J, Blum S, Jensen ON, Kussmann M. Time-resolved quantitative proteome analysis of in vivo intestinal development. Mol Cell Proteomics. 2011;10:M110 005231. doi: 10.1074/mcp.M110.005231. [DOI] [PMC free article] [PubMed] [Google Scholar]
- 24.Li J, Wu J, Begna Rundassa D, Song F, Zheng A, Fang Y. Differential protein expression in honeybee (Apis mellifera L.) larvae: underlying caste differentiation. PLoS One. 2010;5:e13455. doi: 10.1371/journal.pone.0013455. [DOI] [PMC free article] [PubMed] [Google Scholar]
- 25.Hunt JH, Wolschin F, Henshaw MT, Newman TC, Toth AL, Amdam GV. Differential gene expression and protein abundance evince ontogenetic bias toward castes in a primitively eusocial wasp. PLoS One. 2010;5:e10674. doi: 10.1371/journal.pone.0010674. [DOI] [PMC free article] [PubMed] [Google Scholar]
- 26.Sun J, Zhang Y, Thiyagarajan V, Qian PY, Qiu JW. Protein expression during the embryonic development of a gastropod. Proteomics. 2010;10:2701–2711. doi: 10.1002/pmic.200900846. [DOI] [PubMed] [Google Scholar]
- 27.Van Hoof D, Passier R, Ward-Van Oostwaard D, Pinkse MW, Heck AJ, Mummery CL, Krijgsveld J. A quest for human and mouse embryonic stem cell-specific proteins. Mol Cell Proteomics. 2006;5:1261–1273. doi: 10.1074/mcp.M500405-MCP200. [DOI] [PubMed] [Google Scholar]
- 28.Rugg-Gunn PJ, Cox BJ, Lanner F, Sharma P, Ignatchenko V, McDonald AC, Garner J, Gramolini AO, Rossant J, Kislinger T. Cell-surface proteomics identifies lineage-specific markers of embryo-derived stem cells. Dev Cell. 2012;22:887–901. doi: 10.1016/j.devcel.2012.01.005. [DOI] [PMC free article] [PubMed] [Google Scholar]
- 29.Gong L, Puri M, Unlu M, Young M, Robertson K, Viswanathan S, Krishnaswamy A, Dowd SR, Minden JS. Drosophila ventral furrow morphogenesis: a proteomic analysis. Development. 2004;131:643–656. doi: 10.1242/dev.00955. [DOI] [PubMed] [Google Scholar]
- 30.Dong MQ, Venable JD, Au N, Xu T, Park SK, Cociorva D, Johnson JR, Dillin A, Yates JR., 3rd Quantitative mass spectrometry identifies insulin signaling targets in C. elegans. Science. 2007;317:660–663. doi: 10.1126/science.1139952. [DOI] [PubMed] [Google Scholar]
- 31.Fredens J, Engholm-Keller K, Giessing A, Pultz D, Larsen MR, Hojrup P, Moller-Jensen J, Faergeman NJ. Quantitative proteomics by amino acid labeling in C. elegans. Nat Methods. 2011;8:845–847. doi: 10.1038/nmeth.1675. [DOI] [PubMed] [Google Scholar]
- 32.Kruger M, Moser M, Ussar S, Thievessen I, Luber CA, Forner F, Schmidt S, Zanivan S, Fassler R, Mann M. SILAC mouse for quantitative proteomics uncovers kindlin-3 as an essential factor for red blood cell function. Cell. 2008;134:353–364. doi: 10.1016/j.cell.2008.05.033. [DOI] [PubMed] [Google Scholar]
- 33.Sury MD, Chen JX, Selbach M. The SILAC fly allows for accurate protein quantification in vivo. Mol Cell Proteomics. 2010;9:2173–2183. doi: 10.1074/mcp.M110.000323. [DOI] [PMC free article] [PubMed] [Google Scholar]
- 34.Selbach M, Schwanhausser B, Thierfelder N, Fang Z, Khanin R, Rajewsky N. Widespread changes in protein synthesis induced by microRNAs. Nature. 2008;455:58–63. doi: 10.1038/nature07228. [DOI] [PubMed] [Google Scholar]
- 35.Yang Y, Chaerkady R, Kandasamy K, Huang TC, Selvan LD, Dwivedi SB, Kent OA, Mendell JT, Pandey A. Identifying targets of miR-143 using a SILAC-based proteomic approach. Mol Biosyst. 2010;6:1873–1882. doi: 10.1039/c004401f. [DOI] [PMC free article] [PubMed] [Google Scholar]
- 36.Lossner C, Meier J, Warnken U, Rogers MA, Lichter P, Pscherer A, Schnolzer M. Quantitative proteomics identify novel miR-155 target proteins. PLoS One. 2011;6:e22146. doi: 10.1371/journal.pone.0022146. [DOI] [PMC free article] [PubMed] [Google Scholar]
- 37.Gavin AC, Maeda K, Kuhner S. Recent advances in charting protein-protein interaction: mass spectrometry-based approaches. Curr Opin Biotechnol. 2011;22:42–49. doi: 10.1016/j.copbio.2010.09.007. [DOI] [PubMed] [Google Scholar]
- 38.Gilbert MM, Tipping M, Veraksa A, Moberg KH. A Screen for Conditional Growth Suppressor Genes Identifies the Drosophila Homolog of HD-PTP as a Regulator of the Oncoprotein Yorkie. Dev Cell. 2011;20:700–712. doi: 10.1016/j.devcel.2011.04.012. [DOI] [PMC free article] [PubMed] [Google Scholar]
- 39.Rees JS, Lowe N, Armean IM, Roote J, Johnson G, Drummond E, Spriggs H, Ryder E, Russell S, St Johnston D, et al. In vivo analysis of proteomes and interactomes using Parallel Affinity Capture (iPAC) coupled to mass spectrometry. Mol Cell Proteomics. 2011;10:M110 002386. doi: 10.1074/mcp.M110.002386. [DOI] [PMC free article] [PubMed] [Google Scholar]
- 40.Cheeseman IM, Niessen S, Anderson S, Hyndman F, Yates JR, 3rd, Oegema K, Desai A. A conserved protein network controls assembly of the outer kinetochore and its ability to sustain tension. Genes Dev. 2004;18:2255–2268. doi: 10.1101/gad.1234104. [DOI] [PMC free article] [PubMed] [Google Scholar]
- 41.Duchaine TF, Wohlschlegel JA, Kennedy S, Bei Y, Conte D, Jr, Pang K, Brownell DR, Harding S, Mitani S, Ruvkun G, et al. Functional proteomics reveals the biochemical niche of C. elegans DCR-1 in multiple small-RNA-mediated pathways. Cell. 2006;124:343–354. doi: 10.1016/j.cell.2005.11.036. [DOI] [PubMed] [Google Scholar]
- 42.Mukherjee A, Veraksa A, Bauer A, Rosse C, Camonis J, Artavanis-Tsakonas S. Regulation of Notch signalling by non-visual beta-arrestin. Nat Cell Biol. 2005;7:1191–1201. doi: 10.1038/ncb1327. [DOI] [PubMed] [Google Scholar]
- 43.Moberg KH, Mukherjee A, Veraksa A, Artavanis-Tsakonas S, Hariharan IK. The Drosophila F box protein archipelago regulates dMyc protein levels in vivo. Curr Biol. 2004;14:965–974. doi: 10.1016/j.cub.2004.04.040. [DOI] [PubMed] [Google Scholar]
- 44.Omori Y, Zhao C, Saras A, Mukhopadhyay S, Kim W, Furukawa T, Sengupta P, Veraksa A, Malicki J. Elipsa is an early determinant of ciliogenesis that links the IFT particle to membrane-associated small GTPase Rab8. Nat Cell Biol. 2008;10:437–444. doi: 10.1038/ncb1706. [DOI] [PubMed] [Google Scholar]
- 45.Bienvenu F, Jirawatnotai S, Elias JE, Meyer CA, Mizeracka K, Marson A, Frampton GM, Cole MF, Odom DT, Odajima J, et al. Transcriptional role of cyclin D1 in development revealed by a genetic-proteomic screen. Nature. 2010;463:374–378. doi: 10.1038/nature08684. [DOI] [PMC free article] [PubMed] [Google Scholar]
- 46.Pardo M, Lang B, Yu L, Prosser H, Bradley A, Babu MM, Choudhary J. An expanded Oct4 interaction network: implications for stem cell biology, development, and disease. Cell Stem Cell. 2010;6:382–395. doi: 10.1016/j.stem.2010.03.004. [DOI] [PMC free article] [PubMed] [Google Scholar]
- 47.van den Berg DL, Snoek T, Mullin NP, Yates A, Bezstarosti K, Demmers J, Chambers I, Poot RA. An Oct4-centered protein interaction network in embryonic stem cells. Cell Stem Cell. 2010;6:369–381. doi: 10.1016/j.stem.2010.02.014. [DOI] [PMC free article] [PubMed] [Google Scholar]
- 48.Angers S, Thorpe CJ, Biechele TL, Goldenberg SJ, Zheng N, MacCoss MJ, Moon RT. The KLHL12-Cullin-3 ubiquitin ligase negatively regulates the Wnt-beta-catenin pathway by targeting Dishevelled for degradation. Nat Cell Biol. 2006;8:348–357. doi: 10.1038/ncb1381. [DOI] [PubMed] [Google Scholar]
- 49.Major MB, Camp ND, Berndt JD, Yi X, Goldenberg SJ, Hubbert C, Biechele TL, Gingras AC, Zheng N, Maccoss MJ, et al. Wilms tumor suppressor WTX negatively regulates WNT/beta-catenin signaling. Science. 2007;316:1043–1046. doi: 10.1126/science/1141515. [DOI] [PubMed] [Google Scholar]
- 50.Guruharsha KG, Rual JF, Zhai B, Mintseris J, Vaidya P, Vaidya N, Beekman C, Wong C, Rhee DY, Cenaj O, et al. A protein complex network of Drosophila melanogaster. Cell. 2011;147:690–703. doi: 10.1016/j.cell.2011.08.047. [DOI] [PMC free article] [PubMed] [Google Scholar]
- 51.Gavin AC, Bosche M, Krause R, Grandi P, Marzioch M, Bauer A, Schultz J, Rick JM, Michon AM, Cruciat CM, et al. Functional organization of the yeast proteome by systematic analysis of protein complexes. Nature. 2002;415:141–147. doi: 10.1038/415141a. [DOI] [PubMed] [Google Scholar]
- 52.Odajima J, Wills ZP, Ndassa YM, Terunuma M, Kretschmannova K, Deeb TZ, Geng Y, Gawrzak S, Quadros IM, Newman J, et al. Cyclin E constrains Cdk5 activity to regulate synaptic plasticity and memory formation. Dev Cell. 2011;21:655–668. doi: 10.1016/j.devcel.2011.08.009. [DOI] [PMC free article] [PubMed] [Google Scholar]
- 53.Woodcock SA, Jones RC, Edmondson RD, Malliri A. A modified tandem affinity purification technique identifies that 14-3-3 proteins interact with Tiam1, an interaction which controls Tiam1 stability. J Proteome Res. 2009;8:5629–5641. doi: 10.1021/pr900716e. [DOI] [PubMed] [Google Scholar]
- 54.Herzog F, Kahraman A, Boehringer D, Mak R, Bracher A, Walzthoeni T, Leitner A, Beck M, Hartl FU, Ban N, et al. Structural probing of a protein phosphatase 2A network by chemical cross-linking and mass spectrometry. Science. 2012;337:1348–1352. doi: 10.1126/science.1221483. [DOI] [PubMed] [Google Scholar]
- 55.Olsen JV, Blagoev B, Gnad F, Macek B, Kumar C, Mortensen P, Mann M. Global, in vivo, and site-specific phosphorylation dynamics in signaling networks. Cell. 2006;127:635–648. doi: 10.1016/j.cell.2006.09.026. [DOI] [PubMed] [Google Scholar]
- 56.Bisson N, James DA, Ivosev G, Tate SA, Bonner R, Taylor L, Pawson T. Selected reaction monitoring mass spectrometry reveals the dynamics of signaling through the GRB2 adaptor. Nat Biotechnol. 2011;29:653–658. doi: 10.1038/nbt.1905. [DOI] [PubMed] [Google Scholar]
- 57.Zhai B, Villen J, Beausoleil SA, Mintseris J, Gygi SP. Phosphoproteome analysis of Drosophila melanogaster embryos. J Proteome Res. 2008;7:1675–1682. doi: 10.1021/pr700696a. [DOI] [PMC free article] [PubMed] [Google Scholar]
- 58.Chandramouli KH, Reish D, Qian PY. Gel-based and gel-free identification of proteins and phosphopeptides during egg-to-larva transition in polychaete Neanthes arenaceodentata. PLoS One. 2012;7:e38814. doi: 10.1371/journal.pone.0038814. [DOI] [PMC free article] [PubMed] [Google Scholar]
- 59.Goswami T, Li X, Smith AM, Luderowski EM, Vincent JJ, Rush J, Ballif BA. Comparative phosphoproteomic analysis of neonatal and adult murine brain. Proteomics. 2012;12:2185–2189. doi: 10.1002/pmic.201200003. [DOI] [PMC free article] [PubMed] [Google Scholar]
- 60.Xu A, Haines N, Dlugosz M, Rana NA, Takeuchi H, Haltiwanger RS, Irvine KD. In vitro reconstitution of the modulation of Drosophila Notch-ligand binding by Fringe. J Biol Chem. 2007;282:35153–35162. doi: 10.1074/jbc.M707040200. [DOI] [PubMed] [Google Scholar]
- 61.Acar M, Jafar-Nejad H, Takeuchi H, Rajan A, Ibrani D, Rana NA, Pan H, Haltiwanger RS, Bellen HJ. Rumi is a CAP10 domain glycosyltransferase that modifies Notch and is required for Notch signaling. Cell. 2008;132:247–258. doi: 10.1016/j.cell.2007.12.016. [DOI] [PMC free article] [PubMed] [Google Scholar]
- 62.Matsuura A, Ito M, Sakaidani Y, Kondo T, Murakami K, Furukawa K, Nadano D, Matsuda T, Okajima T. O-linked N-acetylglucosamine is present on the extracellular domain of notch receptors. J Biol Chem. 2008;283:35486–35495. doi: 10.1074/jbc.M806202200. [DOI] [PubMed] [Google Scholar]
- 63.Nie M, Xie Y, Loo JA, Courey AJ. Genetic and proteomic evidence for roles of Drosophila SUMO in cell cycle control, Ras signaling, and early pattern formation. PLoS One. 2009;4:e5905. doi: 10.1371/journal.pone.0005905. [DOI] [PMC free article] [PubMed] [Google Scholar]
- 64.Bonaldi T, Straub T, Cox J, Kumar C, Becker PB, Mann M. Combined use of RNAi and quantitative proteomics to study gene function in Drosophila. Mol Cell. 2008;31:762–772. doi: 10.1016/j.molcel.2008.07.018. [DOI] [PubMed] [Google Scholar]
- 65.Bakal C, Linding R, Llense F, Heffern E, Martin-Blanco E, Pawson T, Perrimon N. Phosphorylation networks regulating JNK activity in diverse genetic backgrounds. Science. 2008;322:453–456. doi: 10.1126/science.1158739. [DOI] [PMC free article] [PubMed] [Google Scholar]
- 66.Friedman AA, Tucker G, Singh R, Yan D, Vinayagam A, Hu Y, Binari R, Hong P, Sun X, Porto M, et al. Proteomic and functional genomic landscape of receptor tyrosine kinase and ras to extracellular signal-regulated kinase signaling. Sci Signal. 2011;4:rs10. doi: 10.1126/scisignal.2002029. [DOI] [PMC free article] [PubMed] [Google Scholar]
- 67.Chen R, Mias GI, Li-Pook-Than J, Jiang L, Lam HY, Miriami E, Karczewski KJ, Hariharan M, Dewey FE, Cheng Y, et al. Personal omics profiling reveals dynamic molecular and medical phenotypes. Cell. 2012;148:1293–1307. doi: 10.1016/j.cell.2012.02.009. [DOI] [PMC free article] [PubMed] [Google Scholar]
- 68.Perrimon N, Barkai N. The era of systems developmental biology. Curr Opin Genet Dev. 2011;21:681–683. doi: 10.1016/j.gde.2011.10.004. [DOI] [PubMed] [Google Scholar]
- 69.Lamond AI, Uhlen M, Horning S, Makarov A, Robinson CV, Serrano L, Hartl FU, Baumeister W, Werenskiold AK, Andersen JS, et al. Advancing cell biology through proteomics in space and time (PROSPECTS) Mol Cell Proteomics. 2012;11:O112 017731. doi: 10.1074/mcp.O112.017731. [DOI] [PMC free article] [PubMed] [Google Scholar]