

Abstract
Retrieved-context models of human memory propose that as material is studied, retrieval cues are constructed that allow one to target particular aspects of past experience. We examined the neural predictions of these models by using electrocorticographic/depth recordings and scalp electroencephalography (EEG) to characterize category-specific oscillatory activity, while participants studied and recalled items from distinct, neurally discriminable categories. During study, these category-specific patterns predict whether a studied item will be recalled. In the scalp EEG experiment, category-specific activity during study also predicts whether a given item will be recalled adjacent to other same-category items, consistent with the proposal that a category-specific retrieval cue is used to guide memory search. Retrieved-context models suggest that integrative neural circuitry is involved in the construction and maintenance of the retrieval cue. Consistent with this hypothesis, we observe category-specific patterns that rise in strength as multiple same-category items are studied sequentially, and find that individual differences in this category-specific neural integration during study predict the degree to which a participant will use category information to organize memory search. Finally, we track the deployment of this retrieval cue during memory search: Category-specific patterns are stronger when participants organize their responses according to the category of the studied material.
Keywords: category clustering, episodic memory, free recall, neural integration, pattern classification
Introduction
The electric fields of the brain, recorded with electrodes via scalp electroencephalography (EEG), intracranial electrocorticography (ECoG), and depth recordings, reveal a multitude of neurally generated signals related to human cognitive processing (Nunez and Srinivasan, 2006; Jacobs and Kahana, 2010). Coherent and rhythmic activation of neural populations can be detected both at the scalp and intracranially; this synchronous oscillatory activity has been related to single-unit spiking activity (Jacobs et al., 2007), and has been proposed to facilitate neural communication at both local and global spatial scales (Fries, 2005; Buzsáki, 2006). The spatiotemporal pattern of oscillatory activity across electrodes carries detailed information about stimulus characteristics (Freeman, 1978; Jacobs and Kahana, 2009) and task characteristics (Canolty et al., 2006). Furthermore, specific oscillatory components have been implicated in memory formation and retrieval, both in the local field around neurons, and at the scalp (Klimesch, 1999; Sederberg et al., 2003; Summerfield and Mangels, 2005; Düzel et al., 2010; Nyhus and Curran, 2010; Liebe et al., 2012).
Here, we use a computational model of human memory to provide a functional interpretation of oscillatory neural signals recorded as people perform a memory task. A recent study by Manning et al. (2011) reveals the promise of this approach. Using multivariate pattern analysis techniques (Duda et al., 2001), Manning et al. observed reactivation of study-period oscillatory patterns during memory search, consistent with a retrieved-context model of memory (Howard and Kahana, 2002; Polyn and Kahana, 2008; Sederberg et al., 2008; Polyn et al., 2009), in which a population of neural integrators (Kojima and Goldman-Rakic, 1982; Fuster et al., 1982; Miller et al., 1996) is used to construct a retrieval cue, while materials are being studied (Manns et al., 2007; Polyn and Kahana, 2008). The retrieval cue is then deployed to allow the person to reactivate the details of recent experience.
We carried out 2 experiments using ECoG/depth recordings and scalp EEG, in which category-specific patterns of oscillations were characterized, while participants studied and recalled items drawn from distinct taxonomic categories, allowing us to test 3 critical predictions of this neurocognitive account of memory search. First, retrieved-context models propose that during study, a participant constructs a category-specific retrieval cue to allow them to target items from that category during memory search. Thus, items eliciting strong category-specific neural activity at study will tend to be remembered during memory search, and will furthermore tend to be remembered in sequence with other same-category items. Second, the integrative process of retrieval cue creation suggests that category-specific patterns grow stronger as a series of same-category items are studied, and that the degree of neural integration will determine the degree to which memory search is organized by category. Third, during memory search, the retrieval cue integrates reactivated category-specific information, causing category-specific patterns to rise in strength when a participant recalls a series of items from the same category. In the reported experiments, we find evidence in support of each of these predictions.
Materials and Methods
Scalp Electroencephalography Experiment
Participants
Forty-one paid volunteers (15 females, age 18–30 years) were recruited; 3 participants were excluded due to technical problems with the EEG recording apparatus, and 9 participants were excluded due to excessive eye movements, leaving 29 participants presented here. The research protocol was approved by the Institutional Review Board of the University of Pennsylvania.
Experimental Paradigm
Stimuli consisted of color and grayscale photographs of famous landmarks, celebrity faces, and common objects, with the name of the stimulus presented in text above the picture. There were 256 stimuli for each category. Stimuli were presented using pyEPL (Geller et al., 2007).
In a preliminary EEG session, participants rated their familiarity with each stimulus used in the experiment. This was done to assess participants' pre-experimental familiarity with each stimulus, to provide participants at least a minimal familiarity with each stimulus, and to provide us with category-specific oscillatory responses in the absence of the cognitive demands of a memory task. Stimuli were presented pseudorandomly, with the constraints that every group of 3 contained stimuli from each of the 3 categories, and that no 2 adjacent items were of the same category. Each stimulus was presented for 3500 ms, during which participants rated their familiarity with the stimulus' referent on a 4-point scale. Each stimulus was followed by a blank interstimulus interval (ISI) of 1000 ± 200 ms. Participants were given a chance to rest after each group of 48 items.
In the subsequent 3 sessions, participants were presented with 48 study-test lists. Each list was composed of 24 stimuli. There were 2 types of lists: “Mixed-category” lists which contained 8 stimuli from each of the 3 categories, and “pure-category” lists which were composed of stimuli all drawn from the same category. In the mixed-category lists, items were presented in trains of same-category items, with each train containing 2–6 items. The order of category trains was pseudorandom, with the constraints that all categories appeared in each set of 3 trains, and that adjacent trains did not contain the same category. Each session contained 10 mixed-category lists and 6 pure-category lists. The pure-category lists were included to establish a baseline behavioral measure of temporal clustering, so this effect could be controlled for when examining category clustering (Polyn et al., 2009). The order of mixed-category and pure-category lists within each session was pseudorandom. Stimuli did not appear more than once within a session, and stimuli were chosen so that items from the same sub-category (e.g., stadiums, presidents) did not appear in the same list.
Each stimulus was presented for 3500 ms, during which participants made a category-specific 4-point semantic judgment (celebrities: “How much do you love or hate this person?”; landmarks: “How much would you like to visit this place?”; objects: “How often do you come across this object in your daily life?”). Studied items where the participant did not respond or responded faster than 300 ms were excluded from all analyses; 0–36 study epochs were excluded for each participant. Each stimulus was followed by a blank ISI of 1000 ± 200 ms.
After presentation of the last stimulus, the screen was blank for 1300 ± 100 ms, followed by presentation of a row of asterisks and a 300-ms tone signaling the start of a 90 s immediate free recall (IFR) period. Participants were instructed to recall items from the list in any order. Digital recordings of vocal recalls were scored using PyParse (Solway et al., 2010). Intrusions of items not in the word pool were scored to determine the category if possible (e.g., “Meryl Streep” was not in the word pool but is clearly a celebrity, while “rock” may have referred to an object or a partially recalled landmark and therefore had ambiguous category). Intrusions of ambiguous category were excluded from all analyses.
At the end of each session, there was a final free recall (FFR) period where participants were given 360 s to recall names of stimuli from any of the lists presented during the session.
Behavioral Analysis
When asked to freely recall categorized materials, participants often will remember multiple same-category items sequentially, a phenomenon known as “category clustering” (Bousfield 1953; also see Figure 1). We used the list-based semantic clustering index ( ; Stricker et al. 2002), to assess the degree of category clustering during IFR. A relabeling procedure was used to establish a baseline level of clustering expected due to the temporal contiguity of same-category items during study (Polyn et al., 2009). Each pure-category list was relabeled with a set of category labels by randomly sampling with replacement from the set of mixed-category lists for that subject. Mean
  was then calculated for the relabeled pure-category lists. The random relabeling procedure was repeated 10 000 times to establish a null distribution of mean
  expected in the absence of category information. Since
  varies with list length, we used a different measure, the adjusted ratio of clustering (ARC) score, to compare category clustering in IFR and FFR (Roenker et al., 1971).
Figure 1.
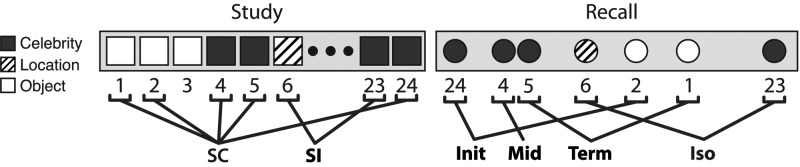
Illustration of category clustering in a sample mixed-category list. A cluster is defined as a sequence of 2 or more same-category recalls. Recalled items are labeled according to their position in a category cluster (Init: initial, Mid: middle, Term: terminal); items not recalled in a category cluster are labeled Iso (isolated). Study items are labeled according to their subsequent recall organization. SC: subsequently clustered (i.e., recalled as an initial, middle, or terminal item in a category cluster); SI: subsequently isolated.
Scalp Electroencephalography Recordings and Data Processing
EEG measurements were recorded using 129-channel HydroCel Geodesic Sensor Nets and a Net Amps 200 Amplifier (Electrical Geodesics, Inc.). An analog bandpass filter of 0.5–200 Hz was applied to recorded voltage, which was then digitized at 500 Hz. Recordings were initially referenced to Cz and were later converted to an average reference. In order to identify electrodes with poor contact, we first used multiple regression to remove signal related to vertical electrooculogram (VEOG) and horizontal electrooculogram (HEOG) measured using electrode pairs placed near the eye. We then created a distribution of the mean voltage for each electrode, and a distribution of the standard deviation of voltage fluctuations for each electrode. We identified an electrode as having poor contact if the absolute z-score (for either mean or standard deviation, compared with the corresponding distribution) was >4. We excluded these electrodes when calculating the average reference. Line noise was removed using a Butterworth filter with zero phase distortion at 60 Hz.
We used a modified version of the eye motion correction procedure reported by Gratton et al. (1983) to remove blinks and eye movements. In order to better discriminate between blinks and eye movements, we identified blinks by applying a threshold to the difference between a fast and slow running average of the VEOG. Before each session of the experiment, participants were instructed to make 10 voluntary blinks and 20 eye movements (5 each of up, down, left, and right saccades), while HEOG and VEOG signals were recorded. The blink detector was applied to each participant's voluntary blinks and eye movements, and the threshold was adjusted to correctly identify at least 80% of the blinks, while minimizing the number of eye movements incorrectly identified. The optimized blink detector was then applied to that participant's experimental data to identify time periods containing blinks. A buffer of 150 ms before and 500 ms after was added to each time sample identified as containing a blink to capture slower changes missed by the blink detector. Multiple linear regression was used to predict the signal at each electrode using 1) VEOG not containing blinks, 2) VEOG containing blinks, 3) HEOG not containing blinks, 4) HEOG containing blinks, and an intercept as predictors. The residuals from this regression were then used as corrected EEG. When calculating propagation factors, we did not subtract the average event-related potential (ERP) from each epoch as Gratton et al. (1983), because we found in an independent data set that correction performance was better when propagation factors were calculated on raw EEG rather than deviation scores (performance improved according to the metrics of variance after correction, and deviation from an estimate of the “true” ERP obtained from averaging events that passed a strict voltage threshold; Gratton et al., 1983). The EEG of 9 participants was not well-corrected by this procedure, due to large eye movement artifacts that were difficult to discriminate from blinks; these participants were excluded from the present analyses.
The EEG analyses presented below examine recordings made during familiarization, mixed-category study lists, mixed-category IFR, and FFR. In our analysis of the free recall periods, we examined both continuous data (treating the entire recall period as a continuous unbroken recording) and segmented data (short recall epochs locked to the onset of vocalized recalls).
Oscillatory Analysis
We measured oscillatory power using a Morlet wavelet transform with a wavenumber of 6. Oscillatory power was calculated at 34 logarithmically spaced frequencies from 2 to 100 Hz. Power values were then log-transformed and down-sampled to 25 Hz. Power was z-transformed relative to the mean and standard deviation of a baseline period, separately for each frequency, electrode, and session. For study epochs, the baseline period was 500–400 ms before stimulus onset. For recall epochs locked to vocalization onset, quiet times during the recall period (where no vocalizations were being made) were used as the baseline; for each list, enough 100-ms baseline epochs were randomly chosen from quiet periods to match the number of recall events on that list. For analyses examining entire recall periods, power was normalized relative to all samples in a given recall period.
Multivariate Pattern Analysis
We used multivariate pattern analysis (Norman et al., 2006) to decode stimulus category based on patterns of oscillatory power. Classification was carried out using penalized logistic regression (penalty parameter = 10), using  regularization (Duda et al., 2001). Classification analyses were carried out using the EEG Analysis Toolbox (available at: http://code.google.com/p/eeg-analysis-toolbox) and the Princeton MVPA Toolbox (available at: http://www.pni.princeton.edu/mvpa).
Study-Period Classification
Any pattern classification analysis requires choosing one portion of the data to train the classifier, and another portion of the data to test the classifier. In this report, we contrast 2 different sets of training data, one drawn from the familiarization session (“familiarization-period training”), and one drawn from the study periods of the free-recall sessions (“study-period training”). The familiarization-period training involved training the classifier on all epochs of the familiarization period, then applying it to all epochs of the study period, measuring performance as the fraction of items correctly classified. This allowed us to examine category-specific neural activity that appears both during a task with no intentional episodic encoding (the familiarization period) and a task requiring episodic encoding (the study period). In contrast, the study-period training involved training and testing on the study period using a cross-validation procedure, where the classifier was trained on study epochs from all lists except one, then tested on the study epochs from the remaining list. Classifier performance was measured as the fraction of test items whose category was correctly classified. This procedure was repeated with a different list left out on each iteration, and classifier performance was averaged over iterations. This allowed us to examine category-specific neural activity that appears when participants are attempting to memorize the studied material.
Several sets of familiarization-period and study-period patterns were created for the analyses reported below. First, for each time-bin–frequency-bin pairing from a set of 100 time-bins and 34 frequency-bins (Fig. 3B), we generated an across-electrode pattern for each stimulus presentation, where the value for each feature of the pattern was the oscillatory power at that electrode–time-bin–frequency-bin combination. Separate analyses examined performance of cross-validation classification, and performance of a classifier trained on the corresponding electrode–time-bin–frequency-bin of the familiarization epochs. In order to examine the category-specificity of these patterns at particular oscillatory frequencies, we averaged performance within 6 frequency bands and over all time-bins during 0–3500 ms after stimulus onset (Fig. 3C). The frequency bands were: delta (2–4 Hz), theta (4–8 Hz), alpha (10–14 Hz), beta (16–25 Hz), low gamma (25–55 Hz), and high gamma (65–100 Hz). We used 100 Hz as the upper bound of high gamma to allow comparison of the ECoG and scalp EEG signals.
Figure 3.

Category-specific oscillations during study. (A) Oscillations in ECoG and depth electrodes at widespread frequencies show category-specificity during study. The color bar indicates classifier performance (using a cross-validation procedure) at each oscillatory frequency-bin and time-bin relative to stimulus onset (at time = 0). Dark blue corresponds to chance performance (0.33̄). (B) Scalp EEG oscillatory activity shows a similar time-frequency distribution of category specificity, although category-specific high gamma oscillatory activity is attenuated. (C) Classifier performance as a function of frequency band, averaged over the stimulus presentation interval. D: delta, 2–4 Hz, T: theta, 4–8 Hz, A: alpha, 10–14 Hz, B: beta, 16–25 Hz, LG: low gamma, 25–55 Hz, HG: high gamma, 65–100 Hz. The dotted line indicates chance performance (0.33̄). Error bars represent standard error of the mean. (D) Performance of a classifier provided with information from all frequencies, plotted against time after stimulus onset. Category-specific patterns peak at about 500 ms after stimulus onset, and persist throughout stimulus presentation, both for intracranially implanted and scalp EEG-monitored participants. Scalp classifier performance during the 500 ms before stimulus onset is averaged over items that followed an item of a different category; all other time-bins show performance averaged over all items. Error bars represent 95% confidence intervals based on within-subject error (Loftus and Masson, 1994). The dotted line indicates chance performance (0.33̄).
In order to examine the category-specificity of these patterns over time, we created a pattern for each study epoch and familiarization epoch containing average oscillatory power in each of 8 500-ms bins swept over the stimulus presentation period (Fig. 3D). Each pattern contained a feature for each electrode–frequency-bin pairing. To obtain a measure of overall classifier performance for a given item presentation, average oscillatory power was calculated for 2 time-bins: 0–0.5 s post-stimulus onset (“early” time-bin) and 0.5–3.5 s post-stimulus onset (“late” time-bin). A pattern was created for each familiarization epoch and study epoch containing a feature for each time-bin–frequency-bin–electrode pairing.
Classifier Performance and Subsequent Recall
To determine how oscillatory activity during study affected subsequent recall performance, we labeled study events based on how each study item was later remembered. Items were labeled as “recalled” (recalled during IFR) or “forgotten” (not recalled during IFR). Recalled items were labeled based on whether they were “subsequently clustered” (recalled as part of a sequence of 2 or more items of the same category) or “subsequently isolated” (not recalled as part of a category cluster). These conditions are illustrated in Figure 1. Analyses below report how classifier accuracy changes with subsequent memory and subsequent clustering status of a particular item.
A number of follow-up analyses were carried out to ensure the validity of analyses contrasting classifier accuracy in different conditions. The first analysis altered the classifier training sets to ensure that analyses involving unbalanced numbers of items with different labels (e.g., recalled versus forgotten) were unbiased. When creating each training set for the classifier, we ensured that each combination of category and the conditions of interest was equally represented, by sampling randomly without replacement from the set of training patterns corresponding to each category and condition. We repeated each classification analysis 10 times to obtain a stable estimate of performance for each classified item. Classification performance was then calculated for each condition of interest, averaged over all replications of the random sampling and classification.
Another set of analyses examined whether our classifier estimates of category strength for a particular studied item were influenced by the category identity of surrounding events in the study sequence. We measured oscillatory power using Morlet wavelets, which were convolved with the EEG to obtain instantaneous estimates of power. Although oscillatory power measured using wavelets most strongly corresponds to oscillatory power at the measured time t, it will also be influenced by surrounding time points in the interval [t − x,t + x], where x depends on the frequency and wavenumber of the wavelet (Herrmann et al., 2005). For all frequencies, we used a wavenumber of 6, so the measured interval varied with frequency; since the lowest measured frequency was 2 Hz, the largest window for which power was affected was  ms, raising the possibility that classifier performance for a given item might be influenced by the category identity of an adjacent item on the study list. To control for this potential influence, we divided studied items based on whether the previous and next items were of the same or a different category. We divided items into train position bins based on whether they were at the beginning of a train, in the middle of a train, at the end of a train, or surrounded on both sides by items from another category (this was never the case in the scalp EEG experiment, but did occur in the ECoG experiment described below). We then examined subsequent memory and subsequent clustering contrasts, while controlling for train position bin. In no case did the category identity of surrounding study items influence the conclusions of an analysis.
Integration of Category-Specific Activity
We examined whether the category-specificity of oscillatory patterns increased as multiple same-category items were studied in sequence (Fig. 5B). Earlier analyses (see “Classifier Performance and Subsequent Recall”) examined overall classifier fraction correct, where the classifier's “guess” of the category of each stimulus was based on which category was estimated as being the most probable during each item presentation. Here, we instead examined a continuous measure of category-specific activity: For each presented item, we examined the classifier's estimate of the probability of the relevant category, given the pattern of neural activity observed during presentation of the item (Kuhl et al., 2012). We tested for evidence of neural integration of category-specific activity by examining whether classifier estimates increased with successive presentations of items in the same category. To determine whether integrative activity was related to individual differences in category clustering (Fig. 5C), we used weighted least-squares regression (weighted by the number of observations at each train position) to fit the change in classifier estimates over train positions 1–3 for each participant; we refer to this as “neural integration rate.” We then examined whether neural integration rate predicted individual differences in category clustering, by measuring the correlation between neural integration rate and  .
.
Figure 5.

Dynamics of category-specific scalp EEG activity during study. (A) The fidelity of category-specific oscillatory patterns predicts subsequent memory and recall organization. When a classifier was trained on item presentations during a familiarity judgment task and applied to the study period of free recall lists, subsequently clustered (SC) items were classified more accurately than both subsequently isolated (SI) items and forgotten items. Error bars represent 95% confidence intervals based on within-subject error (Loftus and Masson, 1994). (B) When the classifier is trained on a left-out portion of the study period, the persistence of category-related neural patterns is seen in the increased fidelity of category patterns when multiple same-category items are presented in succession. The classifier's estimate of the strength of the current category is plotted as a function of position within a train of same-category item presentations. On average, classifier estimates rose with successive same-category stimuli. Error bars represent 95% confidence intervals based on within-subject error (Loftus and Masson, 1994). (C) The slope of the regression of classifier estimate on train position was correlated with individual differences in category clustering as measured by  (r = 0.500, P < 0.01). Two outliers have been removed from the plot; with them included, the correlation is still significant (r = 0.421, P < 0.05).
A secondary analysis examined whether, within an individual participant, differences in the amount of category clustering observed in individual lists correlated with neural integration rate for the studied items in that particular list. Each participant performed free recall on 30 mixed-category lists, across 3 experimental sessions. For each trial, we calculated both the neural integration rate and the degree of category clustering. For each participant, we obtained the t-value of the slope of the regression of category clustering on neural integration rate. We then used a t-test to assess whether the regression t-value was significantly positive across subjects. A significantly positive slope indicates a significant relationship between list-level fluctuations in neural integration rate and category clustering.
Reactivation During Recall
A series of analyses examined whether patterns of oscillatory power observed during study were reactivated during recall. Examination of the stimulus-related oscillatory activity during study revealed a transient response with a rapid onset as well as a more sustained response (Fig. 3B). We chose to focus on the later, sustained, category-specific neural response, under the assumption that it would more likely be related to higher-order cognitive representations activated in response to the stimulus presentation. The classifier was trained on average power from the late time-bin of item presentation (see “Study Period Classification”), then was applied to the oscillatory power recorded during recall. We assessed the degree of reactivation of category-specific oscillatory patterns during the recall period using a correlation-based reactivation metric (Polyn et al., 2005).
The classifier provides an estimate of the strength  of each category i at each time-bin t. The record of recalls during each free recall period was sampled at 25 Hz to match the sampling rate of the oscillatory power. Each time-bin was either assigned to no category (if no recalls were currently being made) or to exactly 1 category. The 1 s preceding onset of each vocalized recall was labeled with the category of the recalled item. When there was overlap between recalls, the earlier item took precedence. This resulted in a set of 3 vectors
  , where each element
  is 1 for times t when category j is active, and 0 when category j is not active. These vectors represent the “recall record” of each recall period.
We calculated a correlation-based reactivation metric to measure reactivation of category patterns during recall. We treated all recall periods as part of one record by concatenating the recall periods together. We calculated Pearson's linear correlation between  and
and  for
for  and
and  to create a cross-correlation matrix. The diagonal of the cross-correlation matrix corresponds to correlations between classifier estimates and the correct recall records, while the off-diagonal entries correspond to correlation with the incorrect categories. We calculated the mean correlation in the diagonal entries and subtracted the mean correlation in the off-diagonal entries to obtain a summary index of the classifier's ability to track each subject's recall behavior, which we refer to as the reactivation metric (this measure was referred to as the OnOff metric by Polyn et al., 2005).
We used a permutation test to determine whether reactivation was statistically significant across subjects. For each subject, the columns of the cross-correlation matrix were scrambled, and the mean reactivation metric was calculated. This process was repeated 5000 times to establish a null distribution of reactivation metric scores, and reactivation was considered significant if the observed score was >95% of the null distribution. We also examined reactivation at different frequencies by training and testing the classifier at each frequency individually. In order to control Type I error rate, while accounting for the correlation structure of the data, we scrambled the columns of the cross-correlation matrix in the same way for each frequency, then pooled the null distributions of each frequency together to make a null distribution accounting for familywise error. This familywise null distribution was then used to set the significance threshold for all frequencies (Sederberg et al., 2003).
To assess the time-course of reactivation relative to the onset of individual recalls, we examined segmented recall epochs, which included the period from 3 s before to 1 s after onset of vocalization. Recall epochs were excluded if they overlapped with vocalizations of previous recalls (IFR: 68.5% [standard error of the mean,SEM 1.3%] of epochs were excluded, leaving 44–146 epochs for each subject; FFR: 78.0% [SEM 1.3%] of epochs were excluded, leaving 31–93 epochs for each subject). For each included recall epoch, we calculated average power in 500-ms time-bins. We then trained the classifier on the late time-bin of the study period (see “Study Period Classification”), and applied the classifier to each segmented recall event at each time-bin. We tested the significance of reactivation using a permutation test similar to above (pooling null distributions over all time-bins), except using fraction correct instead of the reactivation metric to measure classifier accuracy.
Category-Specific Activity During Clustering
In addition to the analyses above, where we trained the classifier on the study period, then applied it to the recall period (see “Reactivation During Recall”), we also examined recall-period-specific category activity by training and testing the classifier on segmented recall epochs. This provided us with a measure of the fidelity of category-specific activity in the period just before vocalization of a recalled item. The oscillatory patterns created for this analysis used a single time-bin averaged from 3 to 0.5 s before onset of vocalization (the 0.5 s immediately before each vocalization was excluded in order to limit the influence of vocal response preparation artifacts), and all frequency-bins. Performance was assessed using cross-validation, with 1 list left out on each iteration, and performance was averaged over iterations.
We compared mean classifier accuracy for clustered and isolated items, to test the hypothesis that category clustering is associated with stronger category representations. Clustered items were labeled according to the item's position within the category cluster: “initial” (preceded by an item from a different category, and followed by an item from the same category), “middle” (both preceded and followed by items from the same category), or “terminal” (preceded by an item from the same category, and followed by an item from a different category), as illustrated in Figure 1. Note that these cluster position bins are defined in a similar manner to the train position bins used for the study period (see “Classifier Performance and Subsequent Recall”), but apply to the order in which items are recalled rather than the order in which items are presented. We used a 2-way within-subjects ANOVA with previous category (same or different) and next category (same or different) as factors, to test for influences of the previous and next recalls. As with our study-period analyses, we examined both performance of a classifier trained on all events, and performance of a classifier provided with a balanced training set. For the balanced analysis, we used random sampling without replacement to create a training set with equal numbers of epochs from each combination of cluster position bin and category. We repeated the random sampling and classification 10 times to obtain a stable estimate of classifier performance.
As for the study-period analyses, we also carried out follow-up analyses to rule out the possibility that the wavelet-based power estimates were influenced by the neural signal related to adjacent events in the recall sequence. Since our wavelet estimates of instantaneous oscillatory power are influenced by oscillations within an extended interval, classification of items recalled as part of a cluster may be improved by the influence of oscillatory power related to adjacent recalls of same-category items. If clustered items are better classified due to influence of nearby recalls on power estimates, this difference should only appear for time-bins that are <1500 ms from the closest recall event (see “Classifier Performance and Subsequent Recall”). Therefore, we focused on the period from 1500 to 500 ms before vocalization onset (using 500-ms time-bins), which cannot be influenced by adjacent recalls (based on our criteria for creating recall epochs; see “Reactivation During Recall”). We averaged classifier performance over this interval for items following a recall of the same category (middle/terminal) and items following a recall of a different category (isolated/initial) to determine whether the category of the previous recall has an effect on classifier performance. Similarly, we compared classifier performance during IFR and FFR over the critical period from 1500 to 500 ms before vocalization onset. In no case did analysis of this restricted time period differ from analysis of the entire recall epoch (3000 to 500 ms before vocalization onset).
Electrocorticography Experiment
Participants
We tested 11 patients (3 females; age 18–44, mean 35.5, standard deviation [S.D.] 8.2) with medication-resistant epilepsy who were undergoing invasive ECoG and depth electrode monitoring to determine the location of epileptogenic foci for subsequent resection. See Table 1 for detailed patient information. The patients had a total of 864 surface and depth electrodes (Fig. 2); electrode placement was determined by the clinical team.
Table 1.
This table provides the hospital (HOSP) at which each patient's data were collected, as well as each patient's age in years (AGE), sex (SEX), handedness (HAND), number of implanted electrodes (ELC), and number of testing sessions (SES)
| ID | HOSP | AGE | SEX | HAND | ELC | SES |
|---|---|---|---|---|---|---|
| 1 | UP | 18 | M | A | 100 | 6 |
| 2 | UP | 39 | M | L | 77 | 1 |
| 3 | UP | 40 | M | R | 38 | 2 |
| 4 | TJ | 25 | M | R | 35 | 3 |
| 5 | TJ | 40 | F | R | 82 | 10 |
| 6 | TJ | 39 | M | L | 52 | 4 |
| 7 | TJ | 34 | F | R | 92 | 2 |
| 7 | TJ | 34 | F | R | 86 | 8 |
| 8 | TJ | 39 | F | R | 85 | 1 |
| 9 | TJ | 44 | M | R | 124 | 4 |
| 10 | TJ | 29 | M | R | 36 | 1 |
| 11 | TJ | 43 | M | R | 57 | 5 |
Note: Patient 7 underwent invasive monitoring with 2 partially overlapping sets of electrodes (see text for details). A, ambidextrous; F, female; L, left; M, male; R, right; TJ, Thomas Jefferson Hospital (Philadelphia, PA, United States of America); UP, Hospital of the University of Pennsylvania (Philadelphia, PA, United States of America).
Figure 2.
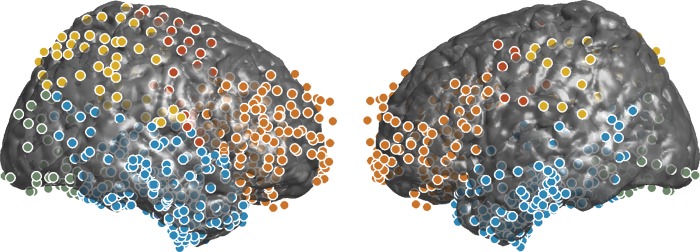
Right and left sagittal views of electrode coverage in intracranially implanted patients. Temporal, parietal, and occipital regions are denoted by blue, yellow, and green dots, respectively. Prefrontal electrodes are shown in orange; other frontal electrodes are shown in red. Not shown: 76 medial temporal electrodes.
The research protocol was approved by the relevant institutional review boards, and informed consent was obtained from all participants. To limit the effects of seizures and medication on task performance and brain activity, we refrained from testing when patients were on high doses of pain medications or anti-epileptic drugs, and during the 6 h period following any clinically significant seizure. For 2 sessions, patient 7 was implanted with one set of electrodes. This patient underwent another surgery prior to her remaining 8 sessions. During this surgery, some electrodes were added, and some were removed to create a second set of electrodes. In the reported classification analyses, we treated these 2 sets of sessions as coming from distinct participants. The number of electrodes that overlapped between the 2 sets of sessions was relatively small (24 electrodes; 26.1% of the first set of electrodes, and 27.9% of the second set), precluding us from combining these 2 sets of data for pattern classification analysis.
Materials
The word pool consisted of the 216 items from the scalp EEG experiment that were the most recognizable (as judged by the experimenters). In addition to the original picture used in the scalp EEG experiment, 4 additional pictures were found for each item.
Procedure
Participants were presented with lists of 9 items, with 3 items from each category. Category order was pseudorandom within each list. Before each item, a text cue indicating the category of the upcoming item was shown for 1000 ms. There was a 200–500 ms ISI before presentation of the item, which lasted for 3500 ms. While the item was on the screen, participants made a category-specific judgment, as in the scalp EEG experiment. The ISI between each item and the next category cue was 800–1200 ms. After presentation of the last stimulus, the screen was blank for 1200–1400 ms, followed by presentation of a row of asterisks and a 300-ms tone signaling the start of a 60 s IFR period. If 60 s had not passed yet, but the participant indicated that he or she had finished recall, the experimenter pressed a button to end the recall period. Each item had 5 distinct pictures, which all appeared during the session (but never in the same list). Participants were told that the same item might appear multiple times, but to simply focus on remembering the items from the current list. Participants were presented with 20 lists in each session. There was a 240 s FFR test at the end of each session. Each participant completed 1–10 sessions (see Table 1 for the number of sessions completed by each participant).
Electrocorticography Recordings and Data Processing
ECoG was recorded using a Grass Telefactor or Nicolet digital video-EEG system. ECoG was sampled at 400 or 512 Hz. A digital Butterworth notch filter with zero phase distortion at 60 Hz was used to remove electrical noise. Synchronization pulses controlled by the computer presenting the stimuli were sent to the EEG monitoring system, and later used to align electrophysiological data to events in the experiment (precision < 4 ms).
Oscillatory power was measured at 37 logarithmically spaced frequencies from 2 to 128 Hz. Power was log-transformed and down-sampled to 16 Hz. Power was normalized using similar techniques as used in the scalp EEG experiment, except power measured during study epochs was normalized relative to 500–400 ms before onset of the category cue (rather than the onset of the stimulus itself). Epochs examined during the recall period consisted of data from 2000 ms before to 1000 ms after vocalization onset. Epochs were only included if they did not contain previous vocalizations (IFR: 70.8% [SEM 4.5%] of epochs were excluded, leaving 5–744 epochs for each subject; FFR: 67.6% [SEM 3.9%] of epochs were excluded, leaving 3–90 epochs for each subject). Power was normalized relative to periods with no vocalizations; for each recall period, enough 100-ms baseline epochs were randomly chosen from quiet periods to match the number of recalls during that recall period. We also examined continuous data including entire recall periods; power was z-transformed based on the mean and standard deviation of power over each recall period, separately for each electrode and frequency.
The locations of the intracranial electrodes were determined using an indirect stereotactic technique based on co-registered post-operative computed tomography and pre- or post-operative magnetic resonance imaging, and converted into Montreal Neurological Institute coordinates. The Talairach Atlas was used to determine the anatomical location of each electrode (Talairach and Tournoux, 1988; Lancaster et al., 2000). Electrodes were divided into 7 regions of interest (ROIs; see Fig. 2): Frontal (220 electrodes), prefrontal (188), temporal (532), medial temporal (76), hippocampus (22), occipital (56), and parietal (57). The prefrontal ROI is a subset of electrodes in the frontal ROI; similarly, the hippocampal ROI is a subset of the medial temporal ROI, which is a subset of the temporal ROI. We used brain images from the WFU Pick-Atlas for data visualization (Maldjian et al., 2003).
Multivariate Pattern Analysis
Pattern analysis methods were the same as in the scalp EEG experiment, except that classification analyses were carried out separately for each ROI. For each classification analysis, we tested whether accuracy was above chance using a permutation test. The labels corresponding to each category were permuted 5000 times, and the mean classifier accuracy (measured by fraction correct for cross-validation analyses, and by reactivation metric for reactivation analyses) was calculated for each permutation. The same permutations were used across all dimensions examined in that analysis (which could include ROIs, time-bins, and frequency-bins). The permuted distribution of classifier accuracy scores was pooled over all tests (e.g., over ROIs) to create one null distribution, which was used to establish a significance threshold that controls familywise Type I error at  (Sederberg et al., 2003).
Results
An Overview of the Modeling Framework
When participants freely recall studied material, the order of their responses reveals the associative structure of their stored memories (Puff, 1979; Polyn et al., 2009). Retrieved-context models of memory (Howard and Kahana, 2002; Sederberg et al., 2008; Polyn et al., 2009) explain these organizational phenomena (as well as a vast array of other behavioral phenomena) in terms of the interactions between a representation of the studied material, and an internal retrieval cue. The retrieval cue is characterized as a population of integrative elements; the persistent activity of these integrators causes the retrieval cue to slowly change its state. One characteristic of these models is that the retrieval cue is both always active, and ever-changing. During study, the system 1) integrates details of the studied items into the retrieval cue itself, and 2) engages associative processes that directly link the cue with the neural representation of the studied material. These characteristics of the system allow it to more accurately target the studied material during a later search attempt. In these experiments, participants studied items from categories associated with distinct neural representations (Polyn et al., 2005), allowing us to track this category-specific neural activity as it is integrated into the retrieval cue, and deployed during memory search. Using these category-specific oscillatory patterns, we are able to predict both which studied items will be remembered (Kuhl et al., 2012) and which remembered items will be recalled adjacent to items from the same category. Furthermore, we are able to track category-specific activity as memory search unfolds. In the following sections, we use the retrieved-context framework to interpret the dynamics of category-specific patterns of oscillatory neural activity, recorded both at the scalp, and with ECoG/depth electrodes.
Category-Specific Oscillatory Patterns During Encoding
Central to modern cognitive neuroscientific theory is the hypothesis that the characteristics of a particular study event are reflected in a distributed, attribute-based representation that spans multiple brain areas (Haxby et al., 2001; Polyn et al., 2005; Martin, 2007). During encoding, both the local oscillatory signals picked up by the intracranial electrodes, and the more global signals picked up by the scalp electrodes reveal distinct patterns of oscillatory activity associated with the category identity of a studied item. Overall classifier percent correct (allowing the classifier to use 2 time-bins, 34 frequency-bins, and all electrodes to decode stimulus category using a cross-validation procedure; see Materials and Methods) was 58.9% (SEM 1.0%; chance performance is  ) and 82.4% (SEM 2.6%) for the scalp EEG and ECoG experiments, respectively. In the intracranial experiment, during the study period, every brain region which had substantial electrode coverage showed reliable category-specific differences in oscillatory power (Fig. 4A; P < 0.05, permutation test). As we describe in this section, the category-specific oscillatory patterns recorded by each of these techniques are quite similar in terms of their time-course and frequency profile, though the ECoG/depth recordings contain significantly more category-specific high-gamma activity.
Figure 4.

Category-specific oscillations during study and reactivation during recall. (A) Classifier performance during study is significantly above chance for all regions of interest (ROIs). (B) The fidelity of category-specific patterns in ECoG recorded from temporal electrodes predicts subsequent memory. The difference in classifier category strength estimates between recalled and forgotten items is shown for each ROI. For temporal electrodes, classifier estimates were greater for subsequently recalled items, compared with subsequently forgotten items. Error bars indicate 95% confidence intervals corresponding to a 1-tailed paired t-test; asterisk (*) indicates P < 0.05, Bonferroni-corrected. (C) Reactivation of category-specific information during immediate free recall is observed in frontal, prefrontal, temporal, medial temporal, hippocampal, and occipital electrodes. (D) Reactivation during final free recall is observed in frontal, prefrontal, temporal, medial temporal, hippocampal, and parietal electrodes. FR: frontal lobe, PFC: prefrontal cortex, Temp: temporal lobe, MTL: medial temporal lobe, Hipp: hippocampus, Occ: occipital lobe, Par: parietal lobe. The dotted lines indicate significance thresholds for permutation tests comparing performance to chance (familywise Type I error rate < 0.05).
Figure 3 depicts a number of analyses characterizing the time-course and frequency profile of these category-specific patterns, for each of these datasets. As described in Materials and Methods (see “Study Period Classification”), we examined 2 methods of training the classifier. Here, we examine the study-period training results (as this was included in both experiments), and in later sections we contrast study-period training with familiarization-period training.
We conducted a series of classification analyses to demonstrate the category selectivity of oscillatory neural signals for each time-bin–frequency-bin pairing, relative to item onset, for both intracranially implanted (Fig. 3A) and scalp EEG–monitored (Fig. 3B) participants. The time-frequency distribution of category-specific neural signals is remarkably similar across the 2 groups of participants, suggesting that the scalp electrodes are sensitive to the same category-specific patterns characterized by the intracranial electrodes. Category specificity at widespread frequencies is seen in the first 500 ms after item presentation, and longer-lasting category differences are observed in the delta (2–4 Hz), theta (4–8 Hz), and alpha (10–14 Hz) frequency bands. Sustained high gamma (65–128 Hz) category differences are observed in the recordings from intracranial electrodes (Fig. 3A). Gamma-band (30–100 Hz) activity at the scalp is also somewhat sensitive to stimulus category (Fig. 3B).
Figure 3C demonstrates the category selectivity of the neural signal at different frequency bands during the study period, for each of these datasets. We averaged classifier cross-validation performance over the entire stimulus presentation period (0–3500 ms post-stimulus onset) for 6 frequency bands: delta, theta, alpha, beta (16–25 Hz), low gamma (25–55 Hz), and high gamma (65–100 Hz). Here, we used 100 Hz as the upper bound of high gamma to allow comparison of the ECoG/depth and scalp EEG signals. Classifier performance for the intracranial experiment was greater than scalp EEG (F1,234 = 188.66, P < 0.0001). There was also a main effect of frequency (F5,234= 15.45, P < 0.0001) and a significant interaction (F5,234= 3.51, P < 0.005). There was an interaction between ECoG and scalp EEG in the low- and high-gamma bands (F1,78 = 10.88, P < 0.002), with the ECoG data showing a greater advantage for high gamma over low gamma (Fig. 3C). The lack of an increase in classifier performance for high gamma (over low gamma) in the scalp EEG experiment may reflect attenuation of high-frequency oscillations by the skull (Nunez and Srinivasan, 2006).
Although gamma-band oscillations were attenuated at the scalp electrodes, classifier performance for frequencies in the gamma band was still reliably above chance during the study period. This finding is consistent with research suggesting that induced gamma activity is involved in perceptual binding during object perception (Tallon-Baudry et al., 1996, 1997), but recent work raises the possibility that some high-frequency EEG activity measured at scalp electrodes is related to miniature saccades, rather than brain activity (Yuval-Greenberg et al., 2008). Voltage potentials related to these miniature saccades do not differ in polarity on different sides of the eye, so our regression procedure for subtracting the influence of eye movements (which relied on difference potentials to measure eye movements) would not be effective at removing these signals (Yuval-Greenberg et al., 2008). If participants made distinct miniature-saccadic activity for each of the 3 categories, these signals could affect our analyses. Thus, we carried out a second series of analyses on the scalp EEG signal from the study period, in which oscillations of frequency higher than 30 Hz were excluded, and found that overall classifier performance was very similar, and the conclusions from all reported analyses were unchanged. This suggests, for scalp EEG at least, either that the information contained by the high-frequency category-specific activity is redundant with the low-frequency information, or that the most important category-specific activity is carried by lower frequencies.
Figure 3D shows the time-course of category-specific oscillatory patterns relative to item onset. For each time-bin, the classifier is trained on oscillatory information from all frequencies. Classifier performance peaks at 500–1000 ms for both datasets, but category-specific information persists for at least as long as the item remains on-screen. We found some evidence in the scalp EEG study that category-specific information related to the previous study item persists during the inter-item interval. When the classification analysis for this baseline period includes all study events, classifier performance is significantly above chance (mean 35.81%, SEM 0.45%, t(28) = 5.53, P < 0.0001). In this experiment 69% of items are preceded by an item of the same category, raising the possibility that persistent category-specific activity could influence these estimates. To obtain a clean baseline estimate of category discriminability, we restricted our analysis (for this bin) to items presented immediately after a category switch; the other time-bins show performance averaged over all items. This change caused baseline classification to drop to chance levels. In the ECoG/depth electrode experiment, each item was preceded by a cue indicating the category of the upcoming item. Classifier performance in the 500 ms before stimulus onset was significantly above chance (mean 37.81%, SEM 1.53%, t(11) = 24.7, P < 0.0001; see Figure 3D); this may be due to activity related to anticipation of the stimulus category or preparation for the category-specific judgment to be made about the item.
Category-Specific Information Predicts Subsequent Memory
We hypothesize that category-specific neural activity during encoding reflects a neural representation of the semantic characteristics of the studied item. However, there are potentially many reasons why neural activity might reflect category identity. Thus, it is important to determine whether these category-specific activation patterns tell us anything about the memorability of the stimulus itself. The next set of analyses show that the strength of the oscillatory patterns elicited for a particular studied item provide information about whether that item will be recalled. This is consistent with the hypothesis that a substantial component of these category-specific patterns relates to the representation of the studied item, the representation of a category-based retrieval cue, or some combination thereof.
In the scalp EEG dataset, we found that subsequently recalled items were classified more accurately than subsequently forgotten items. This was the case regardless of the training set used to train the classifier. With study-period training, classifier performance was greater for subsequently recalled items (percent correct: mean 60.4%, SEM 1.2%) than for subsequently forgotten items (percent correct: mean 57.5%, SEM 0.9%); this difference was significant (t(28) = 3.60, P < 0.0001). Similarly, with familiarization-period training, classifier performance was greater for subsequently recalled items (percent correct: mean 54.8%, SEM 1.0%) than for subsequently forgotten items (percent correct: mean 52.0%, SEM 0.9%); this difference was significant (t(28) = 3.15, P < 0.005).
In the ECoG/depth electrode experiment, temporal and occipital regions showed the strongest category-specific activity, but the uneven electrode coverage of different ROIs across patients makes it difficult to draw strong conclusions about the relative category-specificity of activity in different areas. However, we can examine how category-specific activity within a particular ROI changes under different experimental conditions. In the ECoG/depth electrode dataset, we found that there was no difference in classifier performance between recalled and forgotten items at any ROI (all P> 0.05, Bonferroni-corrected). Since performance at temporal electrodes is near ceiling (mean 79.22%, SEM 2.96%), we also examined whether the raw classifier estimates predicted subsequent memory status. Classifier estimates are free to vary continuously, so they may be more sensitive in some cases than fraction correct, which is binary for each classified item (Kuhl et al., 2012). We found that classifier estimates at temporal electrodes were significantly greater for subsequently recalled than forgotten items (Fig. 4B; t(11) = 8.50, P < 0.0005, Bonferroni-corrected). While occipital electrodes also showed strong category-related oscillatory signal (Fig. 4A), the fidelity of this signal did not predict whether an item would be remembered (t(9) = 2.91, P> 0.05, Bonferroni-corrected).
In each of these datasets, we carried out a follow-up analysis of variance to examine whether classifier performance was influenced by the sensitivity of the wavelet-based power estimates to the category identity of surrounding studied items. As described in Materials and Methods, we included a factor in the analysis of variance relating to the category identity of the surrounding items (see “Classifier Performance and Subsequent Recall”). In the scalp dataset, this revealed a significant main effect of subsequent memory (F1,28 = 9.98, P < 0.005), no effect of surrounding category identity (F2,56 = 1.56, P = 0.22), and no interaction between these factors (F2,56< 1). Similarly, in the ECoG/depth electrode dataset, this revealed a significant main effect of subsequent memory (F1,11 = 12.55, P < 0.005) at temporal electrodes, no effect of surrounding category identity (F3,33< 1), and no interaction between these factors (F3,33< 1). We also carried out a follow-up analysis in which the number of recalled and forgotten items (as well as the number of items from the different categories) were balanced within the training set (see “Classifier Performance and Subsequent Recall”). We found that, even with a balanced training set, classifier estimates in temporal electrodes were significantly greater for subsequently recalled items compared with forgotten items (t(11) = 6.98, P < 0.001). This suggests that classifier estimates are greater for subsequently recalled items because they are associated with higher-fidelity category activity, and not merely because there are more subsequently recalled items in the training set. The other ROIs showed no significant differences (all P> 0.05, Bonferroni-corrected).
Category-Specific Activity Predicts Subsequent Recall Organization
Retrieved-context models suggest that if some component of the observed category-specific oscillatory activity is related to the operation of a category-based retrieval cue, then an item with a strong category response during study should not only be better recalled, but there should also be an increased likelihood of that item being recalled in succession with other items from the same category (i.e., the item should be clustered with same-category items during recall). It is also possible that items with prototypical representations for the category would elicit strong category-specific neural activity; these two hypotheses will receive further attention in the Discussion.
Behavioral analysis of the free-recall periods reveals reliable category clustering in both experiments. In the scalp EEG experiment,  in IFR was 3.66 (SEM 0.25); this exceeded the amount of category clustering expected given temporal influences on recall, calculated using a relabeling procedure (mean 0.808, S.D. 0.061; P < 0.0002; Polyn et al. 2009). In the ECoG/depth electrode experiment, because items from each category were randomly placed in the list,
  expected by chance is 0.
  in IFR was 1.19 (SEM 0.16), which was significantly greater than chance (t(11) = 7.39, P < 0.0001). While both experiments showed evidence that participants were organizing their memory search by category, only the scalp EEG experiment yielded reliable evidence that the category-specific oscillatory responses were related to this category organization. This may be due to the global estimate of category-specific neural response provided by scalp EEG, or may be due to the larger number of participants and longer study lists of the scalp EEG experiment, which leads to a larger set of study and recall events to examine.
Item-level fluctuations in classifier performance predict subsequent clustering by category; we refer to this as the “subsequent clustering effect”. With familiarization-period training, subsequently clustered items were identified more reliably than the items that would be forgotten (t(28) = 3.26, P < 0.005), and more importantly, than the subsequently isolated items (t(28) = 2.39, P < 0.05; Figure 5A). As above, a follow-up analysis of variance showed that this effect was not influenced by the category identity of surrounding items (we found a main effect of subsequent clustering [F1,28= 5.20, P < 0.05], no effect of surrounding category identity [F2,56 < 1], and no interaction [F2,56= 1.42, P = 0.25]).
Although the classifier with familiarization-period training was sensitive to subsequent clustering, the classifier with study-period training was not. Classifier performance was 60.4% (SEM 1.2%) for subsequently clustered items and 59.6% (SEM 2.0%) for subsequently isolated items; this difference was not significant (t(28) = 0.43, P = 0.7). We examined this differential sensitivity with an analysis of variance on the classifier performance, with training period (familiarization or study) and subsequent organization (isolated or clustered) as factors. There was a significant main effect of training period (F1,28 = 32.42, P < 0.0001; accuracy was better when the classifier was trained on the study period), no main effect of subsequent organization (F1,28= 2.53, P = 0.13), and no interaction (F1,28= 1.75, P = 0.20). Therefore, although there is a significant difference in classifier performance between clustered and isolated items when the classifier is trained on the familiarization period, and no difference when the classifier is trained on the study period, the magnitude of the difference in classifier performance between subsequently clustered and subsequently isolated items does not significantly interact with training period. This raises the possibility that it is not necessarily a fundamental difference in the familiarization versus free-recall category patterns that is causing the difference in sensitivity to subsequent clustering; it may be a matter of statistical power. Along these same lines, we also found that the difference in classifier performance between recalled and forgotten items does not depend on the training period. Another analysis of variance revealed a significant main effect of training period (F1,28= 53.78, P < 0.0001), a significant main effect of subsequent memory (F1,28= 16.87, P < 0.0005), and no interaction (F1,28 < 1).
Integration of Category-Specific Information
According to retrieved-context models of memory, organizational effects arise through the interaction of a retrieval cue with the contents of memory. When many items on the study list have similar characteristics (e.g., they are from the same category), one can construct a retrieval cue that contains those common characteristics to effectively retrieve those items during memory search. According to these models, the processes that construct the retrieval cue are integrative: They create a representation that changes its state slowly over time. This allows the retrieval cue to synthesize the properties of a particular episode, and serve as an effective cue for the events occurring over a rather large temporal interval (Howard and Kahana, 2002). Thus, for a particular neural signal to be a candidate for being part of the retrieval cue, one would predict that it would be sensitive to the category identity of previous stimuli.
As in the above analysis of subsequent clustering, we found that the more global scalp EEG signal contained evidence for integrative activity, while the EGoG/depth electrode signal did not. This may be due to the design of the ECoG/depth electrode experiment, where same-category items did not often occur in sequence. For a classifier with scalp EEG study-period training, we found that the fidelity of the observed category-specific neural activity increased as multiple items from the same category were presented in succession (Fig. 5B). The classifier estimate for the category corresponding to the studied item increased for the first 3 positions of a same-category train of items and leveled off beyond that. A weighted least-squares regression (weighted by the number of observations at each train position) was used to fit the change in classifier estimates over train positions 1–3 for each participant. The mean slope was 0.0078 (SEM 0.002), which was significantly positive (t(28) = 3.68, P < 0.001).
We found that individual differences in the slope of classifier estimates over train position significantly correlated with each participant's tendency to engage in category clustering during memory search as measured by  (Fig. 5C; r = 0.421, P < 0.05; with 2 outliers removed, r = 0.500, P < 0.01). In contrast, individual differences in overall discriminability of category patterns at study did not correlate with category clustering during recall (r = 0.268, P = 0.18; with 2 outliers removed, r = 0.251, P = 0.19).
We also found that fluctuations in the slope of these category-specific estimates on a trial-by-trial basis were related to trial-by-trial fluctuations in category clustering behavior within a given subject. For each trial, we calculated both the slope of classifier estimates (the “neural integration rate”) and the degree of category clustering, and performed a regression on these two measures. We found that these two measures were reliably positively related to one another (t-value of the slope of the regression: mean 0.476, SEM 0.160; t(28) = 2.98, P < 0.01), indicating a significant relationship between list-level fluctuations in neural integration rate and category clustering.
The training period is important for determining whether the classifier is sensitive to effects of integration of category representations over multiple item presentations. When the classifier was trained on the familiarization period, and tested on the study periods from the free-recall sessions, there was no increase in classifier estimate with train position (slope over train positions 1–3, based on weighted least-squares regression: mean 0.0010, SEM 0.0021, t(28) = 0.51, P = 0.31, 1-sided test compared with 0). Slope was significantly greater when the classifier was trained on the study period (t(28) = 3.12, P < 0.005). Furthermore, when the classifier was trained on the familiarization period, the slope of classifier estimates did not correlate with  (r = 0.00062, P = 0.997). A dependent correlations test showed that
  correlates significantly better with slope for study-session cross-validation than for familiarization-to-study classification (t(26) = 2.30, P < 0.05). Similarly, the slope of classifier estimates is more sensitive to differences in the amount of clustering on individual lists when the classifier is trained on the study period, compared with when it is trained on the familiarization period (t for the slope of the regression of
  on slope of classifier estimates: mean 0.190, SEM 0.159). This difference is marginally nonsignificant (t(28) = 1.96, P = 0.061).
These results suggest that the classifier with familiarization-period training is not sensitive to this integrative category-specific neural activity. According to the retrieved-context framework, two kinds of category-specific activity may be present in the neural signal: The item representations themselves (which are not integrative) and the retrieval cue (which has integrative properties). It may be that the familiarization-period training selectively identifies item representations, while the study-period training identifies a blend of item and context representations, which may explain the differential sensitivity of the two classification analyses. We return to this point in the discussion.
Reactivation of Category-Specific Patterns During Memory Search
According to retrieved-context models (indeed, many models of memory), when one remembers a past event, the memory system reactivates the pattern of neural activity that prevailed when that event occurred. This reactivation process has been used to describe remembering and reminiscence as a form of ”mental time travel“ (Tulving, 1993; Wheeler et al., 1995; Polyn et al., 2005; Danker and Anderson, 2010). Both the scalp EEG and the ECoG/depth electrode studies showed evidence for reactivation of category-specific oscillatory patterns during memory search, although the patterns recorded with ECoG/depth electrodes were of substantially higher fidelity.
These ECoG category-specific oscillatory patterns reactivate during memory search, and this reactivation tracks which category is being recalled by the participant on a moment-to-moment basis. There was reliable reactivation in frontal, prefrontal, temporal, medial temporal, hippocampal, and occipital electrodes (Fig. 4C; P < 0.05, permutation test). Notably, the category-specific occipital patterns observed while the stimulus was presented visually were only weakly reactivated during memory search. Classifier accuracy peaks during the 1 s before onset of vocalization, then drops during vocalization of the recalled item. In temporal electrodes, oscillatory patterns at all frequencies were reactivated; in medial temporal electrodes, delta, theta, alpha, and beta patterns were reactivated; and in frontal electrodes, delta, theta, and alpha patterns were reactivated.
The ECoG/depth electrode experiment also revealed reliable reactivation of category-specific patterns during the FFR period at frontal, prefrontal, temporal, medial temporal, hippocampal, and parietal electrodes (Fig. 4D; P < 0.05, permutation test). Occipital category-specific patterns were significantly less reactivated in FFR compared with IFR (t(9) = 3.76, P < 0.05, Bonferroni-corrected). Reactivation follows a similar time-course as in IFR, with classifier performance peaking around 1 s before onset of vocalization, then decreasing after vocalization. Temporal electrodes demonstrated reactivation in all frequency bands except high gamma; in frontal electrodes, theta, beta, and high-gamma power was reactivated; and in medial temporal electrodes, beta power was reactivated.
The global category-specific patterns observed at the scalp showed marginally nonsignificant reactivation during IFR (reactivation metric: mean = 0.0029, SEM = 0.0012; P = 0.057, permutation test). However, there was significant reactivation in scalp EEG during FFR (reactivation metric: mean = 0.0130, SEM = 0.0041; P < 0.005, permutation test). There was significant reactivation in delta and theta power. We attempted to characterize the time-course of reactivation (relative to recall onset) by examining reactivation in the segmented recall data; however, this less-sensitive analysis revealed no significant reactivation.
Pattern Fidelity During Retrieval Correlates with Category Clustering
Retrieved-context models describe how, during memory search, the retrieval cue is constantly updated by the information that is retrieved from memory. These models predict that when a participant recalls an item from a particular category, the category-specific information that is retrieved is integrated into the retrieval cue, making it a better match for other memories from the same category. This context retrieval operation leads to the prediction that category-specific oscillatory activity observed during recall should increase in fidelity as multiple items are recalled from the same category.
First, we established that reliable category-specific neural activity was present during memory search. A classifier was trained to identify the category associated with particular recalled items, using patterns of oscillatory activity recorded prior to the vocalization of that item. The classifier was then tested on the neural patterns preceding a left-out set of recalled items. Again, the larger scalp EEG dataset affords us a closer examination of the nuanced dynamics of these category-related patterns, though at the cost of anatomical localization of the signal. The scalp EEG–monitored participants showed reliable category-specific activity during recall: mean classifier performance was significantly above chance ( %) for recall tests that were administered immediately after the list (mean 36.6%, SEM 1.3%, t(28) = 2.47, P < 0.01), as well as during the FFR test administered at the end of the session (Fig. 6A; mean 42.7%, SEM 2.1%, t(28) = 4.44, P < 0.0001). During FFR, classifier accuracy was significantly greater than it was during IFR (t(28) = 2.55, P < 0.05).
Figure 6.

Category-specific patterns of neural activity during recall. (A) In the scalp EEG experiment, fidelity of category-specific patterns (measured using cross-validation of recall events) was greater during the final free recall period (FFR), which exhibited greater category clustering than the immediate free recall period (IFR). Error bars indicate 95% confidence intervals corresponding to a 1-tailed t-test versus chance (0.33̄; indicated by the dotted line). (B) During IFR, classifier performance was significantly higher for positions in the recall sequence where the previous item was from the same category as the current item (middle, terminal), when compared with positions in the recall sequence where the previous item was from a different category (isolated, initial). Classifier performance was also greater when the next item was the same category (initial, middle), compared with when the next item was a different category (isolated, terminal). Error bars indicate 95% confidence intervals corresponding to a one-tailed t-test versus chance (0.33̄; indicated by the dotted line).
Since  varies with list length, we used a different measure of semantic clustering, the ARC score (Roenker et al., 1971), to compare category clustering in IFR and FFR. In the scalp EEG experiment, the ARC score for IFR was 0.60 (SEM 0.02); the ARC score for FFR was 0.88 (SEM 0.02), and was significantly greater than IFR (t(28) = 14.93; P < 0.0001). A similar difference was observed in the ECoG experiment (IFR: mean 0.62, SEM 0.25; FFR: mean 0.85, SEM 0.03; t(11) = 3.65, P < 0.002). In other words, the later recall period gave rise to stronger category-related organization of responses during memory search. Given that category clustering was greater during FFR than during IFR, this suggests that the strength of category-specific activity during recall was related to the degree of category clustering. This proposed effect was observed for the scalp EEG experiment (as described above) but was not statistically reliable in the ECoG/depth electrode experiment (although there was a trend towards greater classifier performance during FFR in the parietal ROI).
As with our analyses of the study-period data, we examined whether the category identity of neighboring items in the recall sequence could influence classifier performance. In order to account for this, we examined the period from 1500 to 500 ms before vocalization onset, which cannot be influenced by adjacent recalls given the parameters of the wavelets we used to measure oscillatory power, and the criteria used to choose recall epochs. We averaged classifier performance over this interval. Again, FFR classifier performance was significantly greater than IFR classifier performance during this critical interval (t(28) = 1.98, P < 0.03, 1-sided test). This increased classifier performance for the FFR period was robust to the training set used to train the classifier: The same effect was observed when the classifier was trained on category-specific patterns from the study period, and was then applied to the IFR and FFR recall periods. Classifier performance was greater for FFR (reactivation metric: mean 0.0130, SEM 0.0041) than IFR (mean 0.0029, SEM 0.0012); this difference is significant (t(28) = 2.45, P < 0.05).
In FFR, significantly more same-category items are recalled successively, and the category-specific patterns (as measured by scalp EEG) are of higher fidelity than in IFR. This is in line with the predictions of retrieved-context models, which suggest that the retrieval cue will reliably be more category-specific during periods of category clustering. Retrieved-context models predict that we should also see variability in the fidelity of category-specific patterns during IFR. We confirmed this in a final series of analyses.
During IFR, the strength of the category-specific patterns measured by scalp EEG rise and fall as a function of whether a participant is producing a cluster of same-category responses or is transitioning from category to category (Fig. 6B). Clustered items were classified with greater accuracy than isolated items (t(28) = 2.51, P < 0.05). To further examine the influence of adjacent recalls on classifier performance, we used a 2-way within-subjects analysis of variance with category of the previous recall (same as the current category or different) and category of the next recall (same or different) as factors. The category of the previous recall is important, as the classifier can better identify the category of a middle or terminal item in a sequence of same-category recalls, when compared with an initial or isolated item (F1,28 = 10.89, P < 0.005). To rule out effects of adjacent recalls on our wavelet-based power measures, we examined the critical time interval of 1500 to 500 ms before vocalization onset, and found a significant difference between middle/terminal items and isolated/initial items (t(28) = 2.82, P < 0.005, 1-sided test). These results are consistent with retrieved-context models, which propose that category-specific activity is integrated over time during recall, and will therefore be stronger when the previous recall was from the same category as the current recall. Classifier performance was also greater for recalls in the initial or middle position of a sequence of same-category responses, when compared with isolated responses from a given category, and terminal responses from a sequence of same-category responses (F1,28= 4.38, P < 0.05). In other words, a recall associated with higher-fidelity category-specific activity will tend to be followed by a recall from the same category. This is consistent with the proposal that retrieved category-specific patterns are used to guide memory search. The influences of category of the previous recall and the category of the next recall did not interact (F1,28 < 1).
As with our study-period analyses, we ran a secondary analysis to control for effects of training set imbalances. Similar results were obtained when random sampling without replacement was used to obtain a training set with an equal number of epochs for each combination of category and cluster position bin. Classifier performance was greater for recalls preceded by an item of the same category (i.e., middle and terminal items), compared with items preceded by a recall of a different category (i.e., isolated and initial items; F1,28= 12.54, P < 0.005). Classifier performance was also significantly greater for recalls that were followed by an item of the same category (i.e., initial and middle items), compared with items that were followed by an item of a different category (i.e., isolated and terminal items; F1,28= 8.86, P < 0.01). There was no interaction between previous category and next category (F1,28= 2.87, P = 0.1).
Discussion
Category-specific topographic patterns of oscillatory activity, recorded both at the scalp and intracranially, allow us to examine how people create and search through the structures of memory. Using pattern classification techniques, we characterized the dynamics of category-specific activity during both study and memory search, allowing us to relate neural measures of oscillatory power to the strength of attribute-based cognitive representations characterized by retrieved-context models of human memory (Howard and Kahana, 2002; Howard, 2004; Sederberg et al., 2008; Polyn et al., 2009). The subsequent memory effect, in which subsequently remembered items elicit a stronger neural response in certain critical brain regions than subsequently forgotten items (Paller and Wagner, 2002), is used by researchers to implicate particular brain regions or neural signals in memory-related processes. A recent neuroimaging study showed that the strength of category-specific patterns elicited during study predicted whether an item would be remembered during a later paired-associates memory test, thus extending the subsequent memory effect to category-specific patterns of neural activity (Kuhl et al., 2012). The current results extend the Kuhl et al. finding from the domain of cued recall to the domain of free recall. The self-directed nature of this task allows us to examine the structures formed in memory, by examining the order with which the participant discovers the studied items during memory search. A recent study by Long et al. (2010) found a region of ventrolateral prefrontal cortex whose activity levels were sensitive to whether an item would be subsequently clustered according to its semantic category. Here, we examined category-specific oscillatory responses to study and recall events using both scalp EEG and ECoG/depth electrode recordings. Analysis of the ECoG/depth electrode recordings revealed that category-specific information was carried in many frequency bands, and in widespread brain regions during both study and free recall. In temporal lobe, the strength of these patterns during study predicted whether an item would be subsequently remembered. However, it was the global category-specific activity recorded with scalp EEG that provided evidence for the critical predictions of retrieved-context models raised in the introduction, regarding the relations between category-specific oscillatory activity and category clustering. The large scalp EEG dataset made it possible to investigate these predictions; future work with intracranially implanted patients (with more participants and an experimental design closer to the scalp EEG experiment) will allow us to determine the anatomical specificity of these effects.
Retrieved-context models of memory provide a framework for interpreting the functional relevance of these category-specific neural signals. These models describe memory search in terms of the interactions between an item representation and a contextual retrieval cue. Both of these representations may contain category-specific information, but each is characterized by distinct dynamics, raising the possibility of distinguishing between item-related and cue-related neural signals. In these models, the item representation is a pattern of activity that reflects the features or characteristics of the item that is being studied or being recalled; different items may be more or less prototypical members of a category depending on whether this representation is dominated by category-specific features or idiosyncratic item-specific features. Items that are more prototypical would be better identified by the classifier, and would tend to be better targeted by a category-specific retrieval cue; this account is consistent with the subsequent clustering effect presented in Figure 5A. The contextual representation integrates information from each studied item to create a retrieval cue enabling the participant to later target the contents of the study list in memory. If a participant integrated more category-specific information into the retrieval cue, then this would aid the classifier in identifying the category of the currently studied item, and would also support clustering by category during memory search. This scenario is consistent with the subsequent clustering effect presented in Figure 5B and C. This distinction between item and context representations may help us make sense of the different results obtained when a classifier is trained on a separate familiarization period versus the study periods themselves.
When the classifier is trained on the familiarization period, and tested on the study periods of the free-recall sessions, we observe an item-level subsequent clustering effect, but a null integration-based subsequent clustering effect; this is consistent with the idea that familiarization-period training identifies category-specific neural activity related to the item representation, but is relatively insensitive to cue-related neural activity. One potential reason the familiarization period would not provide a good characterization of cue-related category information is that participants are told that their memory for these items will not be tested; thus, if the construction of a retrieval cue is an intentional act that accompanies study, there is no demand for participants to engage this process.
The item-level subsequent clustering analysis revealed similar levels of classification performance for subsequently forgotten items and subsequently isolated items. Low classification performance for a particular item could be related to a number of factors, and it is not clear that the same process is responsible for the low classification performance on subsequently forgotten and subsequently isolated items. If attentional processes are not effectively engaged, the item will be poorly encoded, which will lead to poor classification and likely subsequent forgetting. Second, attention to idiosyncratic item-specific characteristics of a particular item may cause an item to be remembered, but without supporting category clustering of that item. These item-specific characteristics would not help a classifier determine which category the item was drawn from.
When the classifier is trained on the study periods of the free-recall sessions, and tested using a cross-validation procedure, we observe an integration-based subsequent clustering effect, but a null item-level subsequent clustering effect; this is consistent with the idea that study-period training identifies cue-related activity, but is less sensitive to item-level neural activity. Participants who tended to organize their memory search according to category showed a large increase in classifier performance with successively presented same-category items during study. This is consistent with a model in which category-specific activity reflects a retrieval cue that integrates category-related information from each studied item. These integrative effects revealed themselves at the level of participants (Fig. 5C) and at the level of individual lists, consistent with the idea that a highly category-specific retrieval cue will lead to category clustering for the entire list (and not just for a particular item). Retrieved-context models suggest that a classifier trained on the study period should be sensitive to item-related activity in addition to cue-related activity. However, integrative cue-related activity will be related to recently presented items in addition to the current item, and therefore this activity may obscure the item-level clustering effect.
Although the results reported here are consistent with retrieved-context models of memory, it is important to consider whether certain aspects of these results could be related to strategic behaviors on the part of participants, such as rehearsal. For example, participants might tend to covertly recall previously studied items as the list progresses. In this case, when several same-category items are studied successively, we might expect to see enhanced category-specific responses for the later items in the sequence, as participants are more likely to be covertly remembering the last few same-category items. In this alternate explanation for the category integration presented in Figure 5B, it is important to specify the mechanism by which this rehearsal takes place; as Laming (2008) points out, the process that generates rehearsals is likely the same process that generates recalls. Retrieved-context models are powerful enough to accomodate the possibility of covert retrievals during study; the same retrieval cue that guides search during free recall can be engaged during study. Future work combining computational modeling and pattern classification will be important to determine the relative plausibility of these alternate explanations of these results.
A second set of analyses revealed category-specific neural activity during memory search in both the ECoG/depth electrode and scalp EEG data-sets. Only a few studies have examined neural activity during free recall, using any neurorecording modality (Polyn et al., 2005; Sederberg et al., 2007; Gelbard-Sagiv et al., 2008; Long et al., 2010; Manning et al., 2011; Polyn et al., 2012). Polyn et al. (2005) showed, using fMRI, that brain-wide patterns of category-specific activity were reactivated when participants searched memory for studied material, and that the rise and fall of this category-specific hemodynamic activity predicted the category identity of recalled items. In the ECoG/depth electrode experiment, we found evidence for reactivation of the same category-specific oscillatory patterns characterized during the study period. In the scalp EEG experiment, these reactivation effects were reliable, but very weak. However, we found strong category-specific patterns in the recall periods of the scalp EEG experiment that did not match the patterns observed during study. How these recall-period category-specific patterns relate to those observed in the ECoG/depth electrode experiment is a question for future work. The recall-period category-specific patterns characterized with scalp EEG showed dynamics consistent with retrieved-context models of human memory. First, we found that these category-specific patterns were increased in strength during a final recall period characterized by strong category clustering, as compared with an immediate recall period characterized by more modest category clustering. Second, we found that even during the immediate recall period, these category-specific patterns increased in strength during periods of category clustering, when compared with periods where the participant was shifting between categories. These results are consistent with the idea from retrieved-context models that when an item is remembered, the retrieval cue integrates the reactivated information. Thus, each time an item from a particular category is remembered, retrieved-context models predict that the retrieval cue will become more category-specific, in line with both of these observations. Furthermore, we found that the strength of category-specific activity during recall of an item predicted the category of the next recalled item: Recalls associated with strong category-specific patterns were more likely to be followed by a recall from the same category, suggesting that this category-specific activity is used to guide memory search.
As in the above discussion of rehearsal dynamics, future work will be important to distinguish between alternate models of the retrieval process. One particularly interesting alternate model involves the possibility that the participant simultaneously remembers multiple items, and then reports these items as a cluster. This could account for the increase in classifier performance between the isolated and initial responses presented in Figure 6B, but would not explain the further increase in classifier performance for middle cluster positions. In a sense, the retrieved-context framework already has the potential to explain such “multiple retrieval” events. There are two types of retrieval events in this framework: Item retrieval and context retrieval. In standard implementations of retrieved-context models, each item retrieval elicits a context retrieval, which in turn elicits another item retrieval. However, it is possible that one could use the same state of context to elicit multiple item retrievals. In order to investigate this possibility more rigorously, it is important that we develop a better understanding of the neural correlates of context and item retrievals.
In this study, we used retrieved-context models of human memory as a framework to interpret the functional importance of various category-specific neural signals observed during study and memory search. However, this work only begins to tap the potential for computational modeling to inform neural investigations. In a number of cognitive domains, computational models are being used to bridge between the neural signals recorded while a participant performs a task and the behavioral measures characterizing that performance (Ratcliff et al., 2009; Purcell et al., 2010; Polyn et al., 2012; Davis et al., 2012). Polyn et al. (2012) used the context maintenance and retrieval (CMR) model of memory search (a retrieved-context model; Polyn et al. 2009) to interpret task-specific patterns of hemodynamic activity recorded as participants performed a free-recall task. They found that the discriminability of task-specific patterns of neural activity was related to the magnitude of the recency effect, and showed that a particular model parameter controlling integration rate could be used to explain individual differences in both the neural data (classifier performance in identifying task identity of a studied item) and the behavioral data (the tendency of the participant to initiate recall with the final studied item). Applying the model more closely to the data from the current study will allow us to better understand the similarities and differences between task organization and category organization. For example, in the current study, we did not observe a reliable relationship between category discriminability and the recency effect. This may be due to differences in how task and category information are processed by the neurocognitive system; task information represents a rapidly formed association between a study item and the circumstances in which it is encountered, whereas category information represents longstanding semantic associations between all of the members of a category. Computational models such as CMR provide a common framework for understanding both how these different forms of information are processed by the brain, and how they relate to the neural measures recorded during study and free recall.
Funding
This work was supported by the NIH (MH055687, MH061975, and NS067316); the National Science Foundation (1157432); and the Dana Foundation.
Notes
We thank Kenneth Norman, Joshua Jacobs, Gordon Logan, Geoff Woodman, John Burke, Ashwin Ramayya, James Kragel, and Zachary Cohen for useful discussions. We also thank Jonathan Miller, Richard Lawrence, John Burke, and Matthew Mollison for help collecting data, and Evan Stein for helping to organize testing logs. Conflict of Interest: None declared.
References
- Bousfield WA. The occurrence of clustering in the recall of randomly arranged associates. J Gen Psychol. 1953;49:229–240. [Google Scholar]
- Buzsáki G. Rhythms of the Brain. New York (NY): Oxford University Press; 2006. [Google Scholar]
- Canolty RT, Edwards E, Dalal SS, Soltani M, Nagarajan SS, Kirsch HE, Berger MS, Barbaro NM, Knight RT. High gamma power is phase-locked to theta oscillations in human neocortex. Science. 2006;313:1626–1628. doi: 10.1126/science.1128115. [DOI] [PMC free article] [PubMed] [Google Scholar]
- Danker JF, Anderson JR. The ghosts of brain states past: remembering reactivates the brain regions engaged during encoding. Psychol Bull. 2010;136:87–102. doi: 10.1037/a0017937. [DOI] [PMC free article] [PubMed] [Google Scholar]
- Davis T, Love BC, Preston AR. Learning the exception to the rule: model-based fMRI reveals specialized representations for surprising category members. Cereb Corxtex. 2012;22:260–273. doi: 10.1093/cercor/bhr036. [DOI] [PubMed] [Google Scholar]
- Duda RO, Hart PE, Stork DG. Pattern classification. 2nd ed. New York (NY): Wiley; 2001. [Google Scholar]
- Düzel E, Penny W, Burgess N. Brain oscillations and memory. Curr Opin Neurobiol. 2010;20:143–149. doi: 10.1016/j.conb.2010.01.004. [DOI] [PubMed] [Google Scholar]
- Freeman WJ. Spatial properties of an EEG event in the olfactory bulb and cortex. Electroencephalogr Clin Neurophysiol. 1978;44:586–605. doi: 10.1016/0013-4694(78)90126-8. [DOI] [PubMed] [Google Scholar]
- Fries P. A mechanism for cognitive dynamics: neuronal communication through neuronal coherence. Trends Cogn Sci. 2005;9:474–480. doi: 10.1016/j.tics.2005.08.011. [DOI] [PubMed] [Google Scholar]
- Fuster J, Bauer R, Jervey J. Cellular discharge in the dorsolateral prefrontal cortex of the monkey in cognitive tasks. Exp Neurol. 1982;77:679–694. doi: 10.1016/0014-4886(82)90238-2. [DOI] [PubMed] [Google Scholar]
- Gelbard-Sagiv H, Mukamel R, Harel M, Malach R, Fried I. Internally generated reactivation of single neurons in human hippocampus during free recall. Science. 2008;3:96–101. doi: 10.1126/science.1164685. [DOI] [PMC free article] [PubMed] [Google Scholar]
- Geller AS, Schleifer IK, Sederberg PB, Jacobs J, Kahana MJ. PyEPL: a cross-platform experiment-programming library. Behav Res Methods. 2007;39:950–958. doi: 10.3758/bf03192990. [DOI] [PMC free article] [PubMed] [Google Scholar]
- Gratton G, Coles MGH, Donchin E. A new method for off-line removal of ocular artifact. Electroencephalogr Clin Neurophysiol. 1983;55:468–484. doi: 10.1016/0013-4694(83)90135-9. [DOI] [PubMed] [Google Scholar]
- Haxby JV, Gobbini MI, Furey ML, Ishai A, Schouten JL, Pietrini P. Distributed and overlapping representations of faces and objects in ventral temporal cortex. Science. 2001;293:2425–2429. doi: 10.1126/science.1063736. [DOI] [PubMed] [Google Scholar]
- Herrmann CS, Grigutsch M, Busch NA. EEG oscillations and wavelet analysis. In: Handy T, editor. Event-Related Potentials: A Methods Handbook. Cambridge (MA): The MIT Press; 2005. pp. 229–260. [Google Scholar]
- Howard MW. Scaling behavior in the temporal context model. J Math Psychol. 2004;48:230–238. [Google Scholar]
- Howard MW, Kahana MJ. A distributed representation of temporal context. J Math Psychol. 2002;46:269–299. [Google Scholar]
- Jacobs J, Kahana MJ. Direct brain recordings fuel advances in cognitive electrophysiology. Trends Cogn Sci. 2010;14:162–171. doi: 10.1016/j.tics.2010.01.005. [DOI] [PMC free article] [PubMed] [Google Scholar]
- Jacobs J, Kahana MJ. Neural representations of individual stimuli in humans revealed by gamma-band ECoG activity. J Neurosci. 2009;29:10203–10214. doi: 10.1523/JNEUROSCI.2187-09.2009. [DOI] [PMC free article] [PubMed] [Google Scholar]
- Jacobs J, Kahana MJ, Ekstrom AD, Fried I. Brain oscillations control timing of single-neuron activity in humans. J Neurosci. 2007;27:3839–3844. doi: 10.1523/JNEUROSCI.4636-06.2007. [DOI] [PMC free article] [PubMed] [Google Scholar]
- Klimesch W. EEG alpha and theta oscillations reflect cognitive and memory performance: a review and analysis. Brain Res Rev. 1999;29:169–195. doi: 10.1016/s0165-0173(98)00056-3. [DOI] [PubMed] [Google Scholar]
- Kojima S, Goldman-Rakic PS. Delay-related activity of prefrontal neurons in rhesus monkeys performing delayed response. Brain Res. 1982;248:43–49. doi: 10.1016/0006-8993(82)91145-3. [DOI] [PubMed] [Google Scholar]
- Kuhl BA, Rissman J, Chun MM, Wagner AD. Fidelity of neural reactivation reveals competition between memories. Proc Natl Acad Sci USA. 2011;108:5903–5908. doi: 10.1073/pnas.1016939108. [DOI] [PMC free article] [PubMed] [Google Scholar]
- Kuhl BA, Rissman J, Wagner AD. Multi-voxel patterns of visual category representation during episodic encoding are predictive of subsequent memory. Neuropsychologia. 2012;50:458–469. doi: 10.1016/j.neuropsychologia.2011.09.002. [DOI] [PMC free article] [PubMed] [Google Scholar]
- Laming D. An improved algorithm for predicting free recalls. Cogn Psychol. 2008;57:179–219. doi: 10.1016/j.cogpsych.2008.01.001. [DOI] [PubMed] [Google Scholar]
- Lancaster JL, Woldorff MG, Parsons LM, Liotti M, Freitas CS, Rainey L, Kochunov PV, Nickerson D, Mikiten SA, Fox PT. Automated Talairach atlas labels for functional brain mapping. Hum Brain Mapp. 2000;10:120–131. doi: 10.1002/1097-0193(200007)10:3<120::AID-HBM30>3.0.CO;2-8. [DOI] [PMC free article] [PubMed] [Google Scholar]
- Liebe S, Hoerzer G, Logothetis N, Rainer G. Theta coupling between V4 and prefrontal cortex predicts visual short-term memory performance. Nat Neurosci. 2012;15:456–464. doi: 10.1038/nn.3038. [DOI] [PubMed] [Google Scholar]
- Loftus GR, Masson MEJ. Using confidence intervals in within-subject designs. Psychon Bull Rev. 1994;1:476–490. doi: 10.3758/BF03210951. [DOI] [PubMed] [Google Scholar]
- Long NM, Oztekin I, Badre D. Separable prefrontal cortex contributions to free recall. J Neurosci. 2010;30:10967–10976. doi: 10.1523/JNEUROSCI.2611-10.2010. [DOI] [PMC free article] [PubMed] [Google Scholar]
- Maldjian JA, Laurienti PJ, Kraft RA, Burdette JH. An automated method for neuroanatomic and cytoarchitectonic atlas-based interrogation of fMRI data sets. Neuroimage. 2003;19:1233–1239. doi: 10.1016/s1053-8119(03)00169-1. [DOI] [PubMed] [Google Scholar]
- Manning JR, Polyn SM, Baltuch G, Litt B, Kahana MJ. Oscillatory patterns in temporal lobe reveal context reinstatement during memory search. Proc Natl Acad Sci USA. 2011;108:12893–12897. doi: 10.1073/pnas.1015174108. [DOI] [PMC free article] [PubMed] [Google Scholar]
- Manns JR, Howard MW, Eichenbaum H. Gradual changes in hippocampal activity support remembering the order of events. Neuron. 2007;56:530–540. doi: 10.1016/j.neuron.2007.08.017. [DOI] [PMC free article] [PubMed] [Google Scholar]
- Martin A. The representation of object concepts in the brain. Annu Rev Psychol. 2007;58:25–45. doi: 10.1146/annurev.psych.57.102904.190143. [DOI] [PubMed] [Google Scholar]
- Miller EK, Erickson CA, Desimone R. Neural mechanisms of visual working memory in prefrontal cortex of the macaque. J Neurosci. 1996;16:5154. doi: 10.1523/JNEUROSCI.16-16-05154.1996. [DOI] [PMC free article] [PubMed] [Google Scholar]
- Norman KA, Polyn SM, Detre GJ, Haxby JV. Beyond mind-reading: multi-voxel pattern analysis of fMRI data. Trends Cogn Sci. 2006;10:424–430. doi: 10.1016/j.tics.2006.07.005. [DOI] [PubMed] [Google Scholar]
- Nunez PL, Srinivasan R. Electric fields of the brain: the neurophysics of EEG. 2nd ed. New York (NY): Oxford University Press; 2006. [Google Scholar]
- Nyhus E, Curran T. Functional role of gamma and theta oscillations in episodic memory. Neurosci Biobehav Rev. 2010;34:1023–1035. doi: 10.1016/j.neubiorev.2009.12.014. [DOI] [PMC free article] [PubMed] [Google Scholar]
- Paller KA, Wagner AD. Observing the transformation of experience into memory. Trends Cogn Sci. 2002;6:93–102. doi: 10.1016/s1364-6613(00)01845-3. [DOI] [PubMed] [Google Scholar]
- Polyn SM, Kahana MJ. Memory search and the neural representation of context. Trends Cogn Sci. 2008;12:24–30. doi: 10.1016/j.tics.2007.10.010. [DOI] [PMC free article] [PubMed] [Google Scholar]
- Polyn SM, Kragel JE, Morton NW, McCluey JD, Cohen ZD. The neural dynamics of task context in free recall. Neuropsychologia. 2012;50:447–457. doi: 10.1016/j.neuropsychologia.2011.08.025. [DOI] [PubMed] [Google Scholar]
- Polyn SM, Natu VS, Cohen JD, Norman KA. Category-specific cortical activity precedes retrieval during memory search. Science. 2005;310:1963–1966. doi: 10.1126/science.1117645. [DOI] [PubMed] [Google Scholar]
- Polyn SM, Norman KA, Kahana MJ. A context maintenance and retrieval model of organizational processes in free recall. Psychol Rev. 2009;116:129–156. doi: 10.1037/a0014420. [DOI] [PMC free article] [PubMed] [Google Scholar]
- Puff CR. Memory organization research and theory: the state of the art. In: Puff CR, editor. Memory Organization and Structure. New York (NY): Academic Press; 1979. pp. 3–17. [Google Scholar]
- Purcell BA, Heitz RP, Cohen JY, Schall JD, Logan GD, Palmeri TJ. Neurally constrained modeling of perceptual decision making. Psychol Rev. 2010;117:1113–1143. doi: 10.1037/a0020311. [DOI] [PMC free article] [PubMed] [Google Scholar]
- Ratcliff R, Philiastides MG, Sajda P. Quality of evidence for perceptual decision making is indexed by trial-to-trial variability of the EEG. Proc Natl Acad Sci USA. 2009;106:6539–6544. doi: 10.1073/pnas.0812589106. [DOI] [PMC free article] [PubMed] [Google Scholar]
- Roenker DL, Thompson CP, Brown SC. Comparison of measures for the estimation of clustering in free recall. Psychol Bull. 1971;76:45–48. [Google Scholar]
- Sederberg PB, Howard MW, Kahana MJ. A context-based theory of recency and contiguity in free recall. Psychol Rev. 2008;115:893–912. doi: 10.1037/a0013396. [DOI] [PMC free article] [PubMed] [Google Scholar]
- Sederberg PB, Kahana MJ, Howard MW, Donner EJ, Madsen JR. Theta and gamma oscillations during encoding predict subsequent recall. J Neurosci. 2003;23:10809–10814. doi: 10.1523/JNEUROSCI.23-34-10809.2003. [DOI] [PMC free article] [PubMed] [Google Scholar]
- Sederberg PB, Schulze-Bonhage A, Madsen JR, Bromfield EB, Litt B, Brandt A, Kahana MJ. Gamma oscillations distinguish true from false memories. Psychol Sci. 2007;18:927–932. doi: 10.1111/j.1467-9280.2007.02003.x. [DOI] [PMC free article] [PubMed] [Google Scholar]
- Solway A, Geller AS, Sederberg PB, Kahana MJ. Pyparse: a semiautomated system for scoring spoken recall data. Behav Res Methods. 2010;42:141–147. doi: 10.3758/BRM.42.1.141. [DOI] [PMC free article] [PubMed] [Google Scholar]
- Stricker JL, Brown GG, Wixted JT, Baldo JV, Delis DC. New semantic and serial clustering indices for the California Verbal Learning Test–Second Edition: background, rationale, and formulae. J Int Neuropsychol Soc. 2002;8:425–435. doi: 10.1017/s1355617702813224. [DOI] [PubMed] [Google Scholar]
- Summerfield C, Mangels JA. Coherent theta-band EEG activity predicts item-context binding during encoding. Neuroimage. 2005;24:692–703. doi: 10.1016/j.neuroimage.2004.09.012. [DOI] [PubMed] [Google Scholar]
- Talairach J, Tournoux P. Co-planar stereotaxic atlas of the human brain. Stuttgart: Verlag; 1988. [Google Scholar]
- Tallon-Baudry C, Bertrand O, Delpuech C, Permier J. Oscillatory gamma-band (30–70 Hz) activity induced by a visual search task in humans. J Neurosci. 1997;17:722–734. doi: 10.1523/JNEUROSCI.17-02-00722.1997. [DOI] [PMC free article] [PubMed] [Google Scholar]
- Tallon-Baudry C, Bertrand O, Delpuech C, Perner J. Stimulus specificity of phase-locked and non-phase-locked 40 Hz visual responses in human. J Neurosci. 1996;16:4240–4249. doi: 10.1523/JNEUROSCI.16-13-04240.1996. [DOI] [PMC free article] [PubMed] [Google Scholar]
- Tulving E. What is episodic memory? Curr Dir Psychol Sci. 1993;2:67–70. [Google Scholar]
- Wheeler MA, Stuss DT, Tulving E. Frontal lobe damage produces episodic memory impairment. J Int Neuropsychol Soc. 1995;1:525–536. doi: 10.1017/s1355617700000655. [DOI] [PubMed] [Google Scholar]
- Yuval-Greenberg S, Tomer O, Keren AS, Nelken I, Deouell LY. Transient induced gamma-band response in EEG as a manifestation of miniature saccades. Neuron. 2008;58:429–441. doi: 10.1016/j.neuron.2008.03.027. [DOI] [PubMed] [Google Scholar]