

Abstract
A number of studies have reported that, “relative to brain size,” the midsagittal corpus callosum cross-sectional area (CCA) in females is on average larger than in males. However, others suggest that these may be spurious differences created in the CCA-to-brain-size ratio because brain size tends to be larger in males. To help resolve this controversy, we measured the CCA on all 316 magnetic resonance imaging (MRI) scans of normal subjects (18–94 years) in the OASIS (Open Access Series of Imaging Studies) cross-sectional dataset, and used multiple regression analysis to statistically control for the confounding effects of brain size and age to test the null hypothesis that the average CCA is not different between genders. An additional analysis was performed on a subset of 74 young adults (37 males and 37 females; 18–29 years) matched closely to brain size. Our null hypothesis was rejected in both analyses. In the entire sample (n= 316), controlling for brain size and age, the average CCA was significantly (P< 0.03) larger in females. The difference favoring females was more pronounced in the young adults cohort (P< 0.0005). These results provide strong additional evidence that the CCA is larger in females after correcting for the confounding effect of brain size.
Keywords: automatic segmentation, connectivity, gender differences, multiple regression analysis, neuroimaging
Introduction
De Lacoste-Utamsing and Holloway (1982) first suggested that on average, “relative to brain size,” the corpus callosum (CC) midsagittal cross-sectional area (CCA) in females may be larger than in males. Their conclusions were based on measurements of CCA in 14 postmortem brains (5 females and 9 males). They were able to replicate their original findings in an independent sample of 16 brains (8 females and 8 males) in a later study (Holloway and de Lacoste 1986). Subsequently, the findings were replicated on 3 independent autopsy samples (total n= 119) (Holloway et al. 1993). The latter work also reviewed 25 studies on CC sexual dimorphism published before 1991 and noted that a large majority of the studies that claimed no significant sexual dimorphism were, in fact, consistent with their own findings if they considered the “relative” size of CC. A later study that typifies the observation by Holloway et al. is that of Oka et al. (1999) who in a sample of 67 adults (34 females and 33 males) did not find a statistically significant difference between males and females in the CCA on magnetic resonance imaging (MRI) scans. Mean (± SD) CCA was determined to be 657 ± 80 mm2 in females and 655 ± 85 mm2 in males. However, the authors did not compute or compare the ratio of the CCA with brain size between groups. Given the larger average brain size in males, it is quite likely that Oka et al. would have found a significant group difference in favor of females in the relative size measure.
On the other hand, Bishop and Wahlsten (1997) performed a meta-analysis of 49 studies published before 1994, which included most of the studies reviewed by Holloway et al. (1993), but came to the seemingly opposite conclusion that there is no evidence suggesting a significant sex difference in the size of the CC! In spite of this apparent contradiction between the conclusions reached by Holloway et al. and Bishop and Wahlsten while reviewing overlapping literature, a closer examination of these works reveals that the questions being considered were, in fact, subtly different.
The difference is highlighted in a study (Smith 2005) that elucidates the distinction between the concepts: relative to brain size and “statistical control for brain size as a confounding effect.” Smith performed a meta-analysis of 21 studies published before 2003 and concluded that there is strong support for the idea that on average the relative (relative to some measure of brain size) size of the CC in females is larger than in males. However, he points out that in order to “statistically control” the confounding effect of brain size when comparing the CCA between groups the proper approach is to use statistical procedures such as analysis of covariance, multiple regression, or partial correlations. In this paper, we used multiple regression analysis to control the confounding effects of brain size and age. Therefore, any differences observed can be said to be in the average CCA after statistically controlling brain size.
Regardless of whether gender differences are found in relative size of the CCA or in the CCA itself after statistically controlling for brain size, it has been contended that any observed difference between groups is not gender specific but may be due to differences in brain size (Peters 1988; Going and Dixson 1990; Jäncke et al. 1997; Bermudez and Zatorre 2001; Leonard et al. 2008; Tepest et al. 2010; Bruner et al. 2012). It is suggested that smaller brains may have relatively larger CC regardless of gender. And since the average brain size in females is smaller than in males, the observations may be due to comparing groups with different average brain sizes and not due to gender. Hitherto this point has not been refuted. In the current paper, noting that there is a substantial overlap between brain size distributions in males and females, we compared the CCA between 2 groups of young adult females and males that had been closely matched for brain size. Therefore, any observed difference between CCA cannot be attributed to groups having different average brain sizes. As far as we are aware, none of the previous studies have used subjects matched for brain size in investigating the current question.
Matching for brain size between groups and using what is considered to be an appropriate statistical control for brain size, however, does not fully explain the considerable disparity in the results and conclusions that have been hitherto reported in the literature on sexual dimorphism of the CC. In general, failure to detect a statistically significant difference in measurements between groups does not imply that no true difference exists. It may merely mean that on the basis of sample size and measurement errors the statistical test used was insufficiently powered to detect a true difference (Elster et al. 1990). This is especially true in the study of CCA because, firstly, as many authors have noted, the size and shape of CC vary considerably among individuals (Byne et al. 1988; Peters 1988; Clarke et al. 1989; Elster et al. 1990; Allen et al. 1991; Smith 2005), which can completely mask group differences. Therefore, a large sample size is required to demonstrate a significant gender difference. In this study, we used a sample size of 316 subjects from the publicly available Open Access Series of Imaging Studies (OASIS) MRI database (Marcus et al. 2007), which we believe to be the largest used to date to study sexual dimorphism in CC.
Secondly, measurement of CCA is particularly error-prone for several reasons, which add to the inherent variability of CCA, making it even more difficult to detect a true difference if any indeed exists. Studies based on postmortem brains usually include small samples and could suffer from measurement errors due to fixation and deformation of the brains. An advantage of MRI is that brains can be measured in vivo in larger samples, but it is more difficult to estimate the brain size using MRI. Early MRI studies of gender differences in CC suffered from the fact that only a single thick midsagittal slice was available (Oppenheim et al. 1987; Byne et al. 1988; Clarke et al. 1989; Weis et al. 1989; Elster et al. 1990; Allen et al. 1991; Rauch and Jinkins 1994; Constant and Ruther 1996; Oka et al. 1999). Error would thus be introduced due to partial volume effects, and the fact that the single slice almost always differs from the true midsagittal plane (MSP) but cannot be corrected. It has been shown that variability in appearance of CC attributable to differences in the orientation of the MSP can result in large measurement errors (Rauch and Jinkins 1996). Also the brain size cannot be estimated from a single slice, necessitating the use of less accurate proxy markers of the brain size, such midsagittal cerebral area (Elster et al. 1990; Allen et al. 1991; Rauch and Jinkins 1994; Constant and Ruther 1996), midsagittal skull surface (Johnson et al. 1994), or the cube power of the basion–vertex distance (Constant and Ruther 1996).
The high-resolution 3D MRI volumes available in OASIS allowed us to correct for slice position by using a fully automated MSP detection program (Ardekani et al. 1997), following which the 3D MRI volume was resliced to correct for head tilt (i.e. to have nearly zero yaw and roll angles). The OASIS database also provides automatically determined estimates of the total intracranial volume (eTIVs; Buckner et al. 2004) that can be readily used for controlling brain size.
A further source of variability in the data is that in almost all previous work, the CC was delineated manually on the MSP, which introduces considerable subjectivity into the process. In this study, we used a fully automatic multiatlas-based method for CC segmentation (Aljabar et al. 2009; Cabezas et al. 2011; Ardekani et al. 2012) for this purpose.
Finally, a novelty of the study presented here is that we utilize publicly available MRI data from the OASIS database. OASIS explicitly authorizes redistribution of data derived from their database. Therefore, we have made our CC segmentations and area measurements available publicly (http://www.nitrc.org/projects/art) which facilitates independent reanalyses and examination of the data. It is hoped that the availability of this completely transparent and easily accessible dataset would help in resolving this long-standing and often contentious debate in the scientific community.
Materials and Methods
MRI Data
We utilized the OASIS cross-sectional dataset (Marcus et al. 2007) which includes MRI brain scans from 416 right-handed subjects. Of these, we excluded the 100 subjects with dementia to avoid the confounding effects of Alzheimer's disease which is known to influence CC size (Teipel et al. 2002; Wang et al. 2006; Di Paola et al. 2010; Frederiksen et al. 2011). We used the 3D magnetization prepared rapid gradient-echo (MP-RAGE) structural MRI scans of the remaining 316 subjects (119 males and 197 females; ages: 18–94) to investigate the putative sex differences in CC size. Thus, data from “all” normal subjects in the OASIS cross-sectional dataset were employed without exception. Details of subject demographics, inclusion/exclusion criteria, MRI acquisition protocol, and preprocessing steps are given elsewhere (Marcus et al. 2007). The age and sex distribution is reproduced in Table 1.
Table 1.
Age characteristics of the data set as given by Marcus et al. (2007)
| Age group | n | Mean | Male | Female |
|---|---|---|---|---|
| <20 | 19 | 18.53 | 10 | 9 |
| 20s | 119 | 22.82 | 51 | 68 |
| 30s | 16 | 33.38 | 11 | 5 |
| 40s | 31 | 45.58 | 10 | 21 |
| 50s | 33 | 54.36 | 11 | 22 |
| 60s | 25 | 64.88 | 7 | 18 |
| 70s | 35 | 73.37 | 10 | 25 |
| 80s | 30 | 84.07 | 8 | 22 |
| ≥90 | 8 | 91.00 | 1 | 7 |
| Total | 316 | 45.08 | 119 | 197 |
The OASIS database also provides an automatically determined (Buckner et al. 2004) eTIV which we used as an independent variable to statistically control for brain size when comparing CCA differences between gender groups.
Corpus Callosum Segmentation
An automated multiatlas-based algorithm was used for segmentation of the CC cross-sectional area from 3D structural MRI scans (Aljabar et al. 2009; Cabezas et al. 2011; Ardekani et al. 2012). Our atlas set that consisted of 38 scans was developed as follows:
The MSP was detected using the automated algorithm developed by Ardekani et al. (1997).
The anterior and posterior commissures (AC–PC) were detected on the MSP using an automated approach (Ardekani and Bachman 2009).
Using the MSP and AC–PC information, a midsagittal slice in a standardized coordinates system was reconstructed using trilinear interpolation so that the center of the slice field of view was exactly the middle point between the AC and PC; the x-axis was parallel to the AC–PC line pointing from the AC to the PC; and the y-axis was perpendicular to the AC–PC line on the MSP pointing from the superior to the inferior direction.
The CC was manually traced on the midsagittal slice using the ITK-SNAP software (Yushkevich et al. 2006).
Figure 1 shows an example of the midsagittal slice in the standard orientation with manually traced CC. The above procedure was repeated for each of the 38 scans in our atlas set. A pair of 2D images was stored for each atlas: the gray-scale midsagittal slice and a binary image of the CC segmentation.
Figure 1.

Automatically detected MSP in a standard orientation. The automatically detected AC–PC locations are shown by the plus signs. The rectangular bounding box is the search region for the CC determined based on a priori information obtained from the manually defined atlas set.
To automatically find the CC on a test image:
The midsagittal slice in the standard orientation was found using the exact procedure as above steps (1–3).
A rectangular bounding box was defined on the midsagittal slice that contained the CC. The rectangular region was specified in terms of its “superior-anterior” and “inferior-posterior” corners. The coordinates of these points were determined based on information obtained from the atlas set. The “superior-anterior” corner coordinates were (x, y) = (−57.75, −47.75) mm and the “inferior-posterior” corner coordinates were (x, y) = (52.25, 12.25) mm. The bounding box is shown in Figure 1.
All atlases were nonlinearly registered to the test image using the Automatic Registration Toolbox intersubject registration module (Ardekani et al. 2005) which has been found to be one of the most accurate intersubject registration algorithms available (Klein et al. 2009). The nonlinear transformation was only found within the rectangular bounding box, greatly accelerating the registration process.
The nonlinear transformations were applied to the binary CC images of the atlas set. Each transformation independently predicted the CC location on the test image. The final consensus segmentation was obtained using the vote rule (Rohlfing et al. 2004).
We segmented all 316 scans in our cohort using this method. The computation time per scan was less than 1 min on a Linux workstation with 2.4 GHz clock speed. The segmentations as well as the midsagittal slices of all images are available as Supplementary Material. In approximately 20% of the cases, minor manual editing of the CC was required. This was also performed using the ITK-SNAP software by one of the authors (K.F.) who was blind to the subjects' gender and age.
Statistical Analysis
The following multiple regression model was considered for statistical testing:
| (1) |
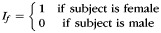
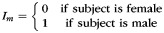
The precise definitions of all variables in this model are given in Table 2. Briefly, y represents the CCA, If and Im are female and male indicator functions, respectively; x1 represents age; m1 is the sample mean of x1; x2 is eTIV raised to the power two-third as suggested by Smith (2005); m2 is the sample mean of x2; μf, μm, β1, and β2 are unknown model parameters, and e is a random error term assumed to have zero mean and be normally distributed. A priori, we expect β1 to be negative, that is, the CCA to decrease with age. We expect β2 to be positive, that is, the CCA to increase with cranial capacity. Parameters μf and μm are female and male marginal means, respectively.
Table 2.
Definitions of variables in the statistical model (1)
| Notation | Definition |
|---|---|
| y | Corpus CCA (mm2) |
| x1 | Age (years) |
 |
Sample mean of x1 |
| x2 | Two-third power of the eTIV (cm2) |
 |
Sample mean of x2 |
| β1 | Model parameter (mm2/year) |
| β2 | Model parameter (mm2/cm2) |
 |
Female indicator function |
 |
Male indicator function |
| µf | Model parameter (mm2)–marginal mean for females |
| µm | Model parameter (mm2)–marginal mean for males |
| e | Zero-mean normally distributed error |
The model parameters are estimated using the standard procedure:
| (2) |
where y is an (n × 1) matrix with elements yi and X is an (n × 4) matrix with rows 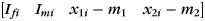 , where the subscript i indicates the value of the variable for subject i.
Based on the above model, we tested three null hypotheses: (1) β1= 0, that is, there is no linear association between age and the CCA; (2) β2= 0, that is, there is no linear association between CCA and the cranial capacity variable x2; and (3) μf= μm, that is, all things being equal (age and eTIV), there is no difference between the male and female CCA. The three hypotheses were tested using the following three statistics:
 |
(3) |
 |
(4) |
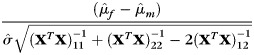 |
(5) |
where  estimates the noise variance and is given by
| (6) |
Under the null hypothesis, all three statistics in (3–5) have central t distributions with (n− 4) degrees of freedom.
Pairing for Intracranial Volume
As mentioned previously, a major persistent criticism of the studies that find greater either relative or corrected CCA in females is that the observed differences are not gender specific but due to different average brain sizes (Peters 1988; Going and Dixson 1990; Jäncke et al. 1997; Bermudez and Zatorre 2001; Leonard et al. 2008; Tepest et al. 2010; Bruner et al. 2012). To address this issue, we analyzed data from a subset of subjects that were closely matched for eTIV and age. In this section, we explain the automated and objective method used for pairing subjects with similar eTIV, each pair consisting of one female and one male subject. To avoid the confounding age effects we only considered the subjects between 18 and 29 years old for pairing because the CCA does not change appreciably with age in normal adults in this age range (Johnson et al. 1994). There were nm= 61 males and nf= 77 females in this age group (Table 1). To match for eTIV, we only considered pairing females and males whose cranial capacity measure x2 (Table 2) differed by less than 1 cm2. However, this criterion alone is not sufficient for objective pairings of subjects because, for example, a given male subject could be matched to more than 1 female and vice versa. To objectively and uniquely match the subjects, we considered every possible pairings nm × nf and computed all the corresponding absolute differences in the cranial capacity measure |x2i− x2j|, where i= 1,2,…,nm indexes the male subjects, and j= 1,2,…,nf indexes the female subjects. We then paired the 1 male and the 1 female with the minimum distance |x2i− x2j| and removed them from the cohort. Following this step, the number of possible pairings was reduced to (nm− 1) × (nf− 1). Among these, again we chose the pair with the minimum distance |x2i− x2j|. The procedure was repeated until all possible pairings had been achieved, that is, there were no remaining pairs with |x2i− x2j| < 1.0 cm2. The above procedure resulted in 37 pairs of males and females. We then tested for CCA differences in this group using the statistical model described above. A spreadsheet of the pairings that resulted from this procedure is provided as Supplementary Material.
Results
For the entire cohort of 316 subjects, there was a significance linear association between age and CCA (the null hypothesis β1= 0 was rejected [t(312) = −5.39; P< 10−6]). CCA decreased with increasing age. There was also a significant linear association between the intracranial capacity and CCA (the null hypothesis β2= 0 was also rejected [t(312) = 7.56; P< 10−12]). CCA increased with cranial capacity. Most importantly, a gender difference in CCA was observed with females having a larger area than males (the null hypothesis of equal sex effects μf = μm was rejected [t(312) = 2.24; P< 0.03]). Estimates of the marginal means for females and males were  and
and  , respectively.
In the cohort of 74 young adults matched for intracranial capacity, age was not associated with CCA [t(70) = 1.52; P= 0.133]. However, intracranial capacity was associated with CCA [t(70) = 2.32; P= 0.023]. Most significantly, when males and females were matched for intracranial capacity, female CCA was still significantly greater than male CCA [t(70) = 3.69; P< 0.0005].
Discussion
Using a public database consisting of 316 normal right-handed subjects, with ages that encompass a broad range of the adult human life span, we were able to confirm that there is a sexual dimorphism in the CCA, being larger in females in comparison with males by a few percent. As predicted, there was also a significant linear tendency for the CCA to decrease with age. Not surprisingly, larger brains tended to have larger CCA.
When reviewing the literature on sexual dimorphism of CC, it is helpful to consider 3 distinct random variables. The first random variable is some measure of “brain size,” for example, the brain weight (Clarke et al. 1989; Witelson 1985) or its two-third power (Going and Dixson 1990; Holloway et al. 1993) as used in some postmortem studies, brain volume (Tepest et al. 2010), forebrain volume (Jäncke et al. 1997; Bermudez and Zatorre 2001) or total intracranial volume (Johnson et al. 1994; Sullivan et al. 2001; Mitchell et al. 2003) or its two-third power (Smith 2005). Regardless, let x2 denote this random variable. It is well known that the average x2 in males is larger than in females. The second random variable is the CCA, which we denote by y. Finally, the third random variable, denoted by r, is the ratio of y to x2, that is, r= y/x2. Thus, r is not directly measured but is obtained by dividing the first 2 random variables. This is the random variable considered in the majority of studies on the present topic. There is a fairly broad consensus in the literature (Holloway et al. 1993; Smith 2005) that r in females is statistically significantly larger than in males. The main criticism of using r is that the observed differences are spuriously created because the random variable r is formed by using a denominator (x2) that is known to be sexually dimorphic (Bishop and Wahlsten 1997). However, others point out that this statistical pattern of sexual dimorphism is specific to CC, in that, in other neural structures, such as cerebellum, hippocampus, and thalamus, while the absolute sizes are larger in males, the relative sizes are not significantly different between genders (Holloway et al. 1993).
The question studied in the present paper is not whether r is different between genders, but whether the second random variable y representing CCA is different between females and males after statistically controlling for the confounding effect of the first random x2 representing brain size. There is no dispute between researchers that to study this particular question an appropriate statistical method is multiple regression analysis, analysis of covariance, or partial correlation (Holloway et al. 1993; Constant and Ruther 1996; Bishop and Wahlsten 1997; Smith 2005). In this paper, we used multiple linear regression to show that the CCA in females is on average larger than in males after controlling brain size and age.
Regardless of whether the ratio random variable r or the random variable y representing CCA is compared between female and male groups, it has been contended by many authors including in recent papers (Peters 1988; Going and Dixson 1990; Jäncke et al. 1997; Bermudez and Zatorre 2001; Leonard et al. 2008; Tepest et al. 2010; Bruner et al. 2012) that the observed differences are not gender specific but brain-size specific. The idea is that as brain size increases, the CC does not keep pace, such that subjects with larger brain size have a relatively smaller CC regardless of their gender. Peters notes (Peters 1988) that: “… there is no reason to assume that whatever can or cannot be said about sex differences in corpus callosum parameters cannot also be said more generally about large and small brains.” Since the 2 groups are not only different in gender, but also different in average brain size, this contention has been difficult to refute. To address this issue, we used a completely automated method that matched 37 pairs of female–male subjects very closely for intracranial capacity. The mean (±SD) x2 was 133.43 (±5.64) cm2 in females and 133.47 (±5.63) cm2 in males. Thus, any difference in CC size could not be attributed to different brain sizes. The gender differences detected in CCA in this sub-cohort were even more reliable than the entire cohort. Not surprisingly, there was no significant linear association between age and CCA in this gender/brain size matched sub-cohort because, in the narrow age range considered, the brain was not expected to undergo major structural changes. However, as expected the linear association between the CCA and the intracranial capacity still remained in this sub-cohort. As far as we know, this is the first study in which the female and male groups have been matched for brain size. Therefore, the differences detected cannot be attributed to groups having different brain sizes.
The current study has a number of advantages over previous studies on gender differences in CCA. The MRI data are taken from an easily accessible public database, which also provides eTIVs. The entire available data of normal subjects in the OASIS cross-sectional study were used. The CC segmentations and the corresponding area measurements are made publicly available for independent analyses. Using these data, our results can be easily replicated by using the “general linear model” analysis under standard statistical software (e.g. SPSS, IBM Corp.) with CCA as the dependent variable, sex as a fixed factor, and age and intracranial capacity variable (x2) as covariates. Our sample size of 316 is the largest sample size used to date for addressing gender differences in CC size. As mentioned above, the issue of brain size differences is addressed by an automated cranial capacity matching process which produces a unique set of pairings between male and female subjects with nearly equal brain size. Furthermore, we have made the pairings and the corresponding measurements publicly available. We used an automated technique (Ardekani et al. 1997) for detecting the MSP on the 3D high-resolution MP-RAGE MRI scans, and measured the CCA on the MSP after reslicing the MRI volume by trilinear interpolation to zero the yaw and roll angles. The importance of applying a consistent and repeatable method for defining the midsagittal slice in all subjects has been emphasized by Rauch and Jinkins (1996) and Mitchell et al. (2003). We also used an automated multiatlas-based method for CC segmentation in the midsagittal slice (Aljabar et al. 2009; Cabezas et al. 2011; Ardekani et al. 2012), which required only minimal manual intervention in a small number of cases, thus largely avoiding the subjectivity of manual segmentations that have been hitherto used when studying the CC.
We did not segment the CC into its subdivisions (splenium, isthmus, body, genu, rostrum, etc.). To this date, the majority of methods for subdividing the CC have been purely geometrically based (e.g. splenium as the posterior fifth of CC) (Witelson 1985; Weis et al. 1991; Hampel et al. 1998). However, it has been shown that significant variability can be introduced into the measurements with different methods of subdivision (Constant and Ruther 1996). We believe that using the standard methods of subdivision would make analyses prone to Type I and Type II errors. Currently, however, there is a promising technique based on fiber tracking using diffusion tensor imaging (DTI) that has the potential of producing anatomically based segmentations of the CC (Abe et al. 2004; Huang et al. 2005; Styner et al. 2005; Hofer and Frahm 2006). In the OASIS database, however, DTI was not available. In the future, we propose to investigate sex differences in CC subdivisions that have been obtained based on DTI and tractography.
The CCA can be affected by the number, density, and composition of callosal fibers with different diameters. In this paper, it has been shown that on average, for pairs of female and male subjects with equal brain sizes and similar ages, the CCA is larger in the female by a few percent. Given that postmortem studies of callosal fibers in normal subjects have either found no difference in fiber density between sexes (Aboitiz et al. 1992) or a denser fiber packing in females (Highley et al. 1999), it can be inferred that for a given brain size, the female cerebral hemispheres are more extensively interconnected. The relevance of this finding to theories of the evolution of the brain that depend upon the mechanism of sexual selection (Holloway 1990; Geary 1998; Hirnstein et al. 2008), and theories that relate individual differences in behavior (McGee 1979) and functional and structural brain asymmetries (McGlone 1980; Voyer 1996; Sommer et al. 2004; Wallentin 2009) to CC morphology remains a topic of future investigation. In particular, future studies are needed that relate macro- and microstructural CC morphology to behavior and functional and structural brain asymmetries.
Supplementary Material
The standardized midsagittal slices, automated CC segmentations, and area measurements of all 316 subjects studied in this paper are available online at http://www.nitrc.org/projects/art. In addition, the list of the 74 paired young adult subjects and their corresponding CCA measurements are provided. The data can also be obtained directly from the corresponding author.
Funding
The analysis and manuscript preparation were supported by R01 DC007658. National Institute of Health (grants P50 AG05681, P01 AG03991, R01 AG021910, P50 MH071616, U24 RR021382, R01 MH56584 to OASIS project).
Notes
We thank our colleagues responsible for the OASIS project for making the MRI data available. The comments of Diana Sidtis are gratefully appreciated. Conflict of Interest: None declared.
References
- Abe O, Masutani Y, Aoki S, Yamasue H, Yamada H, Kasai K, Mori H, Hayashi N, Masumoto T, Ohtomo K. Topography of the human corpus callosum using diffusion tensor tractography. J Comput Assist Tomogr. 2004;28:533–539. doi: 10.1097/00004728-200407000-00016. doi:10.1182/blood-2007-10-116129. [DOI] [PubMed] [Google Scholar]
- Aboitiz F, Scheibel AB, Fisher RS, Zaidel E. Fiber composition of the human corpus callosum. Brain Res. 1992;598:143–153. doi: 10.1016/0006-8993(92)90178-c. : [DOI] [PubMed] [Google Scholar]
- Aljabar P, Heckemann RA, Hammers A, Hajnal JV, Rueckert D. Multi-atlas based segmentation of brain images: atlas selection and its effect on accuracy. Neuroimage. 2009;46:726–738. doi: 10.1016/j.neuroimage.2009.02.018. : [DOI] [PubMed] [Google Scholar]
- Allen LS, Richey MF, Chai YM, Gorski RA. Sex differences in the corpus callosum of the living human being. J Neurosci. 1991;11:933–942. doi: 10.1523/JNEUROSCI.11-04-00933.1991. : [DOI] [PMC free article] [PubMed] [Google Scholar]
- Ardekani BA, Bachman AH. Model-based automatic detection of the anterior and posterior commissures on MRI scans. Neuroimage. 2009;46:677–682. doi: 10.1016/j.neuroimage.2009.02.030. doi:10.1056/NEJMct0805626. [DOI] [PMC free article] [PubMed] [Google Scholar]
- Ardekani BA, Guckemus S, Bachman A, Hoptman MJ, Wojtaszek M, Nierenberg J. Quantitative comparison of algorithms for inter-subject registration of 3D volumetric brain MRI scans. J Neurosci Methods. 2005;142:67–76. doi: 10.1016/j.jneumeth.2004.07.014. doi:10.1182/blood-2009-03-201053. [DOI] [PubMed] [Google Scholar]
- Ardekani BA, Kershaw J, Braun M, Kanno I. Automatic detection of the mid-sagittal plane in 3-D brain images. IEEE Trans Med Imaging. 1997;16:947–952. doi: 10.1109/42.650892. doi:10.1200/JCO.2009.25.4250. [DOI] [PubMed] [Google Scholar]
- Ardekani BA, Toshikazu I, Bachman A, Szeszko PR. Multi-atlas corpus callosum segmentation with adaptive atlas selection. Proceedings of the ISMRM; Melbourne, Australia. 2012. doi:10.1182/blood-2005-02-0522. [Google Scholar]
- Bermudez P, Zatorre RJ. Sexual dimorphism in the corpus callosum: methodological considerations in MRI morphometry. Neuroimage. 2001;13:1121–1130. doi: 10.1006/nimg.2001.0772. doi:10.1200/JCO.2009.27.9158. [DOI] [PubMed] [Google Scholar]
- Bishop KM, Wahlsten D. Sex differences in the human corpus callosum: myth or reality? Neurosci Biobehav Rev. 1997;21:581–601. doi: 10.1016/s0149-7634(96)00049-8. doi:10.3324/haematol.11644. [DOI] [PubMed] [Google Scholar]
- Buckner RL, Head D, Parker J, Fotenos AF, Marcus D, Morris JC, Snyder AZ. A unified approach for morphometric and functional data analysis in young, old, and demented adults using automated atlas-based head size normalization: reliability and validation against manual measurement of total intracranial volume. Neuroimage. 2004;23:724–738. doi: 10.1016/j.neuroimage.2004.06.018. doi:10.3324/haematol.2011.043372. [DOI] [PubMed] [Google Scholar]
- Bruner E, de la Cuetara JM, Colom R, Martin-Loeches M. Gender-based differences in the shape of the human corpus callosum are associated with allometric variations. J Anat. 2012;220:417–421. doi: 10.1111/j.1469-7580.2012.01476.x. [DOI] [PMC free article] [PubMed] [Google Scholar]
- Byne W, Bleier R, Houston L. Variations in human corpus callosum do not predict gender: a study using magnetic resonance imaging. Behav Neurosci. 1988;101:222–227. doi: 10.1037//0735-7044.102.2.222. doi:10.1016/S0140-6736(10)61424-9. [DOI] [PubMed] [Google Scholar]
- Cabezas M, Oliver A, Lladó X, Freixenet J, Cuadra MB. A review of atlas-based segmentation for magnetic resonance brain images. Comput Methods Programs Biomed. 2011;104:158–177. doi: 10.1016/j.cmpb.2011.07.015. doi:10.1182/blood-2011-05-355081. [DOI] [PubMed] [Google Scholar]
- Clarke S, Kraftsik R, van der Loos H, Innocenti GM. Forms and measures of adult and developing human corpus callosum: is there sexual dimorphism? J Com Neurol. 1989;280:213–230. doi: 10.1002/cne.902800205. [DOI] [PubMed] [Google Scholar]
- Constant D, Ruther H. Sexual dimorphism in the human corpus callosum? A comparison of methodologies. Brain Res. 1996;727:99–106. doi: 10.1016/0006-8993(96)00358-7. [DOI] [PubMed] [Google Scholar]
- De Lacoste-Utamsing C, Holloway RL. Sexual dimorphism in the human corpus callosum. Science. 1982;216:1431–1432. doi: 10.1126/science.7089533. doi:10.1182/blood-2009-06-229658. [DOI] [PubMed] [Google Scholar]
- Di Paola M, Luders E, Di Iulio F, Cherubini A, Passafiume D, Thompson PM, Caltagirone C, Toga AW, Spalletta G. Callosal atrophy in mild cognitive impairment and Alzheimer's disease: different effects in different stages. Neuroimage. 2010;49:141–149. doi: 10.1016/j.neuroimage.2009.07.050. [DOI] [PMC free article] [PubMed] [Google Scholar]
- Elster AD, DiPersio DA, Moody DM. Sexual dimorphism of the human corpus callosum studied by magnetic resonance imaging: fact, fallacy and statistical confidence. Brain Dev. 1990;12:321–325. doi: 10.1016/s0387-7604(12)80314-7. doi:10.1200/JCO.2009.23.7172. [DOI] [PubMed] [Google Scholar]
- Frederiksen KS, Garde E, Skimminge A, Ryberg C, Rostrup E, Baaré WF, Siebner HR, Hejl AM, Leffers AM, Waldemar G. Corpus callosum atrophy in patients with mild Alzheimer's disease. Neurodegener Dis. 2011;8:476–482. doi: 10.1159/000327753. [DOI] [PubMed] [Google Scholar]
- Geary DC. Male, female: the evolution of human sex differences. Washington (DC): American Psychological Association; 1998. doi:10.1182/blood-2006-05-022962. [Google Scholar]
- Going JJ, Dixson A. Morphometry of the adult human corpus callosum: lack of sexual dimorphism. J Anat. 1990;171:163–167. doi:10.1056/NEJMoa053583. [PMC free article] [PubMed] [Google Scholar]
- Hampel H, Teipel SJ, Alexander GE, Horwitz B, Teichberg D, Schapiro MB, Rapoport SI. Corpus callosum atrophy is a possible indicator of region- and cell type-specific neuronal degeneration in Alzheimer disease: a magnetic resonance imaging analysis. Arch Neurol. 1998;55:193–198. doi: 10.1001/archneur.55.2.193. doi:10.1200/JCO.2008.18.8573. [DOI] [PubMed] [Google Scholar]
- Highley JR, Esiri MM, McDonald B, Cortina-Borja M, Herron BM, Crow TJ. The size and fibre composition of the corpus callosum with respect to gender and schizophrenia: a post-mortem study. Brain. 1999;122:99–110. doi: 10.1093/brain/122.1.99. [DOI] [PubMed] [Google Scholar]
- Hirnstein M, Hausmann M, Güntürkün O. The evolutionary origins of functional cerebral asymmetries in humans: does lateralization enhance parallel processing? Behav Brain Res. 2008;187:297–303. doi: 10.1016/j.bbr.2007.09.023. doi:10.1182/blood-2011-06-357038. [DOI] [PubMed] [Google Scholar]
- Hofer S, Frahm J. Topography of the human corpus callosum revisited-comprehensive fiber tractography using diffusion tensor magnetic resonance imaging. Neuroimage. 2006;32:989–994. doi: 10.1016/j.neuroimage.2006.05.044. doi:10.1182/blood-2008-06-160531. [DOI] [PubMed] [Google Scholar]
- Holloway RL. Sexual dimorphism in the human corpus callosum: its evolutionary and clinical implications. In: Sperber GH, editor. From apes to angels: essays in anthropology in honor of Phillip V. Tobias. New York (NY): Wiley-Liss; 1990. pp. 221–228. [Google Scholar]
- Holloway RL, Anderson PJ, Defendini R, Harper C. Sexual dimorphism of the human corpus callosum from three independent samples: relative size of the corpus callosum. Am J Phys Anthropol. 1993;92:481–498. doi: 10.1002/ajpa.1330920407. doi:10.1200/JCO.2009.22.7561. [DOI] [PubMed] [Google Scholar]
- Holloway RL, de Lacoste MC. Sexual dimorphism in the human corpus callosum: an extension and replication study. Hum Neurobiol. 1986;5:87–91. [PubMed] [Google Scholar]
- Huang H, Zhang J, Jiang H, Wakana S, Poetscher L, Miller MI, van Zijl PC, Hillis AE, Wytik R, Mori S. DTI tractography based parcellation of white matter: application to the mid-sagittal morphology of corpus callosum. Neuroimage. 2005;26:195–205. doi: 10.1016/j.neuroimage.2005.01.019. doi:10.1111/j.1365-2141.2007.06921.x. [DOI] [PubMed] [Google Scholar]
- Jäncke L, Staiger JF, Schlaug G, Huang Y, Steinmetz H. The relationship between corpus callosum size and forebrain volume. Cereb Cortex. 1997;7:48–56. doi: 10.1093/cercor/7.1.48. doi:10.1111/j.1365-2141.2009.07864.x. [DOI] [PubMed] [Google Scholar]
- Johnson SC, Farnworth T, Pinkston JB, Bigler ED, Blatter DD. Corpus callosum surface area across the human adult life span: effect of age and gender. Brain Res Bull. 1994;35:373–377. doi: 10.1016/0361-9230(94)90116-3. doi:10.1182/blood-2011-09-379164. [DOI] [PubMed] [Google Scholar]
- Klein A, Andersson J, Ardekani BA, Ashburner J, Avants B, Chiang MC, Christensen GE, Collins DL, Gee J, Hellier P, et al. Evaluation of 14 nonlinear deformation algorithms applied to human brain MRI registration. Neuroimage. 2009;46:786–802. doi: 10.1016/j.neuroimage.2008.12.037. doi:10.1016/S1470-2045(09)70284-0. [DOI] [PMC free article] [PubMed] [Google Scholar]
- Leonard CM, Towler S, Welcome S, Halderman LK, Otto R, Eckert MA, Chiarello C. Size matters: cerebral volume influences sex differences in neuroanatomy. Cereb Cortex. 2008;18:2920–2931. doi: 10.1093/cercor/bhn052. doi:10.1182/blood-2007-05-090258. [DOI] [PMC free article] [PubMed] [Google Scholar]
- Marcus DS, Wang TH, Parker J, Csernansky JG, Morris JC, Buckner RL. Open Access Series of Imaging Studies (OASIS): cross-sectional MRI data in young, middle aged, nondemented, and demented older adults. J Cogn Neurosci. 2007;19:1498–1507. doi: 10.1162/jocn.2007.19.9.1498. doi:10.1182/blood-2010-02-268862. [DOI] [PubMed] [Google Scholar]
- McGee MG. Human spatial abilities: psychometric studies and environmental, genetic, hormonal, and neurological influences. Psych Bull. 1979;86:889–918. doi:10.1182/blood-2008-04-149427. [PubMed] [Google Scholar]
- McGlone J. Sex differences in human cerebral asymmetry: a critical survey. Behav Brain Sci. 1980;3:215–263. doi:10.1016/S0140-6736(07)61537-2. [Google Scholar]
- Mitchell TN, Free SL, Merschhemke M, Lemieux L, Sisodiya SM, Shorvon SD. Reliable callosal measurement: population normative data confirm sex-related differences. AJNR Am J Neuroradiol. 2003;24:410–418. doi:10.1200/JCO.2008.21.0948. [PMC free article] [PubMed] [Google Scholar]
- Oka S, Miyamoto O, Janjua NA, Honjo-Fujiwara N, Ohkawa M, Nagao S, Kondo H, Minami T, Toyoshima T, Itano T. Re-evaluation of sexual dimorphism in human corpus callosum. Neuroreport. 1999;10:937–940. doi: 10.1097/00001756-199904060-00008. : [DOI] [PubMed] [Google Scholar]
- Oppenheim JS, Lee BC, Nass R, Gazzaniga MS. No sex-related differences in human corpus callosum based on magnetic resonance imagery. Ann Neurol. 1987;21:604–606. doi: 10.1002/ana.410210615. doi:10.1200/JCO.2009.26.1610. [DOI] [PubMed] [Google Scholar]
- Peters M. The size of the corpus callosum in males and females: implications of a lack of allometry. Can J Psychol. 1988;42:313–324. doi: 10.1037/h0084195. doi:10.1182/blood-2009-08-237974. [DOI] [PubMed] [Google Scholar]
- Rauch RA, Jinkins JR. Analysis of cross-sectional area measurements of the corpus callosum adjusted for brain size in male and female subjects from childhood to adulthood. Behav Brain Res. 1994;64:65–78. doi: 10.1016/0166-4328(94)90119-8. doi:10.1182/blood-2011-03-341669. [DOI] [PubMed] [Google Scholar]
- Rauch RA, Jinkins JR. Variability of corpus callosal area measurements from midsagittal MR images: effect of subject placement within the scanner. Am J Neuroradial. 1996;17:27–28. doi:10.1056/NEJMoa0801479. [PMC free article] [PubMed] [Google Scholar]
- Rohlfing T, Brandt R, Menzel R, Maurer CR., Jr Evaluation of atlas selection strategies for atlas-based image segmentation with application to confocal microscopy images of bee brains. Neuroimage. 2004;21:1428–1442. doi: 10.1016/j.neuroimage.2003.11.010. [DOI] [PubMed] [Google Scholar]
- Smith RJ. Relative size versus controlling for size: interpretation of ratios in research on sexual dimorphism in the human corpus callosum. Curr Anthropol. 2005;46:249–273. doi:10.1182/blood-2008-07-169565. [Google Scholar]
- Sommer IE, Aleman A, Bouma A, Kahn RS. Do women really have more bilateral language representation than men? A meta-analysis of functional imaging studies. Brain. 2004;127:1845–1852. doi: 10.1093/brain/awh207. [DOI] [PubMed] [Google Scholar]
- Styner MA, Oguz I, Smith RG, Cascio C, Jomier M. Corpus callosum subdivision based on a probabilistic model of inter-hemispheric connectivity. Med Image Comput Comput Assist Interv. 2005;8:765–772. doi: 10.1007/11566489_94. doi:10.1200/JCO.2010.29.8216. [DOI] [PubMed] [Google Scholar]
- Sullivan EV, Rosenbloom MJ, Desmond JE, Pfefferbaum A. Sex differences in corpus callosum size: relationship to age and intracranial size. Neurobiol Aging. 2001;22:603–611. doi: 10.1016/s0197-4580(01)00232-9. doi:10.1016/S1470-2045(10)70187-X. [DOI] [PubMed] [Google Scholar]
- Teipel SJ, Bayer W, Alexander GE, Zebuhr Y, Teichberg D, Kulic L, Schapiro MB, Möller HJ, Rapoport SI, Hampel H. Progression of corpus callosum atrophy in Alzheimer disease. Arch Neurol. 2002;59:243–248. doi: 10.1001/archneur.59.2.243. doi:10.1182/blood-2010-07-294983. [DOI] [PubMed] [Google Scholar]
- Tepest R, Jacobi E, Gawronski A, Krug B, Möller-Hartmann W, Lehnhardt FG, Vogeley K. Corpus callosum size in adults with high-functioning autism and the relevance of gender. Psychiatry Res: Neuroimag. 2010;183:38–43. doi: 10.1016/j.pscychresns.2010.04.007. doi:10.1182/blood-2011-06-358812. [DOI] [PubMed] [Google Scholar]
- Voyer D. On the magnitude of laterality effects and sex differences in functional lateralities. Laterality. 1996;1:51–83. doi: 10.1080/713754209. doi:10.1200/JCO.2010.30.8791. [DOI] [PubMed] [Google Scholar]
- Wallentin M. Putative sex differences in verbal abilities and language cortex: a critical review. Brain Lang. 2009;108:175–183. doi: 10.1016/j.bandl.2008.07.001. doi:10.1200/JCO.2010.28.1238. [DOI] [PubMed] [Google Scholar]
- Wang PJ, Saykin AJ, Flashman LA, Wishart HA, Rabin LA, Santulli RB, McHugh TL, MacDonald JW, Mamourian AC. Regionally specific atrophy of the corpus callosum in AD, MCI and cognitive complaints. Neurobiol Aging. 2006;27:1613–1617. doi: 10.1016/j.neurobiolaging.2005.09.035. [DOI] [PMC free article] [PubMed] [Google Scholar]
- Weis S, Jellinger K, Wenger E. Morphology of the corpus callosum in normal aging and Alzheimer's disease. J Neural Transm Suppl. 1991;33:35–38. doi: 10.1007/978-3-7091-9135-4_6. [DOI] [PubMed] [Google Scholar]
- Weis S, Weber G, Wenger E, Kimbacher M. The controversy about a sexual dimorphism of the human corpus callosum. Intern J Neurosci. 1989;47:169–173. doi: 10.3109/00207458908987430. [DOI] [PubMed] [Google Scholar]
- Witelson SF. The brain connection: the callosum is larger in left-handers. Science. 1985;229:665–668. doi: 10.1126/science.4023705. [DOI] [PubMed] [Google Scholar]
- Yushkevich PA, Piven J, Hazlett HC, Smith RG, Ho S, Gee JC, Gerig G. User-guided 3D active contour segmentation of anatomical structures: significantly improved efficiency and reliability. Neuroimage. 2006;31:1116–1128. doi: 10.1016/j.neuroimage.2006.01.015. [DOI] [PubMed] [Google Scholar]