Abstract
Natural killer (NK) cells are abundant in the liver and serve as a major innate immune component against microbial infection. Although NK cells have been implicated in inducing hepatocellular damage in patients with chronic hepatitis virus infections, the roles that hepatic NK cells play in chronic hepatitis B virus (HBV) infections remain obscure. In this study, we comprehensively characterized intrahepatic and peripheral NK cells and investigated their impact on liver pathology in a cohort of HBV-infected individuals; this cohort included 51 immune-activated (IA) patients, 27 immune-tolerant (IT) carriers, and 26 healthy subjects. We found that NK cells expressing NK receptors (activation receptors) preferentially accumulated in the livers of IA patients, in which they were activated and skewed toward cytolytic activity but without a concomitant increase in interferon-γ production, in comparison with those of IT carriers and healthy subjects. Further analysis showed that the livers of IA patients, in comparison with those of IT and healthy subjects, expressed higher levels of interleukin-12 (IL-12), IL-15, and IL-18 in situ and lower levels of IL-10, which in vitro can induce the activation and degranulation of NK cells from healthy individuals. Finally, hepatic NK cells displayed more cytolytic activity than peripheral NK cells, and this was found to be positively correlated with the liver histological activity index and serum alanine aminotransferase levels in these IA patients.
Conclusion
In IA patients, hepatic NK cells are activated and preferentially skew toward cytolytic activity, which depends on an imbalanced cytokine milieu and correlates with liver injury during chronic HBV infection.
Worldwide, hepatitis B virus (HBV) infection is one of the leading causes of chronic liver disease. Because HBV is not a cytopathogenic virus, host immune responses induced by viral persistence are generally thought to be responsible for the disease progression of chronic HBV infection.1 Generally, HBV-specific T cells were believed to play important roles in inducing hepatocellular damage during chronic HBV infection2,3; however, recent studies have shown that these cells often display functional impairment, such as T cell exhaustion by up-regulation of programmed death 1,4,5 T cell attrition through the B cell lymphoma 2 interacting mediator,6 and impaired T cell receptor signaling through the ζ-chain.7 T cell impairment is even more pronounced in the livers of patients with chronic hepatitis B (CHB) versus their blood.5 Furthermore, activated HBV-specific CD8 T cells are often found to be present in the livers of patients without evident liver immunopathology, whereas non–virus-specific lymphocytes have usually massively infiltrated the livers of patients with hepatocellular damage.8 A model of HBV-transgenic mice has further confirmed that non–virus-specific lymphocytes can exacerbate the liver inflammation initiated by virus-specific CD8 T cells.9,10 These findings suggest that non–virus-specific inflammatory cells infiltrating the liver may actively participate in HBV-associated liver pathogenesis.
Natural killer (NK) cells are abundant in the liver and serve as a major innate immune component against microbial infection.11 Recent studies have clearly suggested that NK cells may contribute to liver pathogenesis in rodent models12 and in patients with chronic hepatitis C virus (HCV) or HBV infection.13–16 Particularly during HCV infection, the viral infection results in an elevation of interferon-α (IFN-α) that subsequently polarizes NK cells toward cytolytic activity to induce liver injury.15 Emerging evidence indicates that during HBV infection, the early NK cell responses may lead to the initial control of the acute infection and allow the timely and efficient development of an adaptive immune response.17,18 However, if the virus persists, activated NK cells can mediate hepatocyte apoptosis by up-regulating tumor necrosis factor–related apoptosis-inducing ligand (TRAIL) in hepatitis B e antigen (HBeAg)–negative patients with hepatic flares14 and Fas ligand (FasL) in patients with HBV-associated acute-on-chronic liver failure.16 Although these studies have partially defined the role of NK cells in liver injury, NK cells may also use some other ligands to mediate liver injury in various disease progression phases of chronic HBV infection. In addition, recently available data about NK cells in CHB patients were primarily obtained from the peripheral compartments18,19; detailed information about the roles of NK cells in the liver pathogenesis of chronic HBV infection is scarce, especially for HBeAg-positive subjects.
HBeAg-positive individuals with chronic HBV infection are generally divided into two groups: immune-tolerant (IT) carriers and immune-activated (IA) patients. The former group is characterized by minimal liver damage, normal alanine aminotransferase (ALT) levels, and active viral replication; the latter, generally after the IT phase, have increased liver injury and decreased viral replication.1,20 In this study, we comprehensively characterized the hepatic NK cells in these HBV-infected individuals and demonstrated that NK cell–mediated liver pathogenesis depended on an imbalanced cytokine milieu in the livers of these IA patients. Our findings may facilitate the rational development of immunotherapeutic strategies for enhancing viral control while limiting or blocking liver injury and inflammation.
Patients and Methods
Study Subjects
Fifty-one IA patients and 27 IT carriers were recruited for this study. All patients were diagnosed according to our previously described criteria21 and were not taking antiviral therapy or immunosuppressive drugs within 6 months before the sampling. Twenty-six age-matched and sex-matched healthy individuals were enrolled as healthy controls (HCs). Individuals with a concurrent HCV, hepatitis D virus, or human immunodeficiency virus infection, an autoimmune liver disease, or alcoholic liver disease were excluded. The study protocol was approved by the ethics committee of our unit, and written informed consent was obtained from each subject. The basic characteristics of these enrolled subjects are listed in Supporting Information Table 1.
Peripheral blood mononuclear cells (PBMCs) were isolated from all enrolled subjects. Liver biopsy samples were collected from 29 IA patients and 15 IT carriers, and 12 healthy liver tissue samples were obtained from healthy donors whose livers were used for transplantation. The degree of hepatic inflammation was graded with the modified histological activity index (HAI) described by Scheuer.22 The basic clinical data for the HBV-infected subjects with available liver biopsy samples are presented in Table 1. Except for the pathological evaluation, liver biopsy specimens were homogenized for the isolation of liver-infiltrating lymphocytes (LILs), embedded in Tissue-Tek for in situ immunohistochemical staining, or frozen for total RNA extraction.
Table 1.
Basic Clinical Data for HBV-Infected Subjects With Available Liver Biopsy Samples
| Case | Group | Age (Years) | Sex | ALT (U/L) | DNA (IU/mL) | G Score |
|---|---|---|---|---|---|---|
| 1 | IT | 20 | Male | 23 | 652,000,000 | G1 |
| 2 | IT | 17 | Male | 26 | 87,600,000 | G1 |
| 3 | IT | 29 | Female | 23 | 177,000,000 | G1 |
| 4 | IT | 18 | Male | 22 | 101,100,000 | G1 |
| 5 | IT | 28 | Female | 20 | 335,000,000 | G1 |
| 6 | IT | 21 | Male | 23 | 336,000,000 | G1 |
| 7 | IT | 44 | Male | 20 | 379,000,000 | G1 |
| 8 | IT | 35 | Female | 12 | 114,000,000 | G1 |
| 9 | IT | 29 | Female | 20 | 303,000,000 | G1 |
| 10 | IT | 17 | Male | 18 | 547,000,000 | G1 |
| 11 | IT | 16 | Male | 35 | 245,000,000 | G1 |
| 12 | IT | 17 | Male | 17 | 96,900,000 | G1 |
| 13 | IT | 35 | Male | 18 | 80,800,000 | G1 |
| 14 | IT | 31 | Male | 10 | 87,040,000 | G1 |
| 15 | IT | 22 | Male | 36 | 11,000,0000 | G1 |
| 16 | IA | 39 | Male | 48 | 100,000 | G1 |
| 17 | IA | 36 | Male | 43 | 592,000,000 | G1 |
| 18 | IA | 16 | Male | 52 | 65,200 | G1 |
| 19 | IA | 20 | Male | 61 | 156,000,000 | G1 |
| 20 | IA | 24 | Male | 51 | 700,000,000 | G1 |
| 21 | IA | 26 | Male | 124 | 3,760,000 | G1 |
| 22 | IA | 22 | Male | 44 | 68,000 | G1 |
| 23 | IA | 23 | Female | 51 | 1,970,000,000 | G2 |
| 24 | IA | 17 | Male | 144 | 108,000,000 | G2 |
| 25 | IA | 32 | Male | 44 | 3,480,000 | G2 |
| 26 | IA | 19 | Female | 94 | 65,900,000 | G2 |
| 27 | IA | 22 | Male | 65 | 38,400,000 | G2 |
| 28 | IA | 23 | Female | 66 | 566,000,000 | G2 |
| 29 | IA | 32 | Female | 61 | 199,000 | G2 |
| 30 | IA | 25 | Female | 62 | 59,600,000 | G2 |
| 31 | IA | 19 | Male | 184 | 5,990,000 | G2 |
| 32 | IA | 30 | Male | 512 | 998,000 | G2 |
| 33 | IA | 35 | Male | 207 | 303,000 | G2 |
| 34 | IA | 42 | Male | 57 | 1,100,000 | G2 |
| 35 | IA | 36 | Male | 43 | 20,000 | G2 |
| 36 | IA | 52 | Female | 99 | 338,000,000 | G3 |
| 37 | IA | 22 | Female | 231 | 82,600,000 | G3 |
| 38 | IA | 21 | Male | 103 | 26,900 | G3 |
| 39 | IA | 19 | Male | 179 | 33,400,000 | G3 |
| 40 | IA | 25 | Male | 128 | 760,000,000 | G3 |
| 41 | IA | 30 | Male | 256 | 25,000 | G3 |
| 42 | IA | 42 | Male | 69 | 664,000 | G3 |
| 43 | IA | 21 | Female | 81 | 1,660,000 | G3 |
| 44 | IA | 32 | Male | 70 | 4,460,000 | G4 |
Fluorescence-Activated Cell Sorting Analysis
All antibodies were purchased from BD Biosciences (San Jose, CA), except for phycoerythrin-conjugated anti–natural killer group 2 member A (anti-NKG2A) and anti–natural killer group 2 member D (anti-NKG2D) antibodies (R&D Systems, Minneapolis, MN) and anti-NKp30, anti-NKp44, and anti-NKp46 antibodies (Biolegend, San Diego, CA). The NK cell frequency and phenotypic analysis are shown in the supporting information.
Degranulation of NK Cells and IFN-γ Detection
CD107a degranulation is now widely used to assess NK cell cytotoxic potentials.23 Briefly, the freshly isolated PBMCs (5 × 10⁵) and LILs (1 × 10⁵) were directly stimulated with phorbol myristate acetate (PMA; 100 ng/mL) and ionomycin (1 μg/mL) or K562 cells at the effector to target (E:T) ratio of 10:1. Alternatively, PBMCs and LILs were cultured with P815 target cells (at the ratio of 1:1) in the presence of an antilymphocyte serum (ALS) antibody (0.5 μg/mL; anti-CD16 Fcγ receptor III immunoglobulin M antibody, Immunological Sciences) or monoclonal antibodies specific for NKp30, NKp44, and NKp46 in combination (1 μg/mL; Biolegend). Unstimulated PBMCs served as negative controls. Anti-CD107a was first directly added to the medium, and after 1 hour of stimulation, GolgiStop was added. After 5 hours of incubation, the cells were collected and stained with surface antibodies and intracellularly with anti–IFN-γ.
Cytolytic Killing Assay
K562 and hepatocellular carcinoma cell lines (HepG2, HepG2.2.15, and Huh7.5) were labeled with carboxyfluorescein diacetate succinimidyl ester (CFSE; Molecular Probes, Eugene, OR).24 PBMCs were subsequently incubated with the CFSE-labeled K562 cells at the ratios of 3:1, 10:1, and 30:1 or with HepG2, HepG2.2.15, and Huh7.5 at the ratio of 10:1 for 6 hours. The target cells alone were used as controls. The cells were then stained with 7-aminoactinomycin D (7-AAD; 1 μg/mL) for the identification of dead cells.
Cytokine Stimulation
The freshly isolated PBMCs (2 × 10⁶ cells/mL) were cultured in a medium alone or with interleukin-12 (IL-12; 5 ng/mL) in combination with IL-15 (10 ng/mL; Peprotech, Rocky Hill, NJ) or IL-18 (10 ng/mL; Biovision, Mountain View, CA) for 48 hours. The cells were then either directly stained with antibodies against activation markers or further subjected to 6 hours of degranulation and IFN-γ release assays in the presence of IL-12 and IL-15, which were followed by the assays described previously.
Immunohistochemical Staining
Acetone-fixed liver biopsy cryosections and paraffin-embedded sections (both 5 μm) were incubated with anti-CD56 (clone 301021, R&D Systems) and with anti-IL–12p70 (clone 24945, R&D Systems), anti–IL-15 (clone ab55276, Abcam, San Francisco, CA), and anti-IL–18 (clone N19, Santa Cruz Biotechnology, Santa Cruz, CA), respectively, according to our previously described protocols.25,26 High-power fields (400×) were used for counting positive cells. Positive cells were counted in three different fields by two independent observers.
Semiquantitative Real-Time Polymerase Chain Reaction and Virological Assessment
Semiquantitative analyses of NK cell receptor ligands and cytokine transcripts and serum HBV loads are shown in the supporting information.
Statistical Analysis
All data were analyzed with SPSS 13.0 for Windows (SPSS, Inc., Chicago, IL). Multiple comparisons were made between the different groups with the Kruskal-Wallis H nonparametric test. Comparisons between various individuals were performed with the Mann-Whitney U test, whereas comparisons between the same individual were performed with the Wilcoxon matched-pair t test. Correlations between variables were evaluated with the Spearman rank correlation test. For all tests, a two-sided P value < 0.05 was considered to be significant.
Results
Accumulation of NK Cells in the Livers of IA Patients
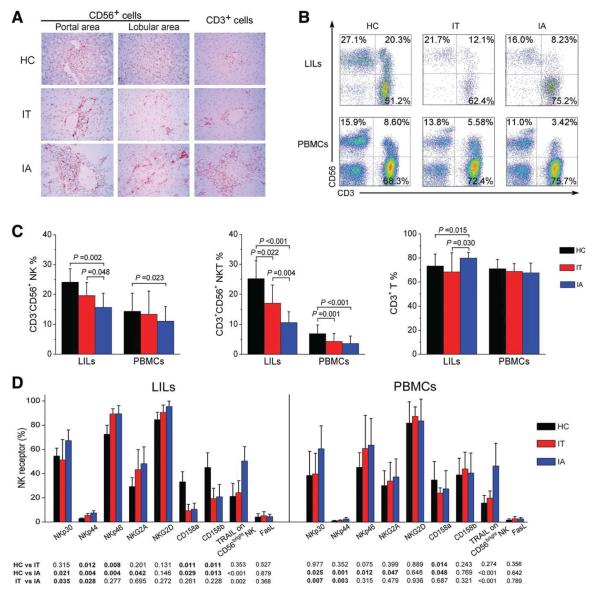
We first detected the distribution of hepatic CD56+ and CD3+ cells in the individuals with immunohistochemical staining (Fig. 1A). A few CD56+ and CD3+ cells were present in the livers of healthy donors; in contrast, more CD56+ cells were frequently seen in the livers of HBV-infected subjects (particularly IA patients). The quantitative analysis of hepatic CD56+ and CD3+ cell counts further confirmed this observation (Supporting Information Fig. 1). These results indicated that more CD3+ T cells and CD56+ cells infiltrated the livers of IA patients versus the livers of IT and HC subjects.
Fig. 1.
Activation receptor–expressing NK cells selectively accumulate in the livers of IA patients with chronic HBV infection. (A) Immunohistochemical detection of CD56+ and CD3+ cells in the liver tissues of HBV-infected IA patients, IT subjects, and HC donors (magnification, 400 ×). Positively stained cells appear red and were present in both portal and lobular areas in the livers. (B) Representative dot plots of CD3+ and CD56+ staining in LILs and PBMCs isolated from HC subjects and HBV-infected individuals are shown. Values in the quadrants represent the percentages of CD3−CD56+ NK cells, CD3+CD56+ NKT cells, and CD3+ T cells. (C) Summarized data show the percentages of NK cells, NKT cells, and T cells in the IA (n = 51), IT (n = 27), and HC groups (n = 26). (D) Pooled data show the percentages of hepatic and peripheral NK cells expressing NK receptors, TRAIL, and FasL from the three indicated groups. The data are shown as means and standard deviations. P values are shown.
Subsequently, we dissected the subtypes of the liver-infiltrating cells in these samples with flow cytometry analysis for the following cell types: CD3−CD56+ NK cells, CD3+CD56+ natural killer T (NKT) cells, and CD3+ T cells (Fig. 1B). The gate strategy of hepatic lymphocytes is described in Supporting Information Fig. 2. In comparison with IT and HC subjects, the percentages of hepatic NK and NKT cells were both significantly reduced in IA patients, whereas the percentage of hepatic T cells was markedly increased (Fig. 1C). The ratio of CD3−CD56+ NK cells to CD3+CD56+ NKT cells in the livers of IA patients was also significantly increased in comparison with the ratios in the livers of IT and HC individuals (data not shown). A similar alteration of NK and NKT cells but not T cells was also observed in the peripheral blood of these subjects (Fig. 1C). Collectively, these findings clearly indicated that the number of CD3+ T, NK, and NKT cells was enriched in the livers of IA patients in comparison with those of HC and IT subjects.
Activation Receptor–Expressing NK Cells Are Enriched in the Livers of IA Patients
We further analyzed NK cell receptor expression in the three groups of individuals and included natural cytotoxicity receptors (NCRs) NKp30, NKp44, NKp46, and NKG2D and inhibitory receptors NKG2A, CD158a, and CD158b (Supporting Information Fig. 3) as well as TRAIL and FasL. As illustrated in Fig. 1D, activation receptors NKp30, NKp44, and NKp46 were up-regulated, whereas inhibitory receptors CD158a and CD158b were down-regulated in the livers of HBV-infected individuals versus those of HC subjects. In addition, NKp30 and NKp44 expression levels were also up-regulated on peripheral NK cells in IA patients versus IT subjects. TRAIL was preferentially expressed on CD56bright NK subsets with respect to CD56dim NK subsets (data not shown), and TRAIL expression levels on both hepatic and peripheral CD56bright NK subsets was up-regulated in IA patients versus IT and HC subjects. FasL expression on total NK cells was similar among the three cohorts. Thus, activation receptor–expressing NK cells were preferentially enriched in the livers of IA patients.
NK Cells Are Activated in IA Patients
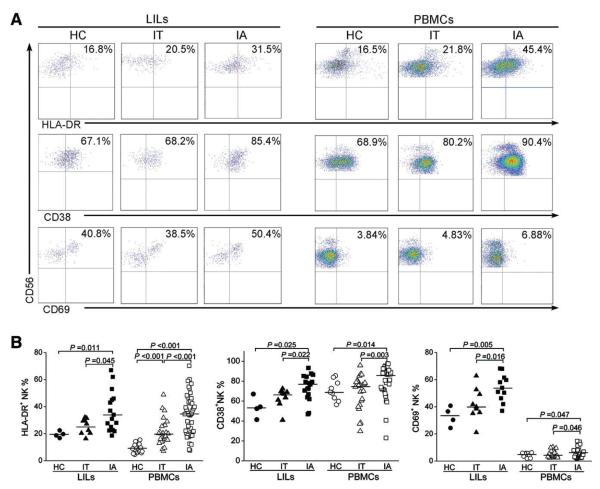
We then analyzed the expression levels of the human leukocyte antigen DR (HLA-DR), CD38, and CD69 activation markers on NK cells in these subjects. As shown in Fig. 2A,B, both hepatic and peripheral NK cells from IA patients expressed significantly higher levels of HLA-DR, CD38, and CD69 than those observed in IT and HC subjects. The mean fluorescence intensities (MFIs) of HLA-DR, CD38, and CD69 expression on hepatic and peripheral NK cells from IA patients were also increased in comparison with those from IT and HC subjects (data not shown). These data suggest that NK cells are activated in vivo in IA patients.
Fig. 2.
NK cells express high levels of activation markers in IA patients. (A) Representative dot plots depict the expression of the activation markers HLA-DR, CD38, and CD69 on both hepatic and peripheral NK cells from IA patients and IT and HC subjects. CD3−CD56+ NK cells were gated. Values in the upper right quadrants represent the percentages of CD3−CD56+ NK cells expressing activation markers. (B) Pooled data show the percentages of hepatic and peripheral CD3−CD56+ NK cells expressing HLA-DR (left), CD38 (middle), and CD69 (right) among the three groups of subjects.
NK Cells From IA Patients Are Skewed Toward Degranulation
We then evaluated the ability of NK cells to produce IFN-γ and CD107a in response to K562 cells and PMA in combination with ionomycin. As shown in Fig. 3A,B, PMA/ionomycin stimulation induced higher levels of hepatic NK cell degranulation (CD107a expression) and IFN-γ production in IA patients and IT carriers versus HCs. Upon K562 stimulation, the expression of CD107a (but not the expression of IFN-γ) was increased in both hepatic and peripheral NK cells in IA patients in comparison with IT subjects. In addition, basal levels of CD107a were detected on hepatic NK cells from IA patients but not on those from IT and HC subjects (Supporting Information Fig. 4A,B).
Fig. 3.
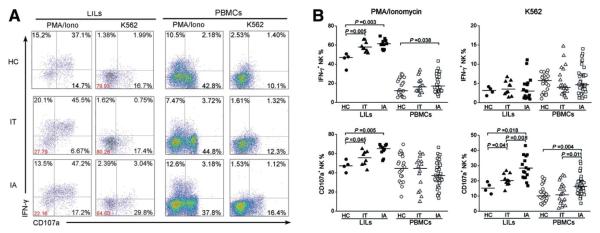
NK cells from IA patients are prone to degranulation. (A) Representative dot plots depict IFN-γ and CD107a expression on both hepatic and peripheral NK cells among the three groups in response to various stimuli. CD3−CD56+ NK cells were gated. Values in the quadrants represent the percentages of CD3−CD56+ NK cells expressing IFN-γ and CD107a. (B) Pooled data show the percentages of hepatic and peripheral CD3−CD56+ NK cells expressing IFN-γ and CD107a among the three groups upon stimulation with PMA/ionomycin and K562 cells. Each dot represents one individual.
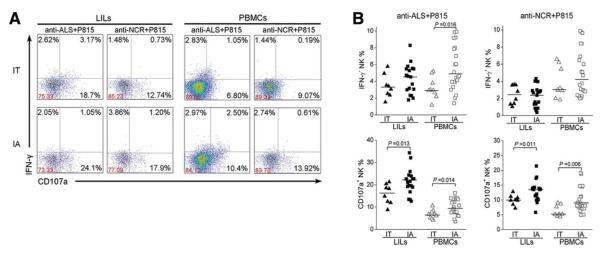
Next, we performed the redirected cytotoxicity assay through NK activation receptor binding to P815 target cells via the immunoglobulin Fcγ receptor (Fig. 4A) and found that anti-ALS (anti-CD16) and mixed anti-NCR antibodies (anti-NKp30, anti-NKp44, and anti-NKp46) induced more CD107a degranulation in both LILs and PBMCs from IA patients in comparison with HC subjects; meanwhile, IFN-γ production was increased only in response to anti-ALS antibodies and not in response to anti-NCR monoclonal antibodies in IA patients (Fig. 4A,B). Further analysis revealed that the anti-NKp30 antibody treatment induced NK cells to produce more CD107a and IFN-γ than the treatment with the anti-NKp44 and NKp46 antibodies; this suggests that NKp30 is primarily responsible for the NCR-associated cytolytic activity in IA patients (Supporting Information Fig. 5).
Fig. 4.
Redirected cytotoxicity of NK cells is increased in IA patients. (A) Representative dot plots depict the redirected NK degranulation assay using P815 target cells and anti-ALS (anti-CD16) and anti-NCR antibodies in LILs and PBMCs from IA patients and IT subjects. CD3−CD56+ NK cells were gated. Values in the quadrants represent the percentages of CD3−CD56+ NK cells expressing IFN-γ and CD107a. (B) Pooled data show the percentages of hepatic and peripheral CD3−CD56+ NK cells expressing IFN-γ and CD107a from IA patients and IT subjects in response to anti-ALS and anti-NCR antibodies. Each dot represents one individual.
NK Cells in IA Patients Display Increased Cytolytic Activity
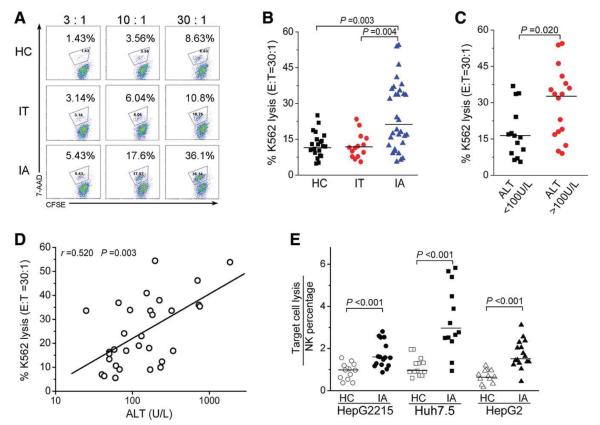
We further found that NK cells from IA patients induced higher levels of K562 lysis than those from IT and HC subjects at the 30:1 E:T ratio (Fig. 5A,B). Interestingly, the capacity of NK cells to lyse K562 targets was higher in IA patients with high ALT levels (ALT > 100U/L) versus those with low ALT levels (ALT <100 U/L; Fig. 5C), and this was positively correlated with serum ALT levels (Fig. 5D). Moreover, PBMCs from IA patients induced a greater magnitude of HepG2, HepG2.2.15, and Huh7.5 cell death than those from HC subjects (Fig. 5E). Further analysis revealed that the depletion of NK cells from PBMCs largely reduced their cytotoxicity (data not shown), and this suggested that CD3−CD56+ NK cells were the major effectors responsible for the killing of these hepatocellular carcinoma cell lines. Thus, the IA patients displayed stronger cytolytic activity in NK cells than IT and HC subjects, and this correlated positively with the severity of liver damage in the IA patients.
Fig. 5.
NK cells from IA patients exhibit increased cytolytic activity. (A) Representative dot plots show K562 lysis by PBMCs from the three groups at different E:T ratios (3:1, 10:1, and 30:1). Values in the quadrant represent the percentages of K562 lysis. (B) Pooled data show the percentages of K562 lysis by PBMCs from the three groups at the E:T ratio of 30:1. (C) Pooled data show the percentages of K562 lysis by PBMCs from IA patients with high levels (>100 U/L) or low levels (<100 U/L) of serum ALT. (D) Correlation analysis of the percentages of K562 lysis by PBMCs at the E:T ratio of 30:1 and the serum ALT levels in IA patients (n = 31). (E) Pooled data show the lysis efficiency of hepatocellular carcinoma cell lines (including Huh7.5, HepG2, and HepG2215 cells) by PBMCs from IA patients at the E:T ratio of 30:1. The y axis indicates the ratio of target lysis by NK percentages.
Cytokines That Can Enhance NK Activation and Polarization to Cytolytic Activity In Vitro Are Elevated in the Livers of IA Patients
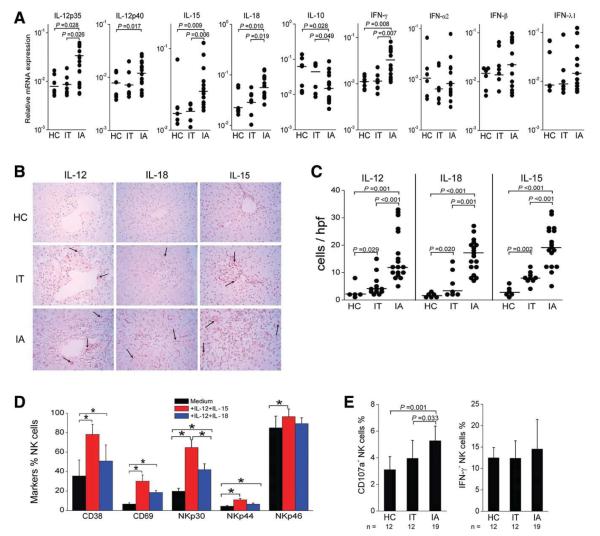
To investigate the driving force underlying the polarized NK cell cytolytic activity, we analyzed the messenger RNA (mRNA) expression of NK receptor ligands (including NKG2D ligands MICa/b [major histocompatibility complex class 1 chain-related molecule] and ULBP1-4 [UL-16–binding protein], NKG2A ligand HLA-E, and NKp30 ligands BAT3 [HLA-B–Associated Transcript-3] and B7H6) and cytokines (IL-12p35, IL-12p40, IL-15, IL-18, IFN-γ, IL-10, IFN-α2, IFN-β, and IFN-λ1) in the liver tissues. Hepatic mRNA expression levels of IL-12p35, IL-12p40, IL-15, IL-18, and IFN-γ in IA patients were significantly higher than those in IT and HC subjects. Interestingly, hepatic IL-10 mRNA expression was lower in IA patients in comparison with IT and HC subjects (Fig. 6A). No significant differences in the cytokine IFN-α2, IFN-β, and IFN-λ1 expression levels (Fig. 6A) or NK receptor ligand expression levels (Supporting Information Fig. 6) were found between IA and IT/HC subjects.
Fig. 6.
Evidence for the contribution of IL-12, IL-15, and IL-18 to increased NK cytolytic activity in IA patients. (A) Statistical analysis of the mRNA expression of hepatic cytokines in IA patients (n = 15) and in IT (n = 6) and HC subjects (n = 8). (B) Immunohistochemical detection of IL-12p70+, IL-15+, and IL-18+ cells in the liver tissues of HBV-infected IA= patients, IT subjects, and HC donors (magnification, 400 ×). Positively stained cells appear red and were present in the livers. (C) Quantitative analysis of cytokine-positive cells in the livers of these subjects. Each dot represents one individual. The horizontal bars indicate the median percentiles. The significant P values are shown. (D) IL-12 in combination with IL-15 or IL-18 induced NK cell activation in vitro, as indicated by CD38 and CD69 expression and NCR up-regulation in HC subjects (n = 12). (E) NK cells from IA patients were more prone than those from HC and IT subjects to produce CD107a to degranulate in response to IL-12 in combination with IL-15 in vitro. The data are shown as means and standard deviations. Abbreviation: hpf, high-power field.
We further investigated the protein expression of IL-12p70, IL-15, and IL-18 in situ in the liver for the three cohorts via immunohistochemical staining. As illustrated in Fig. 6B,C, a small number of IL-12p70+, IL-15+, or IL-18+ cells were seen occasionally in the livers of HC and IT subjects, whereas much higher numbers of these cells were found in the livers of IA patients.
Next, we also investigated the influence of IL-12, IL-15, and IL-18 on the NK cell phenotype and function in vitro. NK cells from healthy subjects showed a substantial increase in the expression of activation markers CD38 and CD69 upon IL-12/IL-15 and IL-12/IL-18 stimulation (Fig. 6D). NK cell activation was also accompanied by a significant increase in NCR expression (Fig. 6D). Moreover, after IL-12/IL-15 stimulation, NK cells from IA patients produced more CD107a but not IFN-γ in comparison with those from IT/HC subjects (Fig. 6E). These data indicate that in vitro exposure of NK cells to IL-12/IL-15 or IL-12/IL-18, which were preferentially increased in the livers of IA patients, can reproduce the polarization of the NK cell phenotype and function as we observed ex vivo for these IA patients.
Hepatic NK Cells Exhibit Higher Levels of Activation Markers and Functions Than Those in Peripheral Compartments in IA Patients
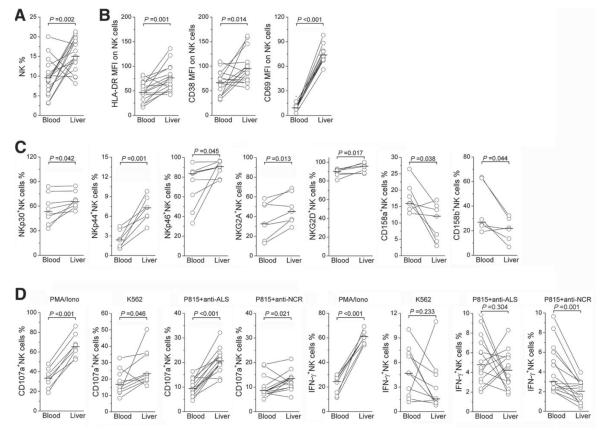
We compared the frequency, activation marker and NK receptor expression, and functions of the hepatic and peripheral NK cell compartments in those IA patients with paired peripheral and intrahepatic samples. The percentage of NK cells in the liver lymphocytes was markedly higher than that in peripheral blood (Fig. 7A). Hepatic NK cells also expressed higher levels of activation markers HLA-DR, CD38, and CD69 (Fig. 7B) and activation receptors NKp30, NKp44, NKp46, NKG2A, and NKG2D but lower levels of inhibitory receptors CD158a and CD158b (Fig. 7C) in comparison with peripheral NK compartments. Furthermore, hepatic NK cells produced more CD107a than peripheral NK cells with all four stimulations, as described in Fig. 7D. In comparison with peripheral NK cells, hepatic NK cells produced higher levels of IFN-γ only upon PMA/ionomycin stimulation and produced less IFN-γ upon P815/anti-NCR stimulation. These data indicate that hepatic NK cells displayed higher levels of activation and cytotoxic functions than peripheral NK cells in these IA patients.
Fig. 7.
Direct comparison of NK cell activation status in intrahepatic and peripheral compartments in IA patients. The proportions of (A) NK cells, (B) NK subsets expressing activation markers HLA-DR, CD38, and CD69, and (C) NK cells expressing activation receptors NKp30, NKp44, NKp46, and NKG2D and inhibitory receptors NKG2A and CD158a/CD158b were compared in IA patients with paired liver and blood samples. (D) The proportions of NK cells producing CD107a and IFN-γ under various stimulations are also shown. Each dot represents one individual. P values are shown.
Hepatic NK Cell Hyperactivity Correlates Positively With Liver Injury in IA Patients
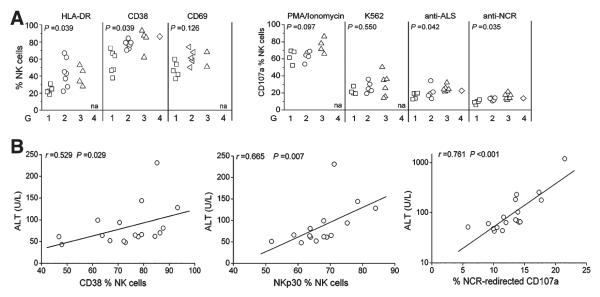
We subsequently analyzed the associations between hepatic NK cell activation status and degranulation capacity and liver injury scores in IA patients. As shown in Fig. 8A, the expression levels of HLA-DR and CD38 on freshly isolated hepatic NK cells and CD107a degranulation in response to anti-ALS or anti-NCR were higher in IA patients with inflammation scores of G2 to G3 versus those with a score of G1. On the contrary, CD69 expression on liver NK cells and PMA/ionomycin and K562 induction of CD107a degranulation were similar between these groups. The correlation analysis further illustrated that the expression of CD38, NKp30, and NCR-redirected CD107a on hepatic NK cells correlated positively with serum ALT levels (all P < 0.05; Fig. 8B). These data suggest that the presence of activated NK cells is closely associated with liver necroinflammation in IA patients.
Fig. 8.
Correlations between the hepatic NK cell activity and liver injury in IA patients. (A) In comparison with patients with lower HAI scores, IA patients with higher HAI scores had a higher percentage of NK cells expressing activation markers and CD107a upon various stimulations in their livers. P values are shown. (B) Correlation analysis of CD38, NKp30, and NCR-redirected CD107a expression on hepatic NK cells and serum ALT levels in IA patients. na, not available.
Discussion
The current study has characterized hepatic and peripheral NK cells in HBV-infected subjects and has demonstrated that (1) activated NK cells preferentially accumulate in the livers of IA patients, in which they are skewed toward cytolytic activity dependent on increased hepatic IL-12, IL-15, and IL-18 expression and decreased IL-10 expression, and (2) the elevated NK cytolytic activity is associated with liver injury, whereas concomitant inefficient IFN-γ production may favor viral persistence in these IA patients. These findings clearly describe the immune status of NK cells in vivo and further define the potential roles of NK cells in liver injury in CHB patients.
Although the hepatic NK cell frequency was reduced in IA patients, the total number of hepatic NK cells from these patients was significantly increased, as demonstrated by immunohistochemistry analyses. The reduced NK cell frequency that we observed was likely due to the dilution by infiltration of many other cells, such as the increased number of T cells observed in this study and the increased numbers of dendritic cells, regulatory T cells, and T helper 17 cells in our previous reports.21,26–28 Importantly, these NK cells were dominated by activation receptor (NKp30, NKp44, and NKp46) expression, whereas inhibitory receptor (CD158a/b) expression was largely decreased in IA patients in comparison with IT/HC subjects. In addition, NK cells from IA patients expressed higher levels of activation markers than NK cells from HC and IT subjects, and this was also mirrored by the functional increase in degranulation and cytolytic activity in IA patients. In combination with previous reports of HBV-infected patients,13,19 our findings support the concept that NK cells in vivo are predominantly polarized toward cytolytic activity in IA patients.
We then investigated the cause of hepatic NK cell activation in IA patients. NK cell functions are tightly regulated by a variety of cytokines such as IFN-α, IL-12, IL-15, IL-18, and IL-10.29 In this study, we found that IA patients displayed increased expression of IL-12, IL-15, and IL-18 in the liver. Such elevations may be responsible for the elevated NK cell activity in IA patients because of their ability to induce NK activation and polarize them toward degranulation in vitro. Interestingly, hepatic IL-10 expression was largely reduced in IA patients in comparison with IT/HC subjects. IL-10 is a potent immunosuppressive cytokine that has been shown to inhibit NK cell functions via indirect inhibition of accessory cell (macrophage/monocyte) functions.30 Thus, hepatic IL-12, IL-15, and IL-18 up-regulation in IA patients may potentially activate NK cells and polarize them toward cytolytic activity, whereas IL-10 reduction in situ may further favor IL-12/IL-15/IL-18–dependent NK cell cytolytic activity.
IFN-α, another important cytokine regulating NK activity, has been implicated in inducing NK cell activation in patients with chronic HCV infection.14 The studies from Dr. Rehermann’s laboratory have demonstrated that IFN-α levels are elevated in the livers of patients with chronic HCV infection and that in vitro treatment with IFN-α results in increased NK cell expression of TRAIL and CD107a but not IFN-γ; this clearly suggests that elevated IFN-γ is responsible for the up-regulation of NK cell activity in the livers of HCV patients. Although the elevation of IFN-α responses is well documented during HCV infection,31,32 the results regarding IFN-α responses during HBV infection have been controversial, and most studies have reported a lack of IFN-α responses after HBV infection.33,34 For example, Fisicaro et al.17 found that acute HBV infection was associated with up-regulation of transient IL-10 expression but not with IFN-α and IL-15 responses. In contrast, in CHB patients with hepatic flares, the cytokine profile was characterized by increased IFN-α and IL-814 as well as chemokine (C-X-C motif) ligand 9 and chemokine (C-X-C motif) ligand 10.35 In our study, we did not find significant up-regulation of hepatic IFN-α2, IFN-β, or IFN-λ1 mRNA expression in IA patients. Thus, our findings suggest that IFN-α may not play an important role in inducing NK cell activation in the HBV patients of our study.
In addition to the aforementioned cytokines, NK cell receptor ligands expressed on target cells can also regulate NK cell activity through the binding of NK cell receptors.29 Several studies have reported that the NKG2D/NKG2D ligand pathway may contribute to NK cell–mediated hepatocyte injury.16,36 Although we have not found the up-regulation of several NK cell activating ligands in the livers of IA patients, the up-regulated NK cell activating receptors and down-regulated inhibitory receptors on hepatic NK cells from IA patients likely have increased sensitivity to activation by target cells and contribute to the increased NK cell functions in these patients. In addition, similarly to previous studies,14,15 our data also indicated that TRAIL expression on NK cells was increased in IA patients, and the blockade of TRAIL could slightly reduce NK-mediated target apoptosis (data not shown). However, we failed to find FasL up-regulation on NK cells, which is also responsible for NK cell–mediated hepatocyte injury.16 It is plausible to speculate that NK cells may use different ligands to mediate liver damage in various disease progression stages of HBV infection, and this may account for the discrepancy between these studies. Future studies should investigate whether this differential expression of hepatic cytokines can trigger various effector pathways of NK cells to induce liver injury during HBV infection.
Notably, the present study, in contrast to previous reports of NK cells in chronic HBV infection,13,19 preferentially defines the role of hepatic NK cells in HBeAg-positive individuals. In comparison with CHB patients in these two reports,13,19 IA patients enrolled in our study were younger and had more severe liver injury, which was indicated by high ALT levels (median = 196 U/L, range = 41-1298 U/L) and more active viral replication (>8 log IU/mL). These differences may account to some extent for the discrepancy in the NK cell frequency and phenotype even in IFN-γ production between the present study and the two recent reports.13,19 In addition, different stimulation methods may lead to different results.23 Nevertheless, an important finding of the present study is that activated NK cells were skewed toward cytolytic activity in situ in the livers of IA patients but without a concomitant increase in IFN-γ production. These findings, in combination with recent reports of CHB patients13 and chronic HCV infection,15 support the concept that enhanced NK cytolytic activity may mediate liver injury, whereas insufficient and/or deficient IFN-γ production by NK cells may not be sufficient to achieve viral clearance.
In conclusion, this study indicates that imbalanced hepatic cytokine profiles may drive NK cells toward hypercytolytic activity without increasing IFN-γ production in the livers of IA patients, and this may be responsible for the liver damage without virus clearance seen in patients with chronic HBV infection. These findings indicate that NK cells actively participate in liver immunopathogenesis in patients with chronic HBV infection. This study will help to facilitate the rational development of immunotherapeutic strategies that can decrease the NK cytolytic capacity while enhancing IFN-γ production in patients with chronic HBV infection.
Supplementary Material
Acknowledgments
Supported by This study was supported by the National Grand Program on Key Infectious Diseases (grants 2009ZX10004-309, 2008ZX10002-007, and 2008ZX10002-005-6), the National Key Basic Research Program of China (grants 2007CB512805, 2007CB512804, and 2009CB522507), the Key Program of the National Natural Science Foundation of China (grant 30730088), and the National Natural Science Foundation of China (grant 30972752).
Abbreviations
- 7-AAD
7-aminoactinomycin D
- ALS
antilymphocyte serum
- ALT
alanine aminotransferase
- CFSE
carboxyfluorescein diacetate succinimidyl ester
- CHB
chronic hepatitis B
- E:T
effector to target
- FasL
Fas ligand
- HAI
histological activity index
- HBeAg
hepatitis B e antigen
- HBV
hepatitis B virus
- HC
healthy control
- HCV
hepatitis C virus
- HLA
human leukocyte antigen
- hpf
high-power field
- IA
immune-activated
- IFN
interferon
- IL
interleukin
- IT
immune-tolerant
- LIL
liver-infiltrating lymphocyte
- MFI
mean fluorescence intensity
- mRNA
messenger RNA
- NCR
natural cytotoxicity receptor
- NK
natural killer
- NKG2A
natural killer group 2 member A
- NKG2D
natural killer group 2 member D
- NKT
natural killer T
- PBMC
peripheral blood mononuclear cell
- PMA
phorbol myristate acetate
- TRAIL
tumor necrosis factor–related apoptosis-inducing ligand
Footnotes
Potential conflict of interest: Nothing to report.
Additional Supporting Information may be found in the online version of this article.
References
- 1.Rehermann B, Nascimbeni M. Immunology of hepatitis B virus and hepatitis C virus infection. Nat Rev Immunol. 2005;5:215–229. doi: 10.1038/nri1573. [DOI] [PubMed] [Google Scholar]
- 2.Chang JJ, Lewin SR. Immunopathogenesis of hepatitis B virus infection. Immunol Cell Biol. 2007;85:16–23. doi: 10.1038/sj.icb.7100009. [DOI] [PubMed] [Google Scholar]
- 3.Chisari FV, Ferrari C. Hepatitis B virus immunopathogenesis. Annu Rev Immunol. 1995;13:29–60. doi: 10.1146/annurev.iy.13.040195.000333. [DOI] [PubMed] [Google Scholar]
- 4.Boni C, Fisicaro P, Valdatta C, Amadei B, Di Vincenzo P, Giuberti T, et al. Characterization of hepatitis B virus (HBV)-specific T-cell dysfunction in chronic HBV infection. J Virol. 2007;81:4215–4225. doi: 10.1128/JVI.02844-06. [DOI] [PMC free article] [PubMed] [Google Scholar]
- 5.Fisicaro P, Valdatta C, Massari M, Loggi E, Biasini E, Sacchelli L, et al. Antiviral intrahepatic T-cell responses can be restored by blocking programmed death-1 pathway in chronic hepatitis B. Gastroenterology. 2010;138:682–693. doi: 10.1053/j.gastro.2009.09.052. [DOI] [PubMed] [Google Scholar]
- 6.Lopes AR, Kellam P, Das A, Dunn C, Kwan A, Turner J, et al. Bimmediated deletion of antigen-specific CD8 T cells in patients unable to control HBV infection. J Clin Invest. 2008;118:1835–1845. doi: 10.1172/JCI33402. [DOI] [PMC free article] [PubMed] [Google Scholar]
- 7.Das A, Hoare M, Davies N, Lopes AR, Dunn C, Kennedy PT, et al. Functional skewing of the global CD8 T cell population in chronic hepatitis B virus infection. J Exp Med. 2008;205:2111–2124. doi: 10.1084/jem.20072076. [DOI] [PMC free article] [PubMed] [Google Scholar]
- 8.Maini MK, Boni C, Lee CK, Larrubia JR, Reignat S, Ogg GS, et al. The role of virus-specific CD8(+) cells in liver damage and viral control during persistent hepatitis B virus infection. J Exp Med. 2000;191:1269–1280. doi: 10.1084/jem.191.8.1269. [DOI] [PMC free article] [PubMed] [Google Scholar]
- 9.Sitia G, Isogawa M, Iannacone M, Campbell IL, Chisari FV, Guidotti LG. MMPs are required for recruitment of antigen-nonspecific mononuclear cells into the liver by CTLs. J Clin Invest. 2004;113:1158–1167. doi: 10.1172/JCI21087. [DOI] [PMC free article] [PubMed] [Google Scholar]
- 10.Kakimi K, Lane TE, Wieland S, Asensio VC, Campbell IL, Chisari FV, et al. Blocking chemokine responsive to gamma-2/interferon (IFN)-gamma inducible protein and monokine induced by IFN-gamma activity in vivo reduces the pathogenetic but not the antiviral potential of hepatitis B virus-specific cytotoxic T lymphocytes. J Exp Med. 2001;194:1755–1766. doi: 10.1084/jem.194.12.1755. [DOI] [PMC free article] [PubMed] [Google Scholar]
- 11.Racanelli V, Rehermann B. The liver as an immunological organ. Hepatology. 2006;43:S54–S62. doi: 10.1002/hep.21060. [DOI] [PubMed] [Google Scholar]
- 12.Gao B, Radaeva S, Park O. Liver natural killer and natural killer T cells: immunobiology and emerging roles in liver diseases. J Leukoc Biol. 2009;86:513–528. doi: 10.1189/jlb.0309135. [DOI] [PMC free article] [PubMed] [Google Scholar]
- 13.Oliviero B, Varchetta S, Paudice E, Michelone G, Zaramella M, Mavilio D, et al. Natural killer cell functional dichotomy in chronic hepatitis B and chronic hepatitis C virus infections. Gastroenterology. 2009;137:1151–1160. doi: 10.1053/j.gastro.2009.05.047. [DOI] [PubMed] [Google Scholar]
- 14.Dunn C, Brunetto M, Reynolds G, Christophides T, Kennedy PT, Lampertico P, et al. Cytokines induced during chronic hepatitis B virus infection promote a pathway for NK cell-mediated liver damage. J Exp Med. 2007;204:667–680. doi: 10.1084/jem.20061287. [DOI] [PMC free article] [PubMed] [Google Scholar]
- 15.Ahlenstiel G, Titerence RH, Koh C, Edlich B, Feld JJ, Rotman Y, et al. Natural killer cells are polarized toward cytotoxicity in chronic hepatitis C in an interferon-alfa-dependent manner. Gastroenterology. 2010;138:325–335. doi: 10.1053/j.gastro.2009.08.066. [DOI] [PMC free article] [PubMed] [Google Scholar]
- 16.Zou Y, Chen T, Han M, Wang H, Yan W, Song G, et al. Increased killing of liver NK cells by Fas/Fas ligand and NKG2D/NKG2D ligand contributes to hepatocyte necrosis in virus-induced liver failure. J Immunol. 2010;184:466–475. doi: 10.4049/jimmunol.0900687. [DOI] [PubMed] [Google Scholar]
- 17.Fisicaro P, Valdatta C, Boni C, Massari M, Mori C, Zerbini A, et al. Early kinetics of innate and adaptive immune responses during hepatitis B virus infection. Gut. 2009;58:974–982. doi: 10.1136/gut.2008.163600. [DOI] [PubMed] [Google Scholar]
- 18.Webster GJ, Reignat S, Maini MK, Whalley SA, Ogg GS, King A, et al. Incubation phase of acute hepatitis B in man: dynamic of cellular immune mechanisms. Hepatology. 2000;32:1117–1124. doi: 10.1053/jhep.2000.19324. [DOI] [PubMed] [Google Scholar]
- 19.Bonorino P, Ramzan M, Camous X, Dufeu-Duchesne T, Thelu MA, Sturm N, et al. Fine characterization of intrahepatic NK cells expressing natural killer receptors in chronic hepatitis B and C. J Hepatol. 2009;51:458–467. doi: 10.1016/j.jhep.2009.05.030. [DOI] [PubMed] [Google Scholar]
- 20.Ganem D, Prince AM. Hepatitis B virus infection—natural history and clinical consequences. N Engl J Med. 2004;350:1118–1129. doi: 10.1056/NEJMra031087. [DOI] [PubMed] [Google Scholar]
- 21.Zhang Z, Chen D, Yao J, Zhang H, Jin L, Shi M, et al. Increased infiltration of intrahepatic DC subsets closely correlate with viral control and liver injury in immune active pediatric patients with chronic hepatitis B. Clin Immunol. 2007;122:173–180. doi: 10.1016/j.clim.2006.09.006. [DOI] [PubMed] [Google Scholar]
- 22.Scheuer PJ. Classification of chronic viral hepatitis: a need for reassessment. J Hepatol. 1991;13:372–374. doi: 10.1016/0168-8278(91)90084-o. [DOI] [PubMed] [Google Scholar]
- 23.Rehermann B, Naoumov NV. Immunological techniques in viral hepatitis. J Hepatol. 2007;46:508–520. doi: 10.1016/j.jhep.2007.01.002. [DOI] [PubMed] [Google Scholar]
- 24.Cai L, Zhang Z, Zhou L, Wang H, Fu J, Zhang S, et al. Functional impairment in circulating and intrahepatic NK cells and relative mechanism in hepatocellular carcinoma patients. Clin Immunol. 2008;129:428–437. doi: 10.1016/j.clim.2008.08.012. [DOI] [PubMed] [Google Scholar]
- 25.Zhang Z, Zhang JY, Wherry EJ, Jin B, Xu B, Zou ZS, et al. Dynamic programmed death 1 expression by virus-specific CD8 T cells correlates with the outcome of acute hepatitis B. Gastroenterology. 2008;134:1938–1949. doi: 10.1053/j.gastro.2008.03.037. [DOI] [PubMed] [Google Scholar]
- 26.Zhang Z, Zou ZS, Fu JL, Cai L, Jin L, Liu YJ, et al. Severe dendritic cell perturbation is actively involved in the pathogenesis of acute-on-chronic hepatitis B liver failure. J Hepatol. 2008;49:396–406. doi: 10.1016/j.jhep.2008.05.017. [DOI] [PubMed] [Google Scholar]
- 27.Xu D, Fu J, Jin L, Zhang H, Zhou C, Zou Z, et al. Circulating and liver resident CD4+CD25+ regulatory T cells actively influence the antiviral immune response and disease progression in patients with hepatitis B. J Immunol. 2006;177:739–747. doi: 10.4049/jimmunol.177.1.739. [DOI] [PubMed] [Google Scholar]
- 28.Zhang JY, Zhang Z, Lin F, Zou ZS, Xu RN, Jin L, et al. Interleukin-17-producing CD4(+) T cells increase with severity of liver damage in patients with chronic hepatitis B. Hepatology. 2010;51:81–91. doi: 10.1002/hep.23273. [DOI] [PubMed] [Google Scholar]
- 29.Vivier E, Tomasello E, Baratin M, Walzer T, Ugolini S. Functions of natural killer cells. Nat Immunol. 2008;9:503–510. doi: 10.1038/ni1582. [DOI] [PubMed] [Google Scholar]
- 30.Moore KW, de Waal Malefyt R, Coffman RL, O’Garra A. Interleukin-10 and the interleukin-10 receptor. Annu Rev Immunol. 2001;19:683–765. doi: 10.1146/annurev.immunol.19.1.683. [DOI] [PubMed] [Google Scholar]
- 31.Su AI, Pezacki JP, Wodicka L, Brideau AD, Supekova L, Thimme R, et al. Genomic analysis of the host response to hepatitis C virus infection. Proc Natl Acad Sci U S A. 2002;99:15669–15674. doi: 10.1073/pnas.202608199. [DOI] [PMC free article] [PubMed] [Google Scholar]
- 32.Takahashi K, Asabe S, Wieland S, Garaigorta U, Gastaminza P, Isogawa M, et al. Plasmacytoid dendritic cells sense hepatitis C virus-infected cells, produce interferon, and inhibit infection. Proc Natl Acad Sci U S A. 2010;107:7431–7436. doi: 10.1073/pnas.1002301107. [DOI] [PMC free article] [PubMed] [Google Scholar]
- 33.Wieland S, Thimme R, Purcell RH, Chisari FV. Genomic analysis of the host response to hepatitis B virus infection. Proc Natl Acad Sci U S A. 2004;101:6669–6674. doi: 10.1073/pnas.0401771101. [DOI] [PMC free article] [PubMed] [Google Scholar]
- 34.Wieland SF, Chisari FV. Stealth and cunning: hepatitis B and hepatitis C viruses. J Virol. 2005;79:9369–9380. doi: 10.1128/JVI.79.15.9369-9380.2005. [DOI] [PMC free article] [PubMed] [Google Scholar]
- 35.Tan AT, Koh S, Goh W, Zhe HY, Gehring AJ, Lim SG, et al. A longitudinal analysis of innate and adaptive immune profile during hepatic flares in chronic hepatitis B. J Hepatol. 2010;52:330–339. doi: 10.1016/j.jhep.2009.12.015. [DOI] [PubMed] [Google Scholar]
- 36.Chen Y, Wei H, Sun R, Dong Z, Zhang J, Tian Z. Increased susceptibility to liver injury in hepatitis B virus transgenic mice involves NKG2D-ligand interaction and natural killer cells. Hepatology. 2007;46:706–715. doi: 10.1002/hep.21872. [DOI] [PubMed] [Google Scholar]
Associated Data
This section collects any data citations, data availability statements, or supplementary materials included in this article.


