Abstract
Neurofibromatosis Type 1 (NF1) is a genetic disorder that is driven by the loss of neurofibromin (Nf) protein function. Nf contains a Ras GTPase activating domain (Ras-GAP), which directly regulates Ras signaling. Numerous clinical manifestations are associated with the loss of Nf and increased Ras activity. Ras proteins must be prenylated in order to traffic and functionally localize with target membranes. Hence, Ras is a potential therapeutic target for treating NF1. We have tested the efficacy of two novel farnesyl transferase inhibitors (FTI), 1 and 2, alone or in combination with lovastatin, on two NF1 malignant peripheral nerve sheath tumor (MPSNT) cell lines, NF90-8 and ST88-14. Single treatments of 1, 2, or lovastatin had no effect on MPNST cell proliferation. However, low micromolar combinations of 1 or 2 with lovastatin (FTI/lovastatin) reduced Ras prenylation in both MPNST cell lines. Further, this FTI/lovastatin combination treatment reduced cell proliferation and induced an apoptotic response as shown by morphological analysis, pro-caspase-3/-7 activation, loss of mitochondrial membrane potential, and accumulation of cells with sub G1 DNA content. Little to no detectable toxicity was observed in normal rat Schwann cells following FTI/lovastatin combination treatment. These data support the hypothesis that combination FTI plus lovastatin therapy may be a potential treatment for NF1 MPNSTs.
Introduction
Neurofibromatosis Type 1 (NF1) is a genetically inherited syndrome that affects approximately 1:3000 individuals (Arun and Gutmann, 2004). NF1 presents with an array of clinical manifestations that can arise during early development through adulthood, including increased pigmentation of the skin (café au lait macules), Lisch nodules of the iris, learning disabilities, and abnormal development of the skeletal system (Lynch and Gutmann, 2002). NF1 is characterized by the development of benign peripheral nerve sheath tumors (BPNST) or neurofibromas. Approximately 10% of NF1 patients experience tumor transformation to the more aggressive malignant peripheral nerve sheath tumors (MPNST) (Ward and Gutmann, 2005). Progression toward MPNST is a leading cause of increased mortality for NF1 patients. Therapies are limited to excision of neurofibromas, radiation of plexiform neurofibromas, and the use of cytotoxic compounds. Although excision of tumors is the primary form of treatment, the tumors tend to return (Packer et al., 2002). A molecularly targeted therapy designed against the molecular background of NF1 may reveal more effective approaches for treatment of NF1 (Dilworth et al., 2006).
The molecular pathogenesis of NF1 was better understood following the discovery of the NF1 gene, which encodes the protein neurofibromin (Nf). Nf contains a Ras GTPase activating protein (Ras-GAP) domain (DeClue et al., 1991). This domain is responsible for controlling Ras signaling by increasing the intrinsic rate of Ras hydrolysis, thus converting the active Ras-GTP to the inactive Ras-GDP form (Eccleston et al., 1993). Germline mutations of the NF1 gene result in reduced Nf expression and a loss of Ras-GAP activity. The consequence of losing Ras-GAP activity is aberrant Ras signaling that can potentially lead to the development of NF1 (Basu et al., 1992; Feldkamp et al., 1999). Our lab and others have previously targeted downstream signaling partners of Ras by treating MPNST cell lines with MEK inhibitors (Tang et al., 1998; Chadee and Kyriakis, 2004; Mattingly et al., 2006; Roth et al., 2007). We have shown that PD184352 (CI-1040) induced apoptosis in MPNST cell lines, confirming the dependence of the Ras-MAPK pathway in this disease (Mattingly et al., 2006).
Ras proteins are translated in the cytoplasm as inactive precursor molecules that must undergo a series of post-translational modifications before the protein can fully function (Gibbs et al., 2001). The first necessary step is the covalent addition of a prenyl group, either a 15C farnesyl or a 20C geranylgeranyl group, to the C-Terminal “CaaX” box (Basso et al., 2006).
Reducing the prenylation of proteins to treat NF1 has been recognized as a potential therapeutic approach. For example, the farnesyl transferase inhibitor (FTI) BMS-186511 reduces proliferation of MPNST cell line ST88-14 (Yan et al., 1995), and FTI L-739-749 reduces proliferation of Nf-deficient mouse Schwann cells (Kim et al., 1997). A phase I clinical trial utilizing FTI tipifarnib to treat plexiform neurofibromas was tolerated well in children, but no objective responses were achieved (Widemann et al., 2006). Although this study has advanced to an ongoing Phase II trial (NCT00029354), it is likely that further development of this treatment approach will be required.
Our lab is interested in utilizing FTIs and lovastatin, an inhibitor of the HMG-CoA reductase, to reduce prenylation of proteins as a potential therapy for numerous diseases. We have previously reported that lovastatin, in combination with FTI 3-allylfarnesol, induces relocation of RhoB from the membrane fraction to the cytosolic fraction following treatment in A10 vascular smooth muscle cells. The translocation of RhoB from the membrane to the cytosol is the result of inhibiting RhoB prenylation (Mattingly et al., 2002). A prodrug analog of 3-allylfarnesol phosphate was also shown to inhibit RhoB prenylation in STS-26T MPNST cells when used in combination with lovastatin, resulting in reduced cell proliferation (Clark et al., 2007).
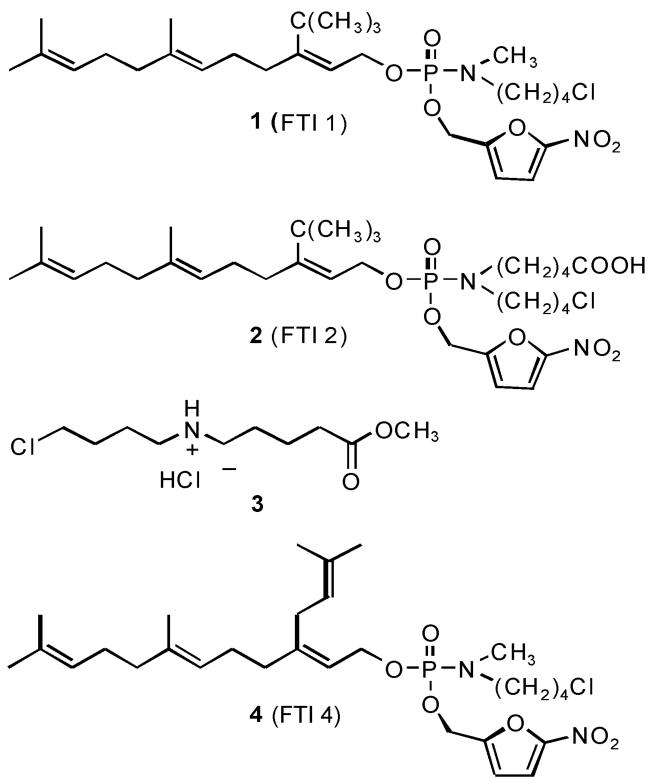
Here we describe our efforts to characterize the effectiveness of two novel FTase inhibitors, 1 (Clark et al., 2007) and 2, on human NF1 MPNST cell lines, NF90-8 and ST88-14. The prodrug structures are shown in Fig. 1. Prodrug 1 is highly lipophilic, so an analog 2 was prepared in which a carboxylate side chain, which would be ionized at physiologic pH, replaced the N-methyl group on the prodrug moiety. The entire prodrug moiety is released from the inhibitor following activation inside the cell (Clark et al., 2007), so this modification will have no effect on inhibitor affinity. Our objective was to determine the efficacy of these compounds on Ras prenylation and cell proliferation when used in combination with lovastatin. The data show reduction of Ras prenylation in both cell lines with cell cycle G1 arrest and increased caspase activity following FTI/lovastatin combination treatment, but lack of toxicity in normal rat Schwann cells.
Figure 1.
The synthesis of prodrug FTI 1, which was previously reported as compound 5c, has been described (Clark et al., 2007). Prodrug FTI 2 was synthesized via an analogous route using aminoester 3 instead of methyl chlorobutylamine to generate the methyl ester of FTI 1, followed by selective hydrolysis to the free acid. Compounds 1 and 2 differ at the prodrug moiety, which is removed following entrance into the cell and prodrug activation. The prodrug moiety should not affect the inhibitory function of the farnesyl phosphate analog released. FTI 4 is an analog of compound 1 that is inactive as an FTI (Clark et al., 2007).
Methods
Compounds and Reagents
The synthesis of prodrug 1 has been reported (Clark et al., 2007). Prodrug 2 was synthesized via an analogous route using aminoester 4 instead of methyl chlorobutylamine to generate prodrug ester 3, followed by selective hydrolysis of the methyl ester (Fig. 1). Lovastatin (Sigma Aldrich, St Louis, MO) aliquots were prepared in dimethyl sulfoxide and stored at −80°C. JC-1 (5,5′,6,6′-tetrachloro-1,1′,3,3′-tetraethylbenzimidazolylcarbocyanine iodide) and Hoëchst 33342 (Invitrogen Molecular Probes, Carlsbad, CA) were prepared in dimethyl sulfoxide and stored at 4°C. Mitotracker Orange CM-H2 TM Ros (Invitrogen Molecular Probes, Carlsbad, CA) aliquots were prepared in dimethyl sulfoxide and stored at −20°C.
Cell Culture
NF90-8 and ST88-14 MPNST cell lines were generously donated by T. Glover (University of Michigan, Ann Arbor, MI). Cells were maintained as adherent cultures in RPMI 1640 (Gibco, Carlsbad, CA) with 5% Fetal Bovine Serum (Hyclone Laboratories, Logan, UT), 100 units/ml penicillin, and 100 μg/ml streptomycin (Invitrogen, Carlsbad, CA). Primary normal rat Schwann cells were isolated from the sciatic nerves of neonatal Sprague-Davey Rats and grown on poly-D-lysine coated coverslips as described previously (Skoff et al., 1998). These cells were grown in Eagles medium with 10% calf serum prior to experimental manipulations. Normal, spontaneously immortal rat Schwann cell clones (iSC) isolated from sciatic nerves were a generous gift from E.M. Shooter (Stanford University, Stanford, CA) and described previously (Bolin et al., 1992). These cells were maintained in MEM supplemented with 10% horse serum, 100 units/ml penicillin, and 100 μg/ml streptomycin. All cells were maintained in a humidified incubator under 5% CO2. For all experiments, cells were plated 24 hours prior to drug treatment. Immediately before drug treatment, the medium was replaced with fresh growth medium for the duration of the experiment.
Western Analysis
Lysates were prepared from monolayers of cells in 2× Laemmli sample buffer by boiling for 5 minutes and cleared by centrifugation (Mattingly et al., 2001). Samples were then separated on polyacrylamide-SDS gels and electrophoretically transferred to nitrocellulose. Ras was detected with a 1:250 dilution of anti-pan Ras monoclonal antibody (BD Transduction Laboratories, San Jose, CA). Caspase-3 was detected with a 1:1000 dilution of anti-Caspase-3 polycolonal antibody (Santa Cruz Biotechnology, Inc., Santa Cruz, CA) as described (Menard et al., 2005). Retinoblastoma protein (pRb) phosphorylated Serine 780 was detected with a 1:1000 dilution of anti-Phospho-Rb Ser 780 polyclonal antibody (Cell Signaling Technology, Danvers, MA). The nitrocellulose membrane was stripped and reprobed for total pRb with a 1:1000 dilution of a mouse monoclonal antibody (Cell Signaling Technology). β-Tubulin was immunoblotted with a 1:2000 dilution of the E7 monoclonal antibody (Developmental Studies Hybridoma Bank, Iowa City, IA).
Proliferation Assay
NF90-8 cells were plated at 20,000 cells/35-mm dish and ST88-14 cells were plated at 20,000 cells/60-mm dish 24 hours prior to drug treatment. Fresh medium was added before the drug treatment as described in the text. Attached cells were trypsinized and combined with media containing detached cells. The cells were collected by centrifugation for 5 minutes at 1000g and counted via a hemacytometer.
Flow Cytometry
NF90-8 and ST88-14 cells were treated and collected for DNA analysis as described previously (Reiners et al., 1999). DNA content was analyzed using a FACScalibur instrument (BD Biosciences, San Jose, CA). A minimum of 104 cells/sample were analyzed to determine the percentage of apoptotic cells and cells in G1, S, and G2/M phase (MODFIT; Variety Software, Topsham, ME).
DEVDase Activity Assay
Lysates of NF90-8 and ST88-14 cultures were prepared and used in DEVDase assays as previously described (Caruso et al., 2004). Changes in fluorescence over time were converted into picomoles of product by comparison with a standard curve made with 7-amino-4-methylcoumarin. DEVDase specific activities are reported as nanomoles of product per minute per milligram of protein. The bicinchoninic acid assay, using bovine serum albumin as a standard, was used to estimate protein concentrations.
Mitochondrial Membrane Potential and Nuclear Morphology
NF90-8 cells were plated at 100,000 cells/100-mm dish 24 hours prior to drug treatment. At the end of the drug treatment, mitochondrial membrane potential (Δψm) was assayed by two independent methods. In one series of experiments, JC-1 was added directly to the medium at a final concentration of 5 μg/ml, and incubated for 10 minutes at 37°C. Attached cells were trypsinized and combined with growth media containing detached cells. The cells were collected at 500 g for 5 minutes, washed twice in PBS, and suspended in PBS containing 1% FBS for analysis by excitation at 530 nm and emission at 590 nm. Cells with active mitochondria accumulate red emitting “JC-1 aggregates”. In cells having depolarized mitochondria, JC-1 is present as monomers, which exhibit green, not red, fluorescence emission.
In a second series of experiments, Mitotracker Orange CM-H2 TM Ros (excitation at 554 nM and emission at 576 nM) was added directly to the medium of treated cultures at a final concentration of 50 nM, and incubated for 10 minutes at 37°C. Hoëchst 33342 (excitation at 350 nM and emission at 461 nM) was added directly to the medium at a final concentration of 500 nM to reveal nuclear morphology, and co-incubated with the Mitotracker for 5 minutes at 37°C. Cultures were rinsed once with PBS and subsequently rinsed three times with fresh growth medium. Images were immediately acquired with an Axiovert 200M fluorescence microscope (Carl Zeiss). Cells with reduced Δψm are unable to sequester and oxidize Mitotracker Orange, and will exhibit reduced fluorescence emission.
Statistical analysis
Two-tailed paired student t-test was employed to determine the statistical significance of a G1 cell cycle arrest between FTI/lovastatin combination treatment cultures and the DMSO control cultures. The significance level for this analysis was set at p<0.05.
Results
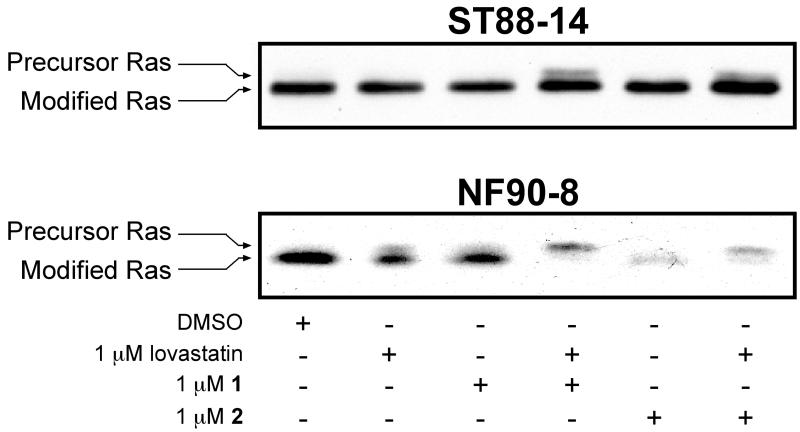
Our lab has previously reported that N-Ras is the predominant active Ras isoform expressed in the human derived MPNST cell lines NF90-8 and ST88-14 (Mattingly et al., 2006). N-Ras can be alternatively prenylated with a geranylgeranyl pyrophosphate in the presence of FTIs (Whyte et al., 1997). We therefore tested whether our novel FTIs (1 and 2) could reduce Ras prenylation in MPNST cell lines NF90-8 and ST88-14 (Fig. 2). Inhibition of prenylation is indicated by the slower mobility band or upshift by western analysis. Single 1 μM treatments of 1, 2, or lovastatin had little to no detectable effect on Ras prenylation in either cell line. However, a reduction of Ras prenylation was observed in the NF90-8 cells following combination treatment of 1 μM 1 or 2 with 1 μM lovastatin. Ras prenylation was also reduced in ST88-14 FTI/lovastatin combination treated cells compared to the single treatments of 1, 2, or lovastatin. The observed reduction of Ras prenylation in ST88-14 cells was moderate compared to that occurring in NF90-8 FTI/lovastatin treated cells.
Figure 2. Inhibition of Ras prenylation in MPNST cells by FTI/lovastatin combination treatment.
NF90-8 and ST88-14 cultures were treated as indicated for 24 hours. Whole cell lysates were probed for Ras prenylation status by monitoring changes in mobility via western analysis. Prenylated Ras forms migrate faster on SDS gels. FTI/lovastatin combination treatment reduced the expression of modified Ras in both cell lines. Results shown are representative of two independent experiments.
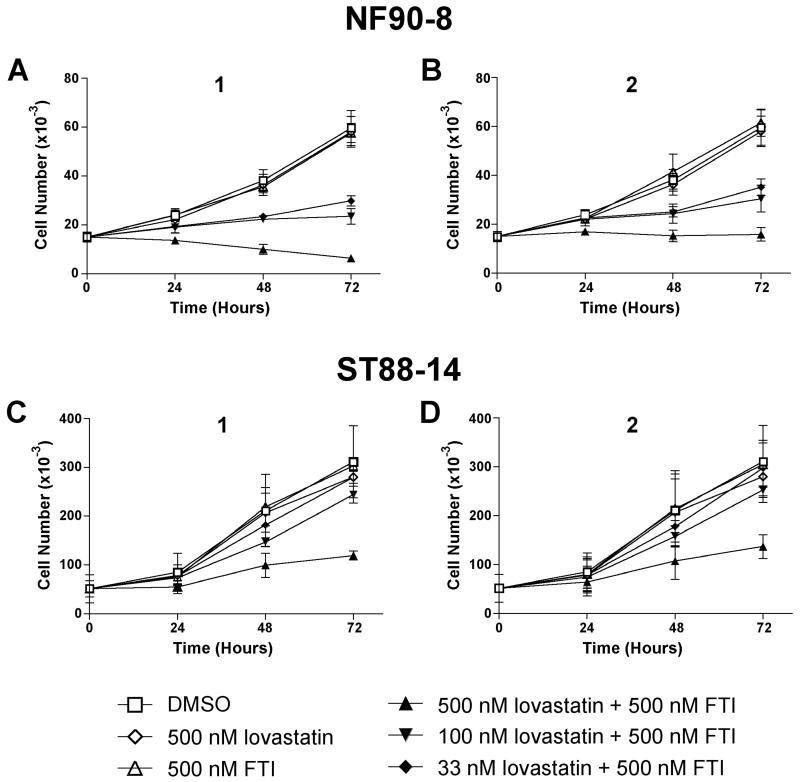
Ras isoforms are known to regulate cell processes such as survival, growth, and proliferation (Rajalingam et al., 2007). Since our FTI/lovastatin combination treatment reduced Ras prenylation in NF90-8 and ST88-14 cells (Fig. 2), we next determined the effect of this treatment on cell proliferation. The results from proliferation experiments with NF90-8 cells are shown in Fig. 3A-B. Single treatments of 500 nM 1, 2, or lovastatin alone, had no effect on cell proliferation compared to cultures that were treated with DMSO. However, combination treatments of 500 nM 1 plus 500 nM lovastatin were cytostatic after 24 hours of treatment, and reduced total cell number below initial plating after 72 hours of treatment (Fig. 3A). A similar cytostatic response was observed following treatment with 500 nM 2 plus 500 nM lovastatin (Fig. 3B). Inhibition of proliferation also occurred in the presence of lower concentrations of lovastatin (33 and 100 nM) in combination with 500 nM 1 or 2. Synergism of the FTI compounds with 33 nM lovastatin is notable because this dose of lovastatin is pharmacologically achievable in humans treated with anti-cholesterol doses of statins (Thibault et al., 1996). Proliferation data for ST88-14 cells treated with nanomolar combinations of FTI/lovastatin are shown in Fig. 3C-D. Single treatment with DMSO, 1, 2, or lovastatin had no effect on cell proliferation. However, when 500 nM 1 or 2 were used in combination with 500 nM lovastatin, we observed a reduction of ST88-14 proliferation. Unlike the NF90-8 cells, lower doses of lovastatin in combination with 500 nM 1 or 2 had less effect on cell proliferation.
Figure 3. Reduced MPNST proliferation following FTI/lovastatin treatment.
NF90-8 (A-B) and ST88-14 (C-D) cell lines were treated as indicated in the figure. Samples were collected every 24 hours post treatment for analysis of cell number. Data represent means ± S.D. of three independent experiments.
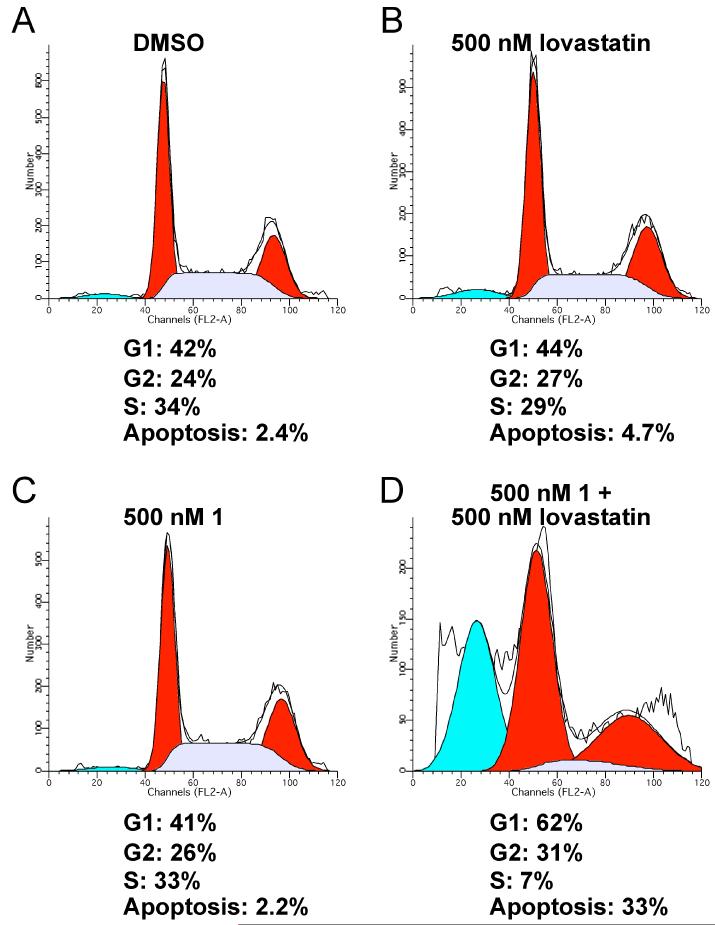
We subsequently investigated the effects of FTI/lovastatin treatment on NF90-8 and ST88-14 cell cycle progression. Fig. 4 shows FACS analysis of NF90-8 cells treated with 500 nM 1, or with 500 nM lovastatin, or a combination of the two drugs for 48 hours. Single treatments with these compounds yielded cell cycle profiles comparable to the DMSO control, which was also similar to untreated controls (Table 1 and Supplemental Fig. 1). The combination treatment results in an increased percentage of cells in G1, and a significant percentage of cells undergoing apoptosis, compared to the control cultures. These data coincide with the proliferation data in Fig. 3A, where we observed a cytostatic affect of 500 nM 1 plus 500 nM lovastatin at 24 hours, and a cytotoxic effect at 48 hours. Similar results were observed with 500 nM 2 in combination with 500 nM lovastatin (Table 1 and Supplemental Fig. 1). As a control for these experiments, we also tested compound 4 (Fig. 1), an analog of compound 1 that is inactive as an FTI, and that has no effect on the proliferation of the spontaneous MPNST cell line, STS-26T [Compound 5d in (Clark et al., 2007)]. The cell cycle distribution of NF90-8 and ST88-14 cells were not affected by treatment with 1 μM 4 alone or in combination with 1 μM lovastatin (data not shown). Cell cycle progression of ST88-14 cells was also analyzed at 24 and 48 hours following treatment with either 500 nM 1 or 500 nM 2 with or without 500 nM lovastatin (Table 2 and Supplemental Fig. 2). We observed a moderate G1 cell cycle arrest at 24 hours that was maintained at 48 hours following FTI/lovastatin combination treatment. Although we observed an increased percentage of apoptotic cells at 48 hours, the effect was more modest than that observed in NF90-8 cultures.
Figure 4. FTI/lovastatin combination treatment of NF90-8 cells increases G1 and apoptotic cells.
NF90-8 cultures were treated 24 hours after plating according to the condition in figure. Cultures were harvested after 48 hours of treatment for DNA content stained with propidium iodide. Histograms represent 104 events and the cell cycle profile was determined using MODFIT. 500 nM 1 in combination with 500 nM lovastatin increased the number of cells in G1 and greatly increased the presence of cells with sub-G1 DNA content.
Table 1. NF90-8 cell cycle analysis.
NF90-8 cells were treated as indicated above for 24 or 48 hours. Data represent the mean ± SD of three independent experiments.
| DNA analysis of NF90-8 MPNST cells | ||||
|---|---|---|---|---|
| G1 | G2 | S | Apoptosis | |
| 0 Hours | ||||
| Untreated | 32.0% ± 3.7 | 37.4% ± 0.8 | 30.6% ± 4.3 | 0.2% ± 0.4 |
| 24 Hours | ||||
|
| ||||
| DMSO | 40.0% ± 2.1 | 29.0% ± 2.7 | 30.8% ± 5.2 | 1.3% ± 0.3 |
| 500 nM lovastatin | 40.0% ± 2.3 | 24.5% ± 2.8 | 35.3% ± 1.2 | 2.0% ± 0.4 |
| 500 nM 1 | 41.1% ± 1.8 | 24.7% ± 2.9 | 34.2% ± 1.3 | 1.7% ± 0.3 |
| 500 nM 1 + 500 nM lovastatin | 50.2% ± 2.0 * | 25.9% ± 2.0 | 23.9% ± 3.0 | 12.6% ± 1.8 * |
| 500 nM 2 | 41.5% ± 1.6 | 26.5% ± 2.2 | 32.0% ± 3.6 | 1.5% ± 0.5 |
| 500 nM 2 + 500 nM lovastatin | 49.6% ± 3.4 * | 26.2% ± 1.3 | 24.2% ± 2.7 | 5.9% ± 0.9 |
| 48 Hours | ||||
|
| ||||
| DMSO | 44.4% ± 2.4 | 23.3% ± 2.3 | 32.3% ± 1.9 | 2.7% ± 0.4 |
| 500 nM lovastatin | 46.7% ± 2.6 | 26.4% ± 1.4 | 26.9% ± 1.9 | 3.6% ± 1.0 |
| 500 nM 1 | 43.0% ± 2.5 | 24.4% ± 1.6 | 32.6% ± 2.4 | 3.0% ± 0.7 |
| 500 nM 1 + 500 nM lovastatin | 62.7% ± 2.9 * | 31.0% ± 2.0 | 6.3% ± 1.1 * | 31.4% ± 6.3 * |
| 500 nM 2 | 40.2% ± 1.3 | 26.0% ± 1.6 | 33.9% ± 0.7 | 1.8% ± 0.7 |
| 500 nM 2 + 500 nM lovastatin | 55.0% ± 1.0 * | 27.0% ± 5.2 | 18.0% ± 14.8 | 30.3% ± 3.4 * |
Statistical significance was determined between the FTI/lovastatin treated cultures and the DMSO controls. Significance was set at p<0.05.
Table 2. ST88-14 cell cycle analysis.
ST88-14 cells were treated as indicated above for 24 or 48 hours. Data represent the mean ± SD of three independent experiments.
| DNA analysis of ST88-14 MPNST cells | ||||
|---|---|---|---|---|
| G1 | G2 | S | Apoptosis | |
| 0 Hours | ||||
| Untreated | 37.7% ± 10.3 | 29.8% ± 9.1 | 32.6% ± 2.2 | 0.1% ± 0.6 |
| 24 Hours | ||||
|
| ||||
| DMSO | 51.7% ± 1.3 | 19.8% ± 1.2 | 28.6% ± 1.9 | 0.1% ± 0.0 |
| 500 nM lovastatin | 50.9% ± 2.0 | 20.5% ± 1.8 | 30.5% ± 1.8 | 0.2% ± 0.1 |
| 500 nM 1 | 51.7% ± 3.3 | 20.0% ± 1.2 | 28.4% ± 3.0 | 0.2% ± 0.1 |
| 500 nM 1 + 500 nM lovastatin | 58.7% ± 1.6 * | 19.0% ± 1.5 | 22.4% ± 3.1 * | 0.2% ± 0.1 |
| 500 nM 2 | 49.5% ± 1.8 | 20.0% ± 0.7 | 30.6% ± 1.3 | 0.1% ± 0.1 |
| 500 nM 2 + 500 nM lovastatin | 60.0% ± 0.9 * | 19.2% ± 2.4 | 22.8% ± 2.6 * | 0.2% ± 0.0 |
| 48 Hours | ||||
|
| ||||
| DMSO | 60.9% ± 5.8 | 13.1% ± 1.8 | 26.0% ± 4.4 | 0.4% ± 0.2 |
| 500 nM lovastatin | 56.7% ± 5.6 | 13.8% ± 1.6 | 29.5% ± 4.3 | 0.6% ± 0.4 |
| 500 nM 1 | 59.2% ± 3.2 | 15.2% ± 2.1 | 25.6% ± 3.0 | 0.5% ± 0.5 |
| 500 nM 1 + 500 nM lovastatin | 77.2% ± 3.0 | 13.1% ± 2.1 | 9.7% ± 3.0 * | 8.9% ± 5.2 * |
| 500 nM 2 | 57.0% ± 2.7 | 14.3% ± 1.2 | 28.8% ± 2.0 | 0.7% ± 0.5 |
| 500 nM 2 + 500 nM lovastatin | 74.7% ± 1.6 | 11.5% ± 0.5 | 13.9% ± 1.3 * | 5.7% ± 1.7 * |
Statistical significance was determined between the FTI/lovastatin treated cultures and the DMSO controls. Significance was set at p<0.05.
One mechanism that could underlie a G1 arrest would be if retinoblastoma protein (pRb) phosphorylation were reduced. We therefore investigated the phosphorylation pattern of pRb in the NF90-8 and ST88-14 cell lines (Fig. 5). Single treatments of 1 μM 1, 2, or lovastatin did not reduce hyperphosphorylation of pRb. However, combining 1 μM 1 or 2 with 1 μM lovastatin significantly reduced the phosphorylated pRb signal. Total pRb expression was also reduced in 1 or 2 plus lovastatin treated cultures. As a further control for these experiments, we also tested the inactive control compound 4. No effect on pRb phosphorylation was observed in either cell line following treatment with 1 μM 4 alone or in combination with 1 μM lovastatin (Fig. 5).
Figure 5. Reduction of pRb hyperphosphorylation in MPNST cells lines by FTI/lovastatin combination treatment.
ST88-14 and NF90-8 MPNST cultures were treated as indicated for 48 hours. Whole cell lysates were probed for pRb phosphorylated at serine 780 by western analysis. Blots were stripped and reprobed for total pRb and β-tubulin. Clear reduction of pRb phosphorylation was observed following treatment with FTI plus lovastatin. * Represents hyperphosphorylated pRb.
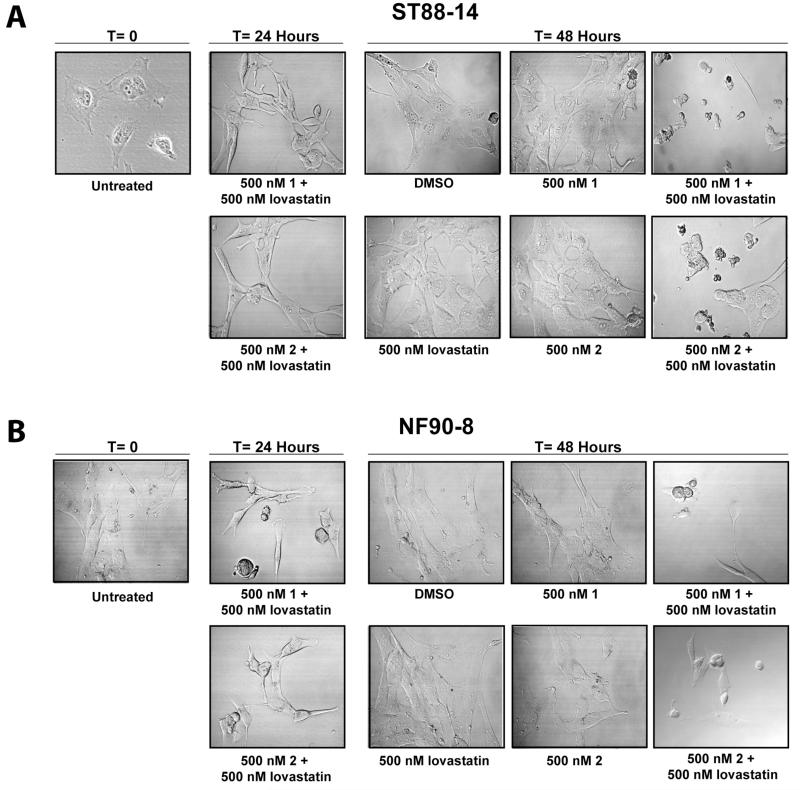
In addition to cell cycle arrest, FTI/lovastatin treatment induced an increase in the number of cells with sub-G1 DNA content, which would be consistent with an induction of apoptosis. Fig. 6A-B is a morphological analysis of both cell lines treated with 500 nM 1 or 2 with 500 nM lovastatin. NF90-8 and ST88-14 cells treated singularly with 1, 2, or lovastatin at T=24 and T=48 have a flat, elongated morphology associated with healthy, proliferating cells. However, following 24 hours of 500 nM 1 or 2 with 500 nM lovastatin combination treatments, both cell lines became more refractile. By 48 hours of treatment, cells were shrunken, rounded, and blebbed.
Figure 6. Morphological analysis of NF90-8 and ST88-14 cells following FTI/lovastatin combination treatment.
(A) ST88-4 and (B) NF90-8 cells were treated as indicated at T = 0 and Differential Interference Contrast (DIC) images were captured at the 0, 24, and 48 hours time points.
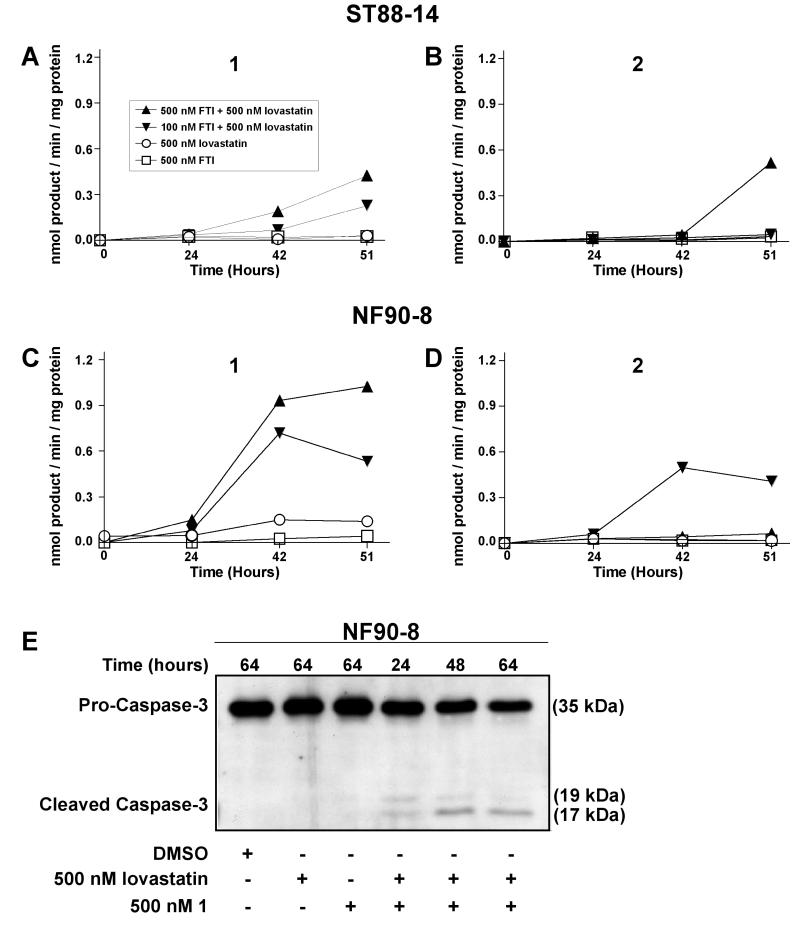
The morphological characteristics of FTI/lovastatin treated MPNSTs, coupled with increased numbers of cells with sub-G1 DNA contents, suggested the occurrence of apoptosis. To monitor for apoptosis, we used Ac-DEVD-AMC to assay for the activity of caspases-3 and -7 (Fig. 7) (Caruso et al., 2004). Treatment with 500 nM 1, or 2, or lovastatin resulted in no detectable activation of DEVDase. However, high amounts of active DEVDase were observed in NF90-8 cells (Fig. 7C-D), and moderate amounts in ST88-14 (Fig. 7A-B) cells, following treatment with 500 nM 1 or 2 and 500 nM lovastatin. In addition, 100 nM 1 with 500 nM lovastatin also activated DEVDase in NF90-8 cells. NF90-8 cells treated with 500 nM 1 plus 500 nM lovastatin also exhibited a time-dependent increase of cleaved pro-caspase-3 (Fig. 7E). The kinetics of procaspase-3 cleavage correlated with the time-dependent increases in DEVDase (Fig. 7C).
Figure 7. Increased DEVDase activity following FTI/lovastatin combination treatment.
(A-B) ST88-14 and (C-D) NF90-8 MPNST cells were treated as indicated in the figure. Increased DEVDase activity was observed in FTI/lovastatin combination treated samples. Data represent means of three samples, and are representative of two independent experiments. E, NF90-8 cells were treated as indicated in the figure. Attached and detached cells were collected together and whole cell lysates were separated for western analysis. Pro-caspase-3 cleavage occurred in a time-dependent manner in FTI/lovastatin combination treated cultures.
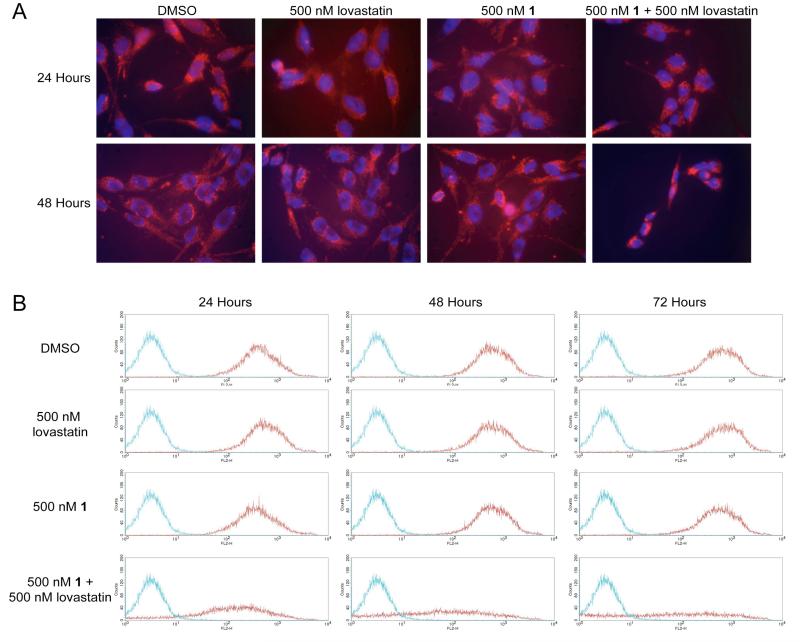
Changes in mitochondrial membrane potential (Δψm) often precede/accompany the activation of pro-caspases, and are generally indicative of an activation of the intrinsic apoptotic pathway (REF). We employed two methods to monitor Δψm. The first method involved live cell microscopy using Mitotracker Orange (Fig. 8A). NF90-8 cells treated with DMSO, 500 nM 1, or 500 nM lovastatin exhibited tubular mitochondrial staining at 24 and 48 hours with little to no detectable chromatin condensation. However, following 24 hours of combination treatment with 500 nM 1 and 500 nM lovastatin, the cells exhibited less red fluorescence. Within 48 hours of treatment, both the cells and nuclei had shrunken, and there were dramatic reductions in red fluorescence (i.e., reduced Δψm).
Figure 8.
A, NF90-8 cells were treated as indicated in the figure for 24 and 48 hours. Treated cultures were incubated with 50 nM Mitotracker Orange CM-H2 TM Ros and Hoëchst 33342 to monitor Δψm and nuclear morphology, respectively. Cultures treated with 500 nM 1 in combination with 500 nM lovastatin have reduced Δψm at 48 hours coinciding with chromatin condensation, as compared to the control cultures. B, NF90-8 cells were treated as indicated in the figure for 24, 48, and 72 hours and Δψm was observed using JC-1 by flow cytometry. Histograms represent 2×10⁴ events collected using the FL2-H channel. The red data points denote NF90-8 cells stained with JC-1, and the blue data points denote untreated NF90-8 cells not stained with JC-1. NF90-8 cultures treated with DMSO, 500 nM 1, or 500 nM lovastatin maintained Δψm as shown by the presence of red emission from 24 to 72 hours. However, 500 nM 1 in combination with 500 nM lovastatin resulted in a loss of Δψm.
Flow cytometric analysis of Δψm with JC-1 was employed to quantify mitochondrial membrane potential (Fig. 8B). NF90-8 cells were treated with drugs, and then incubated with JC-1, a compound that forms red fluorescent aggregates in cells having Δψm. Following a loss of Δψm, JC-1 does not aggregate and fluoresce red. As observed with Mitotracker Orange, treatment with DMSO, 500 nM lovastatin, or 500 nM 1 did not affect Δψm in NF90-8 cells. However, following FTI/lovastatin combination treatment, a progressive loss of Δψm occurred from 24 to 72 hours. Notably, a significant loss of Δψm occurred at 24 hours, a time that precedes the activation of DEVDase (Fig. 7C) and pro-caspase-3 cleavage (Fig. 7E).
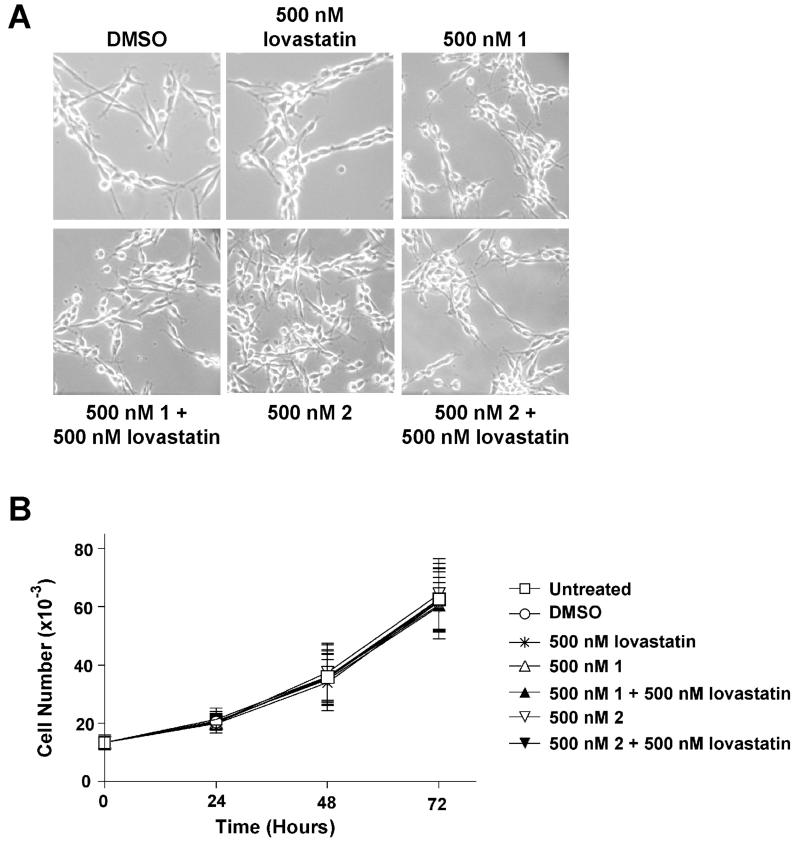
We have demonstrated that treatment of human MPNST cell lines NF90-8 and ST88-14 with 500 nM 1 or 2 in combination with 500 nM lovastatin greatly reduced cell proliferation and induced an apoptotic response. We tested the effects of this FTI/lovastatin treatment on normal primary Schwann cells isolated from the sciatic nerve of rat pups. Normal primary rat Schwann cells were treated for 72 hours, and DIC images were recorded (Fig. 9A). Once again, single treatments of DMSO, 500 nM 1 or 2, or 500 nM lovastatin had no detectable toxicity. However, in a stark contrast to the effect on MPNST cells, combination treatments of 500 nM 1 or 2 with 500 nM lovastatin had no observable toxicity on normal primary Schwann cells. To further examine whether the FTI/lovastatin treatment would be toxic, we tested our compounds on a spontaneously immortal rat Schwann cell clone (iSC) (Bolin et al., 1992). Single treatments of 500 nM 1, or 2, or lovastatin had no effect on proliferation (Fig. 9B). Combination treatments of 500 nM 1 or 2 with 500 nM lovastatin also did not significantly reduce proliferation of iSC cells.
Figure 9. Lack of FTI/lovastatin cytotoxicity in normal rat Schwann cells.
A, Primary normal rat Schwann cells were treated as indicated and observed every 24 hours post treatment. These data represent the 72-hour time point and show a lack of observable cytotoxicity. B, iSC cells were treated as indicated. Samples were collected as shown and total cell number was analyzed. All treatments lacked the ability to reduce the proliferation of immortalized normal Rat Schwann cells. Data represent the mean ± SD of three independent experiments.
Discussion
NF1 is a disease driven by the functional loss of Nf, a Ras-GAP protein (DeClue et al., 1991). The loss of Nf results in aberrant Ras signaling in cells derived from the neural crest. Ras must localize and attach to membranes where the protein functions and signals downstream. This membrane attachment requires numerous posttranslational modifications. The initial step is the covalent addition of a 15C farnesyl or a 20C geranylgeranyl group to the cysteine located on the C-Terminal “CaaX” box (Gibbs et al., 2001). This modification is critical for proper Ras function and has been investigated as a potential target for treating NF1 MPNST cells.
We used novel farnesyl transferase inhibitors, 1 and 2, to reduce protein prenylation in MPNST cell lines NF90-8 and ST88-14. FTI 1 and 2 are FPP (Farnesyl diphosphate) based FTase inhibitors. To augment the inhibition of FTase, we co-treated the MPNST cell lines with lovastatin. Lovastatin is an inhibitor of hydroxymethylglutaryl coenzyme A reductase (HMG-CoA reductase), the rate limiting enzyme in cholesterol synthesis (Wong et al., 2002). In addition to blocking cholesterol synthesis, HMG-CoA reductase is responsible for the initial steps of FPP and GGPP (Geranylgeranyl diphosphate) synthesis (Morgan et al., 2003). Other labs have shown that micromolar doses of lovastatin reduce Ras prenylation and increase the recovery of the protein in cytosolic fractions (Mendola and Backer, 1990; Sebti et al., 1991; Rubins et al., 1998). In addition, lovastatin reverted the learning disabilities of Nf +/− mice (Li et al., 2005). Recently, a clinical trial was opened to evaluate the safety of lovastatin in adults with NF1 (NCT00352599). In the current study, we used pharmacologically achievable (Thibault et al., 1996) nanomolar doses of lovastatin, which alone had no effect on NF90-8 and ST88-14 MPNST cell line proliferation, but showed synergy when used in combination with novel FTIs, 1 and 2.
Our lab previously described N-Ras as the predominant active Ras isoform expressed in human-derived MPNST cell lines NF90-8 and ST88-14 (Mattingly et al., 2006). N-Ras is a member of a group of proteins that can undergo two types of prenylation, either farnesylation or geranylgeranylation. This characteristic could allow an escape mechanism in which N-Ras could be alternatively prenylated with a geranylgeranyl pyrophosphate to maintain proper N-Ras localization and function in the presence of FTIs (Whyte et al., 1997). Indeed, NF1 −/− hematopoietic cells confer a myeloproliferative disorder that is resistant to FTI L-744,832 treatment. This resistance occurs despite block of H-Ras prenylation, and is proposed to be due to lack of efficacy against N-Ras and for K-Ras (Mahgoub et al., 1999). Since N-Ras is commonly over expressed or mutated in cancer, designing a therapy that can reduce farnesylation and geranylgeranylation of N-Ras may be a logical approach.
Our data show that Ras prenylation was maintained following single treatments of 1, 2, or lovastatin in both MPNST cell lines. It is possible that these agents singularly inhibited FTase and reduced farnesylation. However, N-Ras may have undergone a compensatory alternative geranylgeranylation. Combination treatment with 1 or 2 with lovastatin induced a near complete inhibition of Ras prenylation in NF90-8 cells, and a moderate inhibition in ST88-14 cells. The combination treatment may have provided a more effective inhibition of FTase, but it could also be that lovastatin may have reduced GGPP pools in the cell, and so impaired alternate prenylation of Ras (Morgan et al., 2005).
Combination treatment of 1 or 2 with lovastatin impaired Ras prenylation in both NF1 MPNST cell lines, but to different degrees. The degree to which Ras prenylation was suppressed correlated with the anti-proliferative and pro-apoptotic effects of the combination treatment. Although inhibition of Ras prenylation correlated strongly with cellular response, Ras is not the exclusive target protein for FTIs (Lebowitz et al., 1997; Ashar et al., 2000; Basso et al., 2005; Clark et al., 2007). Approximately 0.5% of proteins in the cell must undergo prenylation in order to function properly (Epstein et al., 1991). Known farnesylated proteins include the Ras proteins, RhoB, Rheb, CENP-E, CENP-F, and the nuclear lamins (Tamanoi et al., 2001). The large list of potential FTI targets increases the difficulty in identifying the true therapeutic target, and which diseases would respond to an FTI-based therapy. Nevertheless, since Ras activation drives the NF1 phenotype, inhibition of Ras prenylation is likely to contribute to the efficacy of the combinatorial drug treatment.
Combination FTI/lovastatin induced G1 arrest, coinciding with reduced pRb phosphorylation at 48 hours. Total pRb content was also reduced in combination treated cultures. Since pRb is a substrate for caspase-3 and -7 (Fattman et al., 1997; Fattman et al., 2001), and combination treatment resulted in the activation of procaspase-3 and -7, it is possible that pRb was cleaved by active caspases and degraded. This reduction of total pRb may also have contributed to reduced pRb phosphorylation and the observed G1 arrest. Induction of G1 arrest by prenylation inhibitors that include a lactone structure may be through a p21-dependent mechanism that includes inhibition of the proteosome (Efuet and Keyomarsi, 2006). The active compounds in the current study, however, do not contain a lactone moiety. They also induce a G1 arrest in STS-26T cells (Clark et al., 2007), which do not express p21 protein (Mattingly et al., 2006).
Theoretically, toxicity to normal cells could be a concern following FTI treatment due to the large number of proteins that are prenylated. FTIs in combination with lovastatin may increase the number of proteins with impaired prenylation. However, we found a lack of detectable cytotoxicity in normal or immortalized rat Schwann cells following combined treatment. It is conceivable that the target protein of our FTIs responsible for the observed effects in the MPNST cell lines is not necessary for normal Schwann cell survival or proliferation.
NF1 MPNST cell lines have increased active Ras compared to non-NF1 cell lines. This makes Ras a rational therapeutic target for this disease. Ongoing clinical trials include one regarding lovastatin tolerance in adults with NF1 (NCT00352599), and the use of the peptide-competitive FTI tipifarnib on treating NF1 in children [(Widemann et al., 2006) and NCT00029354]. The novel FTIs described in this study are extremely effective against NF1 MPNST cell lines with a lack of toxicity against normal Schwann cells. We propose that a combination of FTI/statin treatment may be more efficacious in treatment of NF1 MPNSTs.
Supplementary Material
Acknowledgments
We thank Dr. T. Glover for providing MPNST cell lines, Dr. E.M. Shooter for the immortalized Schwann cells, and B. Bealmear in Dr. R. Lisak’s laboratory for preparation of primary Schwann cells. We thank P. Mathieu for technical assistance and advice, and Kim Zukowski for assistance with flow cytometry.
This work was supported by grants DAMD17-03-1-0182 and W81XWH-05-1-0193 from the Department of the Army. JWW and MDK were supported by T32 ES012163 from the NIH. This project was aided by Imaging and Cytometry Core facilities that were supported by P30 ES06639 and P30 CA22453 from the NIH.
Abbreviations
- NF1
Neurofibromatosis Type 1
- Nf1
neurofibromin
- BPNST
benign peripheral nerve sheath tumor
- MPNST
malignant peripheral nerve sheath tumor
- iSC
spontaneously immortal rat Schwann cell clone
- FTase
farnesyl transferase
- FTI
farnesyl transferase inhibitor
- FACS
fluorescence activated cell sorting
- GAP
GTPase activating protein
- FPP
farnesyl diphosphate
- GGPP
geranylgeranyl diphosphate
- Rce1
Ras converting enzyme 1
- ICMT
Isoprenylcysteine carboxyl methyltransferase
- JC-1
5,5′,6,6′-tetrachloro-1,1′,3,3′-tetraethylbenzimidazolylcarbocyanine iodide
- AMC
7-amino-4-methylcoumarin
- Δψm
mitochondrial membrane potential
References
- Arun D, Gutmann DH. Recent advances in neurofibromatosis type 1. Curr Opin Neurol. 2004;17:101–105. doi: 10.1097/00019052-200404000-00004. [DOI] [PubMed] [Google Scholar]
- Ashar HR, James L, Gray K, Carr D, Black S, Armstrong L, Bishop WR, Kirschmeier P. Farnesyl transferase inhibitors block the farnesylation of CENP-E and CENP-F and alter the association of CENP-E with the microtubules. J Biol Chem. 2000;275:30451–30457. doi: 10.1074/jbc.M003469200. [DOI] [PubMed] [Google Scholar]
- Basso AD, Kirschmeier P, Bishop WR. Lipid posttranslational modifications. Farnesyl transferase inhibitors. J Lipid Res. 2006;47:15–31. doi: 10.1194/jlr.R500012-JLR200. [DOI] [PubMed] [Google Scholar]
- Basso AD, Mirza A, Liu G, Long BJ, Bishop WR, Kirschmeier P. The farnesyl transferase inhibitor (FTI) SCH66336 (lonafarnib) inhibits Rheb farnesylation and mTOR signaling. Role in FTI enhancement of taxane and tamoxifen anti-tumor activity. J Biol Chem. 2005;280:31101–31108. doi: 10.1074/jbc.M503763200. [DOI] [PubMed] [Google Scholar]
- Basu TN, Gutmann DH, Fletcher JA, Glover TW, Collins FS, Downward J. Aberrant regulation of ras proteins in malignant tumour cells from type 1 neurofibromatosis patients. Nature. 1992;356:713–715. doi: 10.1038/356713a0. [DOI] [PubMed] [Google Scholar]
- Bolin LM, Iismaa TP, Shooter EM. Isolation of activated adult Schwann cells and a spontaneously immortal Schwann cell clone. J Neurosci Res. 1992;33:231–238. doi: 10.1002/jnr.490330206. [DOI] [PubMed] [Google Scholar]
- Caruso JA, Mathieu PA, Joiakim A, Leeson B, Kessel D, Sloane BF, Reiners JJ., Jr. Differential susceptibilities of murine hepatoma 1c1c7 and Tao cells to the lysosomal photosensitizer NPe6: influence of aryl hydrocarbon receptor on lysosomal fragility and protease contents. Mol Pharmacol. 2004;65:1016–1028. doi: 10.1124/mol.65.4.1016. [DOI] [PubMed] [Google Scholar]
- Chadee DN, Kyriakis JM. A novel role for mixed lineage kinase 3 (MLK3) in B-Raf activation and cell proliferation. Cell Cycle. 2004;3:1227–1229. doi: 10.4161/cc.3.10.1187. [DOI] [PubMed] [Google Scholar]
- Clark MK, Scott SA, Wojtkowiak J, Chirco R, Mathieu P, Reiners JJ, Jr., Mattingly RR, Borch RF, Gibbs RA. Synthesis, biochemical, and cellular evaluation of farnesyl monophosphate prodrugs as farnesyltransferase inhibitors. J Med Chem. 2007;50:3274–3282. doi: 10.1021/jm0701829. [DOI] [PubMed] [Google Scholar]
- DeClue JE, Cohen BD, Lowy DR. Identification and characterization of the neurofibromatosis type 1 protein product. Proc Natl Acad Sci U S A. 1991;88:9914–9918. doi: 10.1073/pnas.88.22.9914. [DOI] [PMC free article] [PubMed] [Google Scholar]
- Dilworth JT, Kraniak JM, Wojtkowiak JW, Gibbs RA, Borch RF, Tainsky MA, Reiners JJ, Jr., Mattingly RR. Molecular targets for emerging anti-tumor therapies for neurofibromatosis type 1. Biochem Pharmacol. 2006;72:1485–1492. doi: 10.1016/j.bcp.2006.04.010. [DOI] [PubMed] [Google Scholar]
- Eccleston JF, Moore KJ, Morgan L, Skinner RH, Lowe PN. Kinetics of interaction between normal and proline 12 Ras and the GTPase-activating proteins, p120-GAP and neurofibromin. The significance of the intrinsic GTPase rate in determining the transforming ability of ras. J Biol Chem. 1993;268:27012–27019. [PubMed] [Google Scholar]
- Efuet ET, Keyomarsi K. Farnesyl and geranylgeranyl transferase inhibitors induce G1 arrest by targeting the proteasome. Cancer Res. 2006;66:1040–1051. doi: 10.1158/0008-5472.CAN-05-3416. [DOI] [PubMed] [Google Scholar]
- Epstein WW, Lever D, Leining LM, Bruenger E, Rilling HC. Quantitation of prenylcysteines by a selective cleavage reaction. Proc Natl Acad Sci U S A. 1991;88:9668–9670. doi: 10.1073/pnas.88.21.9668. [DOI] [PMC free article] [PubMed] [Google Scholar]
- Fattman CL, An B, Dou QP. Characterization of interior cleavage of retinoblastoma protein in apoptosis. J Cell Biochem. 1997;67:399–408. [PubMed] [Google Scholar]
- Fattman CL, Delach SM, Dou QP, Johnson DE. Sequential two-step cleavage of the retinoblastoma protein by caspase-3/-7 during etoposide-induced apoptosis. Oncogene. 2001;20:2918–2926. doi: 10.1038/sj.onc.1204414. [DOI] [PubMed] [Google Scholar]
- Feldkamp MM, Angelov L, Guha A. Neurofibromatosis type 1 peripheral nerve tumors: aberrant activation of the Ras pathway. Surg Neurol. 1999;51:211–218. doi: 10.1016/s0090-3019(97)00356-x. [DOI] [PubMed] [Google Scholar]
- Gibbs RA, Zahn TJ, Sebolt-Leopold JS. Non-peptidic prenyltransferase inhibitors: diverse structural classes and surprising anti-cancer mechanisms. Curr Med Chem. 2001;8:1437–1465. doi: 10.2174/0929867013372111. [DOI] [PubMed] [Google Scholar]
- Kim HA, Ling B, Ratner N. Nf1-deficient mouse Schwann cells are angiogenic and invasive and can be induced to hyperproliferate: reversion of some phenotypes by an inhibitor of farnesyl protein transferase. Mol Cell Biol. 1997;17:862–872. doi: 10.1128/mcb.17.2.862. [DOI] [PMC free article] [PubMed] [Google Scholar]
- Lebowitz PF, Casey PJ, Prendergast GC, Thissen JA. Farnesyltransferase inhibitors alter the prenylation and growth-stimulating function of RhoB. J Biol Chem. 1997;272:15591–15594. [Google Scholar]
- Li W, Cui Y, Kushner SA, Brown RA, Jentsch JD, Frankland PW, Cannon TD, Silva AJ. The HMG-CoA reductase inhibitor lovastatin reverses the learning and attention deficits in a mouse model of neurofibromatosis type 1. Curr Biol. 2005;15:1961–1967. doi: 10.1016/j.cub.2005.09.043. [DOI] [PubMed] [Google Scholar]
- Lynch TM, Gutmann DH. Neurofibromatosis 1. Neurol Clin. 2002;20:841–865. doi: 10.1016/s0733-8619(01)00019-6. [DOI] [PubMed] [Google Scholar]
- Mahgoub N, Taylor BR, Gratiot M, Kohl NE, Gibbs JB, Jacks T, Shannon KM. In vitro and in vivo effects of a farnesyltransferase inhibitor on Nf1-deficient hematopoietic cells. Blood. 1999;94:2469–2476. [PubMed] [Google Scholar]
- Mattingly RR, Gibbs RA, Menard RE, Reiners JJ., Jr. Potent suppression of proliferation of a10 vascular smooth muscle cells by combined treatment with lovastatin and 3-allylfarnesol, an inhibitor of protein farnesyltransferase. J Pharmacol Exp Ther. 2002;303:74–81. doi: 10.1124/jpet.102.036061. [DOI] [PubMed] [Google Scholar]
- Mattingly RR, Kraniak JM, Dilworth JT, Mathieu P, Bealmear B, Nowak JE, Benjamins JA, Tainsky MA, Reiners JJ., Jr. The mitogen-activated protein kinase/extracellular signal-regulated kinase kinase inhibitor PD184352 (CI-1040) selectively induces apoptosis in malignant schwannoma cell lines. J Pharmacol Exp Ther. 2006;316:456–465. doi: 10.1124/jpet.105.091454. [DOI] [PubMed] [Google Scholar]
- Mattingly RR, Milstein ML, Mirkin BL. Down-regulation of growth factor-stimulated MAP kinase signaling in cytotoxic drug-resistant human neuroblastoma cells. Cell Signal. 2001;13:499–505. doi: 10.1016/s0898-6568(01)00173-5. [DOI] [PubMed] [Google Scholar]
- Menard RE, Jovanovski AP, Mattingly RR. Active p21-activated kinase 1 rescues MCF10A breast epithelial cells from undergoing anoikis. Neoplasia. 2005;7:638–645. doi: 10.1593/neo.04736. [DOI] [PMC free article] [PubMed] [Google Scholar]
- Mendola CE, Backer JM. Lovastatin blocks N-ras oncogene-induced neuronal differentiation. Cell Growth Differ. 1990;1:499–502. [PubMed] [Google Scholar]
- Morgan MA, Ganser A, Reuter CW. Therapeutic efficacy of prenylation inhibitors in the treatment of myeloid leukemia. Leukemia. 2003;17:1482–1498. doi: 10.1038/sj.leu.2403024. [DOI] [PubMed] [Google Scholar]
- Morgan MA, Sebil T, Aydilek E, Peest D, Ganser A, Reuter CW. Combining prenylation inhibitors causes synergistic cytotoxicity, apoptosis and disruption of RAS-to-MAP kinase signalling in multiple myeloma cells. Br J Haematol. 2005;130:912–925. doi: 10.1111/j.1365-2141.2005.05696.x. [DOI] [PubMed] [Google Scholar]
- Packer RJ, Gutmann DH, Rubenstein A, Viskochil D, Zimmerman RA, Vezina G, Small J, Korf B. Plexiform neurofibromas in NF1: toward biologic-based therapy. Neurology. 2002;58:1461–1470. doi: 10.1212/wnl.58.10.1461. [DOI] [PubMed] [Google Scholar]
- Rajalingam K, Schreck R, Rapp UR, Albert S. Ras oncogenes and their downstream targets. Biochim Biophys Acta. 2007;1773:1177–1195. doi: 10.1016/j.bbamcr.2007.01.012. [DOI] [PubMed] [Google Scholar]
- Reiners JJ, Jr., Clift R, Mathieu P. Suppression of cell cycle progression by flavonoids: dependence on the aryl hydrocarbon receptor. Carcinogenesis. 1999;20:1561–1566. doi: 10.1093/carcin/20.8.1561. [DOI] [PubMed] [Google Scholar]
- Roth TM, Ramamurthy P, Ebisu F, Lisak RP, Bealmear BM, Barald KF. A mouse embryonic stem cell model of Schwann cell differentiation for studies of the role of neurofibromatosis type 1 in Schwann cell development and tumor formation. Glia. 2007;55:1123–1133. doi: 10.1002/glia.20534. [DOI] [PubMed] [Google Scholar]
- Rubins JB, Greatens T, Kratzke RA, Tan AT, Polunovsky VA, Bitterman P. Lovastatin induces apoptosis in malignant mesothelioma cells. Am J Respir Crit Care Med. 1998;157:1616–1622. doi: 10.1164/ajrccm.157.5.9709020. [DOI] [PubMed] [Google Scholar]
- Sebti SM, Tkalcevic GT, Jani JP. Lovastatin, a cholesterol biosynthesis inhibitor, inhibits the growth of human H-ras oncogene transformed cells in nude mice. Cancer Commun. 1991;3:141–147. doi: 10.3727/095535491820873371. [DOI] [PubMed] [Google Scholar]
- Skoff AM, Lisak RP, Bealmear B, Benjamins JA. TNF-alpha and TGF-beta act synergistically to kill Schwann cells. J Neurosci Res. 1998;53:747–756. doi: 10.1002/(SICI)1097-4547(19980915)53:6<747::AID-JNR12>3.0.CO;2-V. [DOI] [PubMed] [Google Scholar]
- Tamanoi F, Kato-Stankiewicz J, Jiang C, Machado I, Thapar N. Farnesylated proteins and cell cycle progression. J Cell Biochem Suppl. 2001;(Suppl 37):64–70. doi: 10.1002/jcb.10067. [DOI] [PubMed] [Google Scholar]
- Tang Y, Marwaha S, Rutkowski JL, Tennekoon GI, Phillips PC, Field J. A role for Pak protein kinases in Schwann cell transformation. Proc Natl Acad Sci U S A. 1998;95:5139–5144. doi: 10.1073/pnas.95.9.5139. [DOI] [PMC free article] [PubMed] [Google Scholar]
- Thibault A, Samid D, Tompkins AC, Figg WD, Cooper MR, Hohl RJ, Trepel J, Liang B, Patronas N, Venzon DJ, Reed E, Myers CE. Phase I study of lovastatin, an inhibitor of the mevalonate pathway, in patients with cancer. Clin Cancer Res. 1996;2:483–491. [PubMed] [Google Scholar]
- Ward BA, Gutmann DH. Neurofibromatosis 1: from lab bench to clinic. Pediatr Neurol. 2005;32:221–228. doi: 10.1016/j.pediatrneurol.2004.11.002. [DOI] [PubMed] [Google Scholar]
- Whyte DB, Kirschmeier P, Hockenberry TN, Nunez-Oliva I, James L, Catino JJ, Bishop WR, Pai JK. K- and N-Ras are geranylgeranylated in cells treated with farnesyl protein transferase inhibitors. J Biol Chem. 1997;272:14459–14464. doi: 10.1074/jbc.272.22.14459. [DOI] [PubMed] [Google Scholar]
- Widemann BC, Salzer WL, Arceci RJ, Blaney SM, Fox E, End D, Gillespie A, Whitcomb P, Palumbo JS, Pitney A, Jayaprakash N, Zannikos P, Balis FM. Phase I trial and pharmacokinetic study of the farnesyltransferase inhibitor tipifarnib in children with refractory solid tumors or neurofibromatosis type I and plexiform neurofibromas. J Clin Oncol. 2006;24:507–516. doi: 10.1200/JCO.2005.03.8638. [DOI] [PubMed] [Google Scholar]
- Wong WW, Dimitroulakos J, Minden MD, Penn LZ. HMG-CoA reductase inhibitors and the malignant cell: the statin family of drugs as triggers of tumor-specific apoptosis. Leukemia. 2002;16:508–519. doi: 10.1038/sj.leu.2402476. [DOI] [PubMed] [Google Scholar]
- Yan N, Ricca C, Fletcher J, Glover T, Seizinger BR, Manne V. Farnesyltransferase inhibitors block the neurofibromatosis type I (NF1) malignant phenotype. Cancer Res. 1995;55:3569–3575. [PubMed] [Google Scholar]
Associated Data
This section collects any data citations, data availability statements, or supplementary materials included in this article.


