Abstract
Objective
Changing lipofuscin and melanin content in RPE cells has been hypothesized to contribute to Stargardt disease pathogenesis. Longitudinal study of autofluorescence in Stargardt disease which reflect changing fluorophore compositions can reveal aspects of disease progression not previously evident.
Method
We examined the temporal-spatial patterns of fundus autofluorescence with excitation at both 488 nm (standard fundus autofluorescence, FAF) and 795nm (near infrared autofluorescence, NIA) in a longitudinal case series involving 8 eyes of 4 patients (range of follow-up = 11 to 57 months; mean = 39 months). Image processing was performed to analyze spatial and temporal cross-modality associations.
Results
Longitudinal FAF imaging of fleck lesions revealed hyperautofluorescent lesions that extended in a centrifugal direction from the fovea with time. Patterns of spread were non-random and followed a radial path that leaves behind a trail of diminishing autofluorescence. Longitudinal NIA imaging also demonstrated centrifugal lesion spread, but with fewer hyperautofluorescent lesions, suggestive of more transient hyperautofluorescence and more rapid decay at longer wavelengths. FAF and NIA abnormalities were spatially correlated to each other, and together reflect systematic progressions in fleck distribution and fluorophore composition occurring during the natural history of the disease.
Conclusion
Stargardt disease fleck lesions do not evolve randomly in location but instead follow consistent patterns of radial expansion and a systematic decay of autofluorescence that reflect changing lipofuscin and melanin compositions in RPE cells. These progressive foveal-to-peripheral changes are helpful in elucidating molecular and cellular mechanisms underlying Stargardt disease and may constitute potential outcome measures in clinical trials.
INTRODUCTION
Clinical hallmarks of Stargardt include the accumulation of yellow “flecks” in the retina in the earlier phase1 and the onset of central retinal and RPE atrophy and central vision loss in the later phase2. Histopathological studies indicate that Stargardt disease-related fleck lesions are composed mainly of lipofuscin3–5, a by-product of the visual cycle which consists of multiple fluorophores, including A2E6. The accumulation of lipofuscin in the retina occurs normally with aging7, but demonstrates an accelerated course in certain retinal diseases, such as Stargardt disease8.
The identification of ABCA4 as a causative gene for Stargardt disease9 has led to the appreciation that a lack of ABCA4 function results in the accumulation of lipofuscin and related compounds such as A2E10 in photoreceptors and ultimately in RPE cells11. How lipofuscin, A2E and other bisretinoid adducts accumulation subsequently leads to RPE and photoreceptor cell death in Stargardt disease is currently being investigated. While these pathways are not completely elucidated, research has demonstrated that lipofuscin-related compounds can act as photosensitizers, increasing the production of reactive oxygen species 12, 13, that through the chemical modification of proteins and DNA, could induce RPE cell death.
The accumulation of lipofuscin in the RPE cell may also detrimentally alter the composition and distribution of other intracellular components such as melanin. Melanin, a compound important in RPE homeostasis 7 and present intracellularly as melanin granules, is concentrated in RPE cells at the fovea, where RPE cell height is increased and more melanin granules per RPE cell are found14. With aging, melanin, unlike lipofuscin, decreases in the RPE; melanin granules in RPE cells decrease in number as those containing lipofuscin accumulate7. These trends have led to the hypothesis that melanin in RPE cells may regulate lipofuscin accumulation and/or the photooxidation of lipofuscin-related compounds8, 15. How these melanin-lipofuscin interactions figure in the accelerated course of lipofuscin accumulation in Stargardt disease has not been fully explored.
The fluorescent properties of both lipofuscin and melanin enable them to be quantified in the eye non-invasively by in vivo autofluoresence imaging. Delori et al., described a detailed method for measuring lipofuscin in the human fundus in vivo 16. This method was used to demonstrate that patients with Stargardt disease display increases in fundus autofluorescence with spectral properties consistent with lipofuscin accumulation17. Other reports have also described FAF findings in Stargardt disease, reporting characteristic patterns of increased fluorescence in early disease and decreased autofluorescence in cases of central atrophy18–22. In addition to standard FAF imaging, which uses excitation wavelengths in the blue part of the visible spectrum and detects lipofuscin autofluorescence, autofluorescence imaging using longer, or near infrared wavelengths - termed near-infrared autofluorescence (NIA) imaging - likely detects ocular melanin autofluorescence14, 23. NIA imaging has also been used in imaging Stargardts’ disease 18, 24.
While it has been previously hypothesized that changing lipofuscin and melanin content in RPE cells may comprise part of the pathobiology of Stargardt disease, the longitudinal study of autofluorescence patterns in Stargardt disease, which may reveal changing patterns of lipofuscin and melanin in the fundus, has not previously been characterized. In this study, we employed both FAF and NIA autofluorescence imaging to follow the progression of fleck-like changes and central atrophy in Stargardt disease and identified a remarkable pattern of centrifugal progression of patterns of fleck creation and dissolution present in the 8 eyes of 4 patients whom we have followed over 11 months to 57 months. This progression is best appreciated when viewed as a movie. This novel observation regarding the natural history of Stargardt disease may reflect underlying retinal gradients including the distribution of cone photoreceptors, RPE cell density, intracellular melanin and macular pigment which are highest at the fovea and decrease with increasing distance from the fovea. These new observations provide features that may be useful in the development of new quantitative outcome measures in clinical trials. Additionally, the dynamic patterns of changes of FAF and NIA reflect cumulative alterations in lipofuscin and melanin content of RPE cells that can assist in elucidating intracellular processes underlying disease pathophysiology.
METHODS
Patient Selection
Eight eyes of 4 unrelated patients with a clinical diagnosis of Stargardt disease were selected as a subset of a larger study based on the presence of longitudinal fundus autofluorescence data over at least 3 time-points. Study patients were examined in the eye clinic of the Ophthalmic Genetics and Visual Function Branch at the National Eye Institute, NIH between 2004 and 2009. Informed patient consent and local institutional review board (IRB) approval were obtained for this retrospective study which was conducted in accordance with the ethical standards of the 1964 Declaration of Helsinki. The clinical diagnosis was established based on patient and family history, ophthalmoscopy, visual field testing, and/or full-field or multifocal electroretinography (mfERG) according to the guidelines of the International Society for Clinical Electrophysiology of Vision (ISCEV). Ages of the patients at first visit ranged from 9 years old to 44 years old. The results of ABCA4 genetic testing were available for 2 patients. The length of follow-up ranged from 11 to 57 months (average 39 months). The general demographic and baseline information of these patients is summarized in Table 1.
Table 1.
| Patient # | Age (years), Male(M)/Female(F) | Visual Acuity at first time-point (OD, OS) | ABCA4 gene sequencing results | Follow-up time |
|---|---|---|---|---|
| 1 | 44F | 20/30, 20/30 | Not sequenced | 36 months |
| 2 | 9F | 20/100, 20/100 | heterozygous known causative mutations in Exon 35
|
53 months |
| 3 | 36F | 20/160, 20/160 | IVS39 + 10 T>C (causative mutation) Other non-causative mutations |
57 months |
| 4 | 29F | 20/60, 20/100 | Not sequenced | 11 months |
Imaging Acquisition
Color fundus photography (CFP) was performed using a standard digital imaging system (OIS, Sacramento, California, USA). Fundus autofluorescence was imaged with a confocal laser scanning ophthalmoscope (HRA2; Heidelberg Engineering, Heidelberg, Germany) using an excitation wavelength of 488 nm and a barrier filter at 500 nm. Near infrared autofluorescence (NIA) was performed with the same instrument using an excitation wavelength of 795 nm with a band-pass filter with a cut-off at 810 nm. Images were captured at a rate of 8.8frames/second and a total of 15 images were averaged to generate the final autofluorescence image. Images with motion artifacts were excluded from the averaging process.
Longitudinal analysis of fundus images was performed by aligning consecutive images to create a movie file using a computer program (NIH ImageJ version v1.441i). Automated and manual alignment of images was performed using stationary landmarks such as the optic nerve or retinal vessels. Correlative analyses between imaging modalities were performed by importing aligned images into an image processing computer program (Photoshop CS4, version 11.0.1, Adobe, San Jose, CA) as semi-opaque images layered serially on top of each other. Images were colorized according to time-point or modality to facilitate correlation and comparison.
RESULTS
Appearance of central atrophy and pisciform flecks on autofluorescence imaging of Stargardt disease
Two main defining clinical characteristics of the disease, central atrophy and yellow subretinal pisciform flecks, typically characterized on CFP, could be correlated with features on FAF and NIA imaging. Central atrophy, seen as a circumscribed patch of depigmented RPE on CFP (Fig. 1A), corresponded to a clearly demarcated area of uniform decreased autofluorescence on FAF imaging (Fig. 1B) that was surrounded by a border of patchy, mottled hypoautofluorescence. On NIA imaging (Fig. 1C), this area of central atrophy also demonstrated decreased autofluorescence, however, the borders of this zone were not well-defined and extended beyond the area of central atrophy as visualized on CFP and FAF.
Figure 1. Appearance of central atrophy and pisciform flecks in Stargardt disease on color fundus photography and autofluoresence imaging of patient #1.
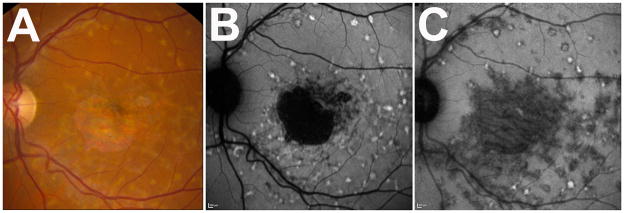
(A) Color fundus photograph (CFP) demonstrating typical yellow flecked lesions throughout macula and a central area of retinal and RPE atrophy. (B) Same fundus imaged with autofluoresence imaging with excitation at 488nm (FAF), demonstrating a defined area of sharply demarcated hypoautofluorescence, indicating an area of RPE loss Additional areas of mottled hypoautofluorescence in parafovea were observed adjacent to the central area of atrophy. Hyperautoflurorescent flecks in concentric patterns are found extending out from center macula. (C) Same fundus imaged with autofluoresence imaging with excitation at 795nm (NIA), demonstrating more diffuse and widespread abnormalities than seen on CFP or FAF. There are proportionally more hypoautofluorescent flecks than hyperautofluorescent flecks.
Pisciform flecks, typically characterized as yellow lesions on CFP, can also be visualized on both FAF and NIA imaging. On FAF, the flecks corresponded to areas where the autofluorescence signal differed from the overall background level. The majority of flecks seen on FAF had increased autofluorescence (hyperautofluorescnce) which exceeded background levels by varying degrees (Fig 1B), some of which were also surrounded by a ring of decreased autofluorescence. A minority of flecks was primarily hypoautofluorescent. Conversely, on NIA (Fig 1C), the majority of the flecks was hypoautofluorescent, with relatively few flecks appearing hyperautofluorescent. These few hyperautofluorescent flecks were sometimes surrounded by a ring of hypoautofluorescence.
These observations indicate that the clinical hallmarks of Stargardt disease were associated with abnormal autofluorescence properties that varied in intensity and extent depending on the wavelength of the illumination used. They also reveal that fleck-like lesions, appearing mostly homogeneous on CFP, may be composed of different fluorophores present at varying levels.
Natural history of central atrophy progression in Stargardt disease on autofluorescence imaging
We followed changes in the appearance of central atrophy in study eyes on autofluorescence imaging. Figure 2 displays sequential FAF images of fellow eyes from a patient with Stargardt disease with bilateral central atrophy. On sequential FAF imaging, the sharply demarcated area of central atrophy in both eyes gradually enlarged by expansion into contiguous areas. In the left eye, the emergence of a new island of atrophy was also observed (Figure 2B). New areas of atrophy appeared to emerge and extend selectively into locations demonstrating mottled hypoautofluorescence, akin to the pattern of progression of geographic atrophy in age-related macular degeneration (AMD)25. On the NIA image (Figure 2, right column), the area of hypoautofluorescence contained, but extended beyond, the borders of central atrophy as seen on CFP and FAF.
Figure 2. Longitudinal changes in fundus autofluorescence associated with macular atrophy in Stargardt disease in patient #1.
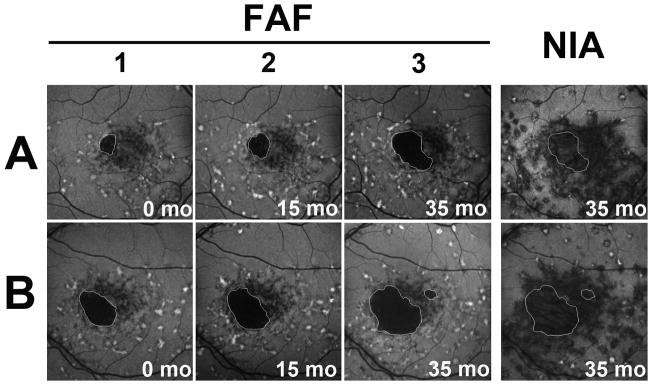
Autofluorescence imaging on FAF and NIA in the right (A) and left (B) eye of a patient with Stargardt disease. Areas of clinically evident macular atrophy have a corresponding area of markedly decreased autofluorescence on FAF imaging; atrophic regions are highlighted (white outline) and can be observed to enlarge by continguous spread with time. The areas of hypoautofluorescence on NIA were larger than the corresponding areas of clnical atrophy and extended beyond the borders of the outlined atrophic areas. Numbers (1,2,3) indicate separate time-points during follow-up.
Natural history of fleck progression on autofluorescence imaging
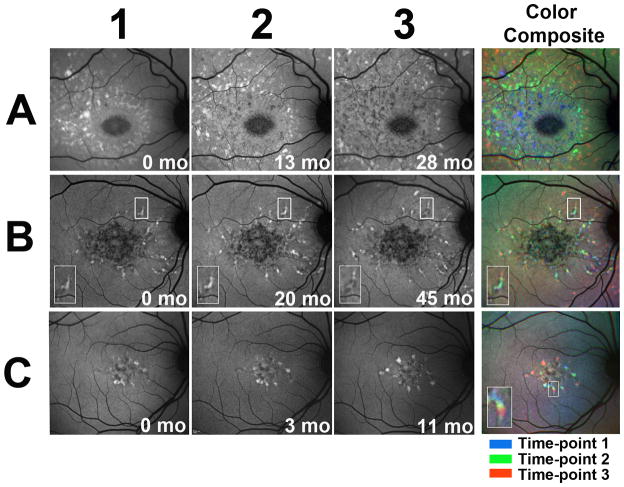
While pisciform flecks have been thought to emerge and increase in number during the natural history of Stargardt disease, the details of their progression with time have not been previously examined using autofluorescence imaging. Study eyes were imaged longitudinally using FAF imaging, and resulting images were spatially aligned to follow progressive changes in fleck distribution. Examination of all study eyes revealed a number of characteristic progression features. The number of flecks located in the macula increased radially as a function of time. In addition, fleck accumulation exhibited a pattern of centrifugal addition of new flecks beginning from the fovea and extending towards the outer edges of the macula. The extent and rate of this centrifugal extension varied considerably between patients. Figure 3A shows a study eye in which fleck distribution spread in a circular wave centered on the fovea; the superimposition of images of flecks colorized as a function of time illustrates the centrifugal step-wise extension of the wave. Figure 3B and C illustrate study eyes with fewer flecks at baseline in which the pattern of outward spread of fleck lesions proceeded at a slower rate. In these examples, the pisciform flecks extended in a radial direction following a continuous path (Fig 3B and 3C, inset). Estimates for the average rates of centrifugal extensions of flecks ranged from 14 to 58 μm per month. The dynamic nature of fleck progression can be most clearly depicted by viewing consecutive FAF images as a “movie” of sequential temporal images aligned spatially and stacked on top of each other (Supplementary movie 1, 2 and 3).
Figure 3. Longitudinal changes in fundus autofluorescence of fleck lesions in Stargardt disease captured using 488 nm excitation (FAF).
Autofluorescence images of 3 Stargardt patients (A= patient # 2, B=patient #3 and C=patient #4) with fleck lesions captured on FAF imaging. (A) Spread of hyperautofluorescent fleck lesions in a centrifugal “wave” centered on the fovea. Numbers (1,2,3) indicate separate time-points during follow-up. Color composite that superimposes all 3 images as color-coded layers (right) demonstrates the progressive outward spread. (B) Hyperautofluorescent flecks can be seen extending contiguously as trails in a center-to-peripheral direction. Insets contain magnified views of one representative fleck (box); the fleck can be observed to progress with a hyperautofluorescent leading edge, leaving behing a hypoautofluorescent trailing edge. Color composite demonstrates fleck progression. (C) A similar example of contiguous fleck progression as seen in (B). Inset in C represents a magnified view of one fleck as it extended contiguously over time (box); Color composite key: blue = time-point 1, green = time-point 2, red, time-point 3.
The natural history of fleck progression is also characterized by progressive changes on the level of FAF autofluorescent signal associated with flecks. More recently emerged “newer” flecks appear hyperautofluorescent on FAF, while more posteriorly located “older” flecks become progressively more hypoautofluorescent with time. In Figure 3A, fleck progression can be visualized as a hyperautofluorescent wave moving outward, leaving behind a wake of hypoautofluorescent flecks. In Figures 3B and 3C, flecks extend radially, with a hyperautofluorescent leading edge, leaving behind a hypoautofluorescent trailing edge (see boxed area and insert in Figure 3B and 3C).
Progressive fleck-associated changes are also observed on NIA imaging. Longitudinal imaging of study eyes revealed a similar pattern of centrifugal spread of autofluorescence alterations from the fovea (Fig 4). The overall pattern on NIA imaging appeared as a progressive spread of predominantly hypoautofluorescent lesions. A few lesions demonstrated increased autofluorescence and these tended to be distributed near the periphery of the overall pattern of altered autofluorescence. As was noted on FAF imaging, on NIA imaging, flecks that appeared hyperautofluoresent were observed to become hypoautofluorescent with time (Fig 4A, box).
Figure 4. Longitudinal changes in fundus autofluorescence of fleck lesions in Stargardt disease captured using 795 nm excitation (NIA) in patient #2.
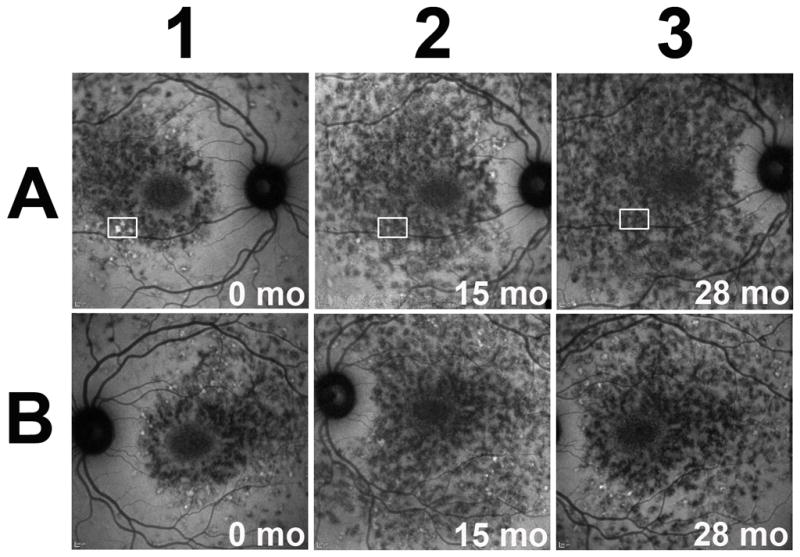
Autofluorescence images of the right (A) and left (B) eyes of a Stargardt patient with fleck lesions captured on NIA imaging. The NIA autofluorescent patterns occur symmetrically between both eyes. Diffuse areas of hypoautofluorescence with few hyperautofluorescent flecks were observed mostly near outer border of the affected area. These areas of hypoautofluorescence demonstrate outward expansion from the center to the periphery of the macula. Areas of hyperautofluorescence can be observed to decrease as a function of time (boxed areas).
Correlation of fleck-associated abnormal autofluorescence between FAF and NIA imaging
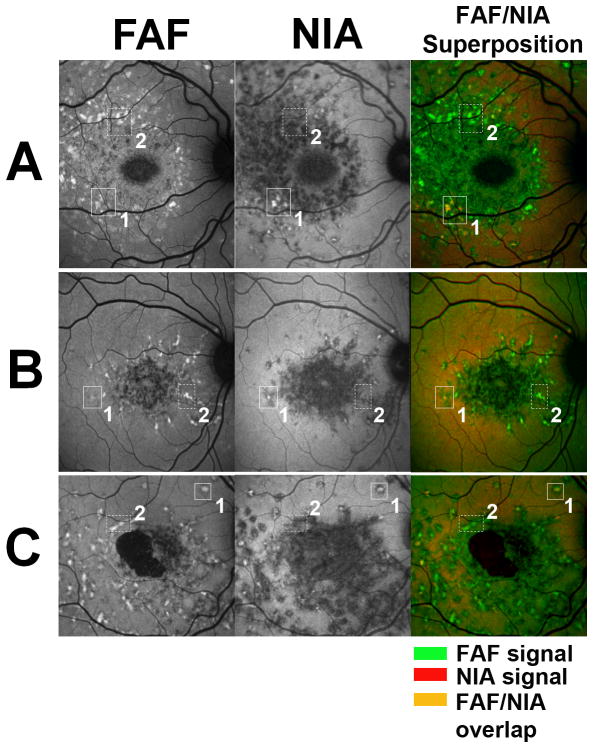
Spatial correlation of fleck-associated abnormal autofluorescence on FAF and NIA imaging was performed by superimposing color-coded FAF and NIA images from the same time-point. We observed that fleck-associated changes from background fluorescence were correlated across the two modalities. The majority of hyperautofluorescent flecks seen on NIA (coded in red) corresponded with hyperautofluorescent flecks seen on FAF (coded in green), resulting in orange-colored lesions on image superimposition (Figure 5, solid boxes labeled 1). However, many more hyperautofluorescent flecks on FAF corresponded with hypoautofluorescent flecks on NIA, resulting in a superimposed image that is primarily green (Figure 5, dashed boxes labeled 2). This indicated that while early hyperautofluorescent flecks became hypoautofluorescent over time on both FAF and NIA imaging, fleck associated-hyperautofluorescence on NIA may precede or be concurrent with that on FAF, while hyperautofluorescence on FAF is unlikely to precede that on NIA.
Figure 5. Correlative Analysis of FAF and NIAautofluorescence imaging of fleck lesions in Stargardt disease.
Autofluorescence images of 3 Stargardt patients (A=patient #2, B= patient #3, C=patient #1) with fleck lesions captured on FAF and NIA imaging. Correlation between modalities shows that fleck-like lesions are matched between FAF and NIA images. Color composites (right) superimpose FAF (coded in green) and NIA (coded in red) images. A subset of lesions were found to be both hyperautofluorescent on FAF and NIA (outlined in boxes labeled 1), which on color superimposition appear orange (superposition of green and red hyperautofluorescent signals). Another subset of lesions were found to be hyperautofluorescent on FAF but hypoautofluorescent on NIA (outlined in dashed boxes labeled 2), which on color superimposition appear green. There were no lesions that appeared hyperautofluorescent on NIA but hypoautofluorescent on FAF. A few lesions appearing as red on the color composite image were comprised of lesions that were strongly hyperautofluorescent on NIA and close to background autofluorescence on FAF.
Discussion
Descriptions of the clinical course of Stargardt disease, studied primarily from clinical examination and CFP, have depicted a process of increasing fleck accumulation and macular atrophy. Here we have followed the natural history of the disease with autofluoresence imaging captured using two ranges of excitation and emission wavelengths and performed longitudinal and cross-modality analyses of the data.
Our observations reveal that the spatial accumulation of flecks in Stargardt disease in the macula did not develop randomly across the macula but progressed spatially from the fovea in an intriguing radial pattern. This pattern indicates that the earliest events leading to fleck formation occur close to the fovea and that foveal-to-peripheral gradients in the retina - such as the distribution cone photoreceptors26, RPE cells27, and intraretinal concentrations of melanin14, and macular pigment28 - may contribute to fleck progression. One possibility is that the high density of cones at the fovea may specify it as the initial locus where a limiting factor (e.g. ability to sustain metabolic activity) is exceeded, which leads to the formation of byproducts that negatively influences neighboring cones. Our analysis also reveals that fleck lesions in some cases spread contiguously, suggesting that intercellular communications may play a role in disease progression whereby affected cells induce pathological alterations in directly adjacent cells, thus driving a continuous spatial spread of fleck lesions.
Another interesting observation in the natural history of fleck lesions was the varying nature of the fleck-associated autofluorescent signal over time. Fleck lesions on FAF imaging were observed, in general, to increase in hyperautofluorescence, reach a peak of hyperautofluorescence, then decrease subsequently in autofluorescence to near-background levels, and eventually become hypoautofluorescent relative to background – a pattern that has been similarly reported in the progression of geographic atrophy in eyes with AMD25, 29. In Stargardt disease, this progression of fluorescent changes in individual flecks can be most dramatically visualized in the supplementary movies (Movie 1, 2, 3).
Changes in fleck autofluorescence were also apparent on NIA imaging, but these appeared to progress on a different temporal scale compared to FAF imaging. This pattern suggests that while flecks on NIA imaging undergo a similar decay of autofluorescent signal such as that seen on FAF imaging, the rate of decay into hypofluorecence may occur more quickly in NIA than FAF imaging. These longitudinal observations may be summarized graphically in a model time-line of changes on the two different imaging modalities (Figure 6).
Figure 6.
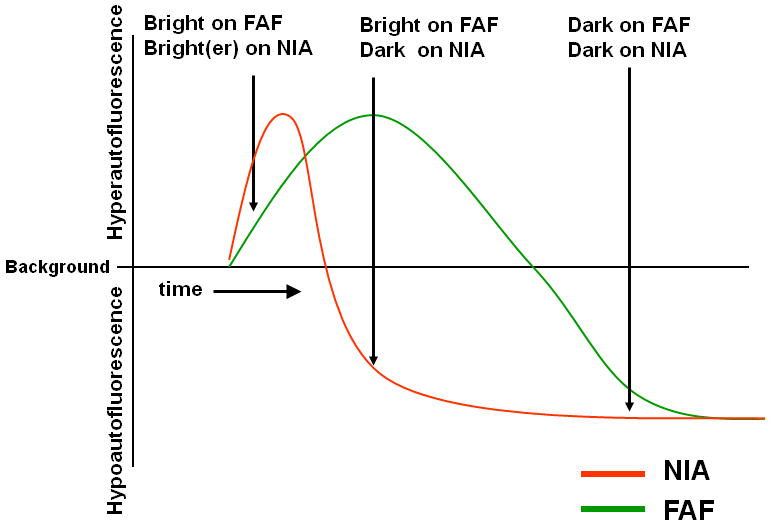
Graphical model representing the time-dependent changes in autofluorescent changes on FAF and NIA imaging in fleck lesions of Stargardt disease.
Several studies, including ones performed by Delori et al over 15 years ago16, have identified lipofuscin in the retina as a primary fluorophore excited at 488nm17. More recent studies of the distribution of autofluorescent patterns and spectral properties of the measured fluorescence suggest that melanin may be a key fluorophore in the fundus at longer wavelengths, contributing to the NIA pattern7, 14, 17, 23, 30. These longitudinal observations may relate to how lipofuscin and melanin composition and distribution may change in vivo within diseased RPE cells. These changing compositions may be associated with cellular changes observed in histopathological study of RPE cells in Stargardt disease where apart from RPE cell atrophy located near the central macula in some eyes3–5, substantial cellular changes were also observed in nearby macula. In intact RPE cells, lipofuscin granules have been observed to accumulate in these cells, displacing intracellular melanin granules. Histopathologically, lipofuscin content in affected RPE cells has been observed to further increase, followed by fusion between lipofuscin and melanin granules 3 later leading to the eventual loss of most of the melanin granules4. The accumulation of lipofuscin displacing melanin granules apically, combined with the generation of intermediates such as melanolipofuscin and oxidized melanin, may underly the increases in autofluorescence on NIA31. Later continued accumulation of lipofuscin with loss of melanin granules may be reflected in the increase in lipofuscin-associated FAF signal and concurrent decrease in the melanin-associated NIA signal. With time, RPE cells become engorged with lipofuscin granules and finally undergo deterioration with the breakdown of cellular membranes and the ultimate lysis and death of the RPE cell, which may culminate in loss of autofluorescence on both FAF and NIA imaging and the emergence of clinically evident atrophy. It is notable that frank clinical atrophy in Stargardt disease and the concurrent loss of all autofluorescence signals typically occurs in the region of decreased FAF signal, as a final event following earlier fleck-related autofluorescence changes in the same area. As the hypofluorescence on FAF of these atrophic areas is quite distinct, FAF has been used to detect areas of atrophy in an attempt to properly measure them32. Interestingly, confluent areas of hypoautofluorescence or absent FAF correlate with loss of photoreceptor inner/outer segment reflectivity and RPE on optical coherence tomography33. The status of photoreceptors overlying areas of abnormal or patchy FAF is less clear. New technologies, such as adaptive optics, will likely be important in linking these fluorescent changes directly to photoreceptor loss34 and early studies suggest that increased FAF is correlated with increased cone photoreceptor spacing34.
Identifying a temporal-spatial pattern of change in Stargardt disease may provide insights into the underlying disease pathogenesis and may be helpful to clinicians in following its course. These patterns of progression, when quantified, can also be useful in the development of new outcome measurements for clinical trials testing novel therapies for Stargardt disease. Since these changing autofluorescence patterns may reflect intracellular events in RPE cells, they may be helpful in gauging the biological effect of potential therapies and in interpreting treatment effects. Longitudinal cross-modality autofluorescence imaging may constitute a useful ancillary evaluation technique for the clinical follow-up and clinical trial study of Stargardt disease.
Supplementary Material
Movie comprised of 4 aligned FAF images of the right and left eye of Patient 3 spaced 11 months, 31 months and 57 months after the baseline image.
Movie comprised of 5 aligned FAF images of the right and left eye of Patient 2 spaced 11, 24, 40 and 53 months after the baseline image.
Movie comprised of 3 aligned FAF images of the right and left eye of Patient 1 spaced 15 months and 36 months after the baseline image.
Acknowledgments
Dr. Catherine Cukras had full access to all the data in the study and takes responsibility for the integrity of the data and the accuracy of the data analysis.
This work has been supported by the National Eye Institute Intramural Research Program. None of the authors has proprietary interests related to the material in this manuscript.
References
- 1.Stargardt K. Uber familiare, progressive degeneration in der maculagegend des auges. Graefes Arch Ophthalmol. 1909;71:534–550. [Google Scholar]
- 2.Rotenstreich Y, Fishman GA, Anderson RJ. Visual acuity loss and clinical observations in a large series of patients with Stargardt disease. Ophthalmology. 2003;110(6):1151–1158. doi: 10.1016/S0161-6420(03)00333-6. [DOI] [PubMed] [Google Scholar]
- 3.Birnbach CD, Jarvelainen M, Possin DE, Milam AH. Histopathology and immunocytochemistry of the neurosensory retina in fundus flavimaculatus. Ophthalmology. 1994;101(7):1211–1219. doi: 10.1016/s0161-6420(13)31725-4. [DOI] [PubMed] [Google Scholar]
- 4.Eagle RC, Jr, Lucier AC, Bernardino VB, Jr, Yanoff M. Retinal pigment epithelial abnormalities in fundus flavimaculatus: a light and electron microscopic study. Ophthalmology. 1980;87(12):1189–1200. doi: 10.1016/s0161-6420(80)35106-3. [DOI] [PubMed] [Google Scholar]
- 5.Steinmetz RL, Garner A, Maguire JI, Bird AC. Histopathology of incipient fundus flavimaculatus. Ophthalmology. 1991;98(6):953–956. doi: 10.1016/s0161-6420(91)32197-3. [DOI] [PubMed] [Google Scholar]
- 6.Sparrow JR, Fishkin N, Zhou J, et al. A2E, a byproduct of the visual cycle. Vision Res. 2003;43(28):2983–2990. doi: 10.1016/s0042-6989(03)00475-9. [DOI] [PubMed] [Google Scholar]
- 7.Weiter JJ, Delori FC, Wing GL, Fitch KA. Retinal pigment epithelial lipofuscin and melanin and choroidal melanin in human eyes. Invest Ophthalmol Vis Sci. 1986;27(2):145–152. [PubMed] [Google Scholar]
- 8.Kennedy CJ, Rakoczy PE, Constable IJ. Lipofuscin of the retinal pigment epithelium: a review. Eye (Lond) 1995;9 ( Pt 6):763–771. doi: 10.1038/eye.1995.192. [DOI] [PubMed] [Google Scholar]
- 9.Allikmets R, Singh N, Sun H, et al. A photoreceptor cell-specific ATP-binding transporter gene (ABCR) is mutated in recessive Stargardt macular dystrophy. Nat Genet. 1997;15 (3):236–246. doi: 10.1038/ng0397-236. [DOI] [PubMed] [Google Scholar]
- 10.Beharry S, Zhong M, Molday RS. N-retinylidene-phosphatidylethanolamine is the preferred retinoid substrate for the photoreceptor-specific ABC transporter ABCA4 (ABCR) J Biol Chem. 2004;279(52):53972–53979. doi: 10.1074/jbc.M405216200. [DOI] [PubMed] [Google Scholar]
- 11.Weng J, Mata NL, Azarian SM, Tzekov RT, Birch DG, Travis GH. Insights into the function of Rim protein in photoreceptors and etiology of Stargardt’s disease from the phenotype in abcr knockout mice. Cell. 1999;98(1):13–23. doi: 10.1016/S0092-8674(00)80602-9. [DOI] [PubMed] [Google Scholar]
- 12.Ben-Shabat S, Parish CA, Vollmer HR, et al. Biosynthetic studies of A2E, a major fluorophore of retinal pigment epithelial lipofuscin. J Biol Chem. 2002;277(9):7183–7190. doi: 10.1074/jbc.M108981200. [DOI] [PubMed] [Google Scholar]
- 13.Sparrow JR, Zhou J, Ben-Shabat S, Vollmer H, Itagaki Y, Nakanishi K. Involvement of oxidative mechanisms in blue-light-induced damage to A2E-laden RPE. Invest Ophthalmol Vis Sci. 2002;43(4):1222–1227. [PubMed] [Google Scholar]
- 14.Keilhauer CN, Delori FC. Near-infrared autofluorescence imaging of the fundus: visualization of ocular melanin. Invest Ophthalmol Vis Sci. 2006;47(8):3556–3564. doi: 10.1167/iovs.06-0122. [DOI] [PubMed] [Google Scholar]
- 15.Sundelin SP, Nilsson SE, Brunk UT. Lipofuscin-formation in cultured retinal pigment epithelial cells is related to their melanin content. Free Radic Biol Med. 2001;30(1):74–81. doi: 10.1016/s0891-5849(00)00444-5. [DOI] [PubMed] [Google Scholar]
- 16.Delori FC, Staurenghi G, Arend O, Dorey CK, Goger DG, Weiter JJ. In vivo measurement of lipofuscin in Stargardt’s disease--Fundus flavimaculatus. Invest Ophthalmol Vis Sci. 1995;36(11):2327–2331. [PubMed] [Google Scholar]
- 17.Delori FC, Dorey CK. In vivo technique for autofluorescent lipopigments. Methods Mol Biol. 1998;108:229–243. doi: 10.1385/0-89603-472-0:229. [DOI] [PubMed] [Google Scholar]
- 18.Cideciyan AV, Swider M, Aleman TS, et al. Reduced-illuminance autofluorescence imaging in ABCA4-associated retinal degenerations. J Opt Soc Am A Opt Image Sci Vis. 2007;24(5):1457–1467. doi: 10.1364/josaa.24.001457. [DOI] [PMC free article] [PubMed] [Google Scholar]
- 19.Lois N, Halfyard AS, Bird AC, Holder GE, Fitzke FW. Fundus autofluorescence in Stargardt macular dystrophy-fundus flavimaculatus. Am J Ophthalmol. 2004;138(1):55–63. doi: 10.1016/j.ajo.2004.02.056. [DOI] [PubMed] [Google Scholar]
- 20.Gerth C, Andrassi-Darida M, Bock M, Preising MN, Weber BH, Lorenz B. Phenotypes of 16 Stargardt macular dystrophy/fundus flavimaculatus patients with known ABCA4 mutations and evaluation of genotype-phenotype correlation. Graefes Arch Clin Exp Ophthalmol. 2002;240(8):628–638. doi: 10.1007/s00417-002-0502-y. [DOI] [PubMed] [Google Scholar]
- 21.Sunness JS, Steiner JN. Retinal function and loss of autofluorescence in stargardt disease. Retina. 2008;28(6):794–800. doi: 10.1097/IAE.0b013e31816690bd. [DOI] [PubMed] [Google Scholar]
- 22.Smith RT, Gomes NL, Barile G, Busuioc M, Lee N, Laine A. Lipofuscin and autofluorescence metrics in progressive STGD. Invest Ophthalmol Vis Sci. 2009;50(8):3907–3914. doi: 10.1167/iovs.08-2448. [DOI] [PMC free article] [PubMed] [Google Scholar]
- 23.Piccolino FC, Borgia L, Zinicola E, Iester M, Torrielli S. Pre-injection fluorescence in indocyanine green angiography. Ophthalmology. 1996;103(11):1837–1845. doi: 10.1016/s0161-6420(96)30418-1. [DOI] [PubMed] [Google Scholar]
- 24.Kellner S, Kellner U, Weber BH, Fiebig B, Weinitz S, Ruether K. Lipofuscin- and melanin-related fundus autofluorescence in patients with ABCA4-associated retinal dystrophies. Am J Ophthalmol. 2009;147(5):895–902. 902, e891. doi: 10.1016/j.ajo.2008.12.023. [DOI] [PubMed] [Google Scholar]
- 25.Schmitz-Valckenberg S, Bindewald-Wittich A, Dolar-Szczasny J, et al. Correlation between the area of increased autofluorescence surrounding geographic atrophy and disease progression in patients with AMD. Invest Ophthalmol Vis Sci. 2006;47(6):2648–2654. doi: 10.1167/iovs.05-0892. [DOI] [PubMed] [Google Scholar]
- 26.Wikler KC, Williams RW, Rakic P. Photoreceptor mosaic: number and distribution of rods and cones in the rhesus monkey retina. J Comp Neurol. 1990;297(4):499–508. doi: 10.1002/cne.902970404. [DOI] [PubMed] [Google Scholar]
- 27.Snodderly DM, Sandstrom MM, Leung IY, Zucker CL, Neuringer M. Retinal pigment epithelial cell distribution in central retina of rhesus monkeys. Invest Ophthalmol Vis Sci. 2002;43(9):2815–2818. [PubMed] [Google Scholar]
- 28.Wolf-Schnurrbusch UE, Roosli N, Weyermann E, Heldner MR, Hohne K, Wolf S. Ethnic differences in macular pigment density and distribution. Invest Ophthalmol Vis Sci. 2007;48 (8):3783–3787. doi: 10.1167/iovs.06-1218. [DOI] [PubMed] [Google Scholar]
- 29.Holz FG, Bindewald-Wittich A, Fleckenstein M, Dreyhaupt J, Scholl HP, Schmitz-Valckenberg S. Progression of geographic atrophy and impact of fundus autofluorescence patterns in age-related macular degeneration. Am J Ophthalmol. 2007;143(3):463–472. doi: 10.1016/j.ajo.2006.11.041. [DOI] [PubMed] [Google Scholar]
- 30.Gibbs D, Cideciyan AV, Jacobson SG, Williams DS. Retinal pigment epithelium defects in humans and mice with mutations in MYO7A: imaging melanosome-specific autofluorescence. Invest Ophthalmol Vis Sci. 2009;50(9):4386–4393. doi: 10.1167/iovs.09-3471. [DOI] [PMC free article] [PubMed] [Google Scholar]
- 31.Kellner U, Kellner S, Weinitz S. Fundus autofluorescence (488 NM) and near-infrared autofluorescence (787 NM) visualize different retinal pigment epithelium alterations in patients with age-related macular degeneration. Retina. 30(1):6–15. doi: 10.1097/iae.0b013e3181b8348b. [DOI] [PubMed] [Google Scholar]
- 32.Chen B, Tosha C, Gorin MB, Nusinowitz S. Analysis of autofluorescent retinal images and measurement of atrophic lesion growth in Stargardt disease. Exp Eye Res. 912:143–152. doi: 10.1016/j.exer.2010.03.021. [DOI] [PubMed] [Google Scholar]
- 33.Gomes NL, Greenstein VC, Carlson JN, et al. A comparison of fundus autofluorescence and retinal structure in patients with Stargardt disease. Invest Ophthalmol Vis Sci. 2009;50 (8):3953–3959. doi: 10.1167/iovs.08-2657. [DOI] [PMC free article] [PubMed] [Google Scholar]
- 34.Chen Y, Ratnam K, Sundquist SM, et al. Cone photoreceptor abnormalities correlate with vision loss in patients with stargardt disease. Invest Ophthalmol Vis Sci. 52(6):3281–3292. doi: 10.1167/iovs.10-6538. [DOI] [PMC free article] [PubMed] [Google Scholar]
Associated Data
This section collects any data citations, data availability statements, or supplementary materials included in this article.
Supplementary Materials
Movie comprised of 4 aligned FAF images of the right and left eye of Patient 3 spaced 11 months, 31 months and 57 months after the baseline image.
Movie comprised of 5 aligned FAF images of the right and left eye of Patient 2 spaced 11, 24, 40 and 53 months after the baseline image.
Movie comprised of 3 aligned FAF images of the right and left eye of Patient 1 spaced 15 months and 36 months after the baseline image.


